OPEN-SOURCE SCRIPT
Vervoort Volatility Bands [LazyBear]
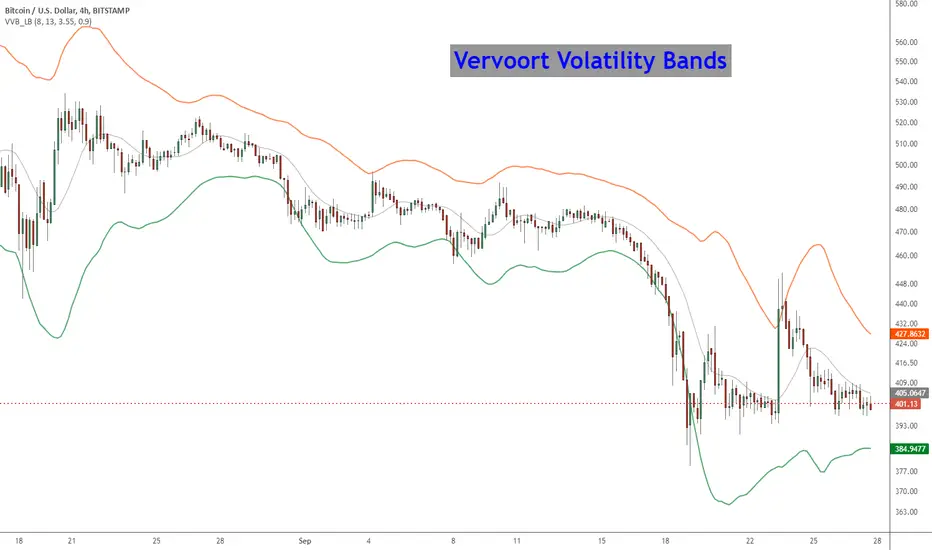
This is Mr. Vervoort's take on volatility bands. Sticking to his style, he uses highly smoothed data everywhere, also improves on the way the bands are calculated. Is this better than others? I will let you guys decide :)
More info:
traders.com/Documentation/FEEDbk_docs/2013/08/Vervoort.html
List of my other indicators:
- Chart: tradingview.com/v/4IneGo8h/
- GDoc: docs.google.com/document/d/15AGCufJZ8CIUvwFJ9W-IKns88gkWOKBCvByMEvm5MLo/edit?usp=sharing
More info:
traders.com/Documentation/FEEDbk_docs/2013/08/Vervoort.html
List of my other indicators:
- Chart: tradingview.com/v/4IneGo8h/
- GDoc: docs.google.com/document/d/15AGCufJZ8CIUvwFJ9W-IKns88gkWOKBCvByMEvm5MLo/edit?usp=sharing
סקריפט קוד פתוח
ברוח האמיתית של TradingView, יוצר הסקריפט הזה הפך אותו לקוד פתוח, כך שסוחרים יוכלו לעיין בו ולאמת את פעולתו. כל הכבוד למחבר! אמנם ניתן להשתמש בו בחינם, אך זכור כי פרסום חוזר של הקוד כפוף ל־כללי הבית שלנו.
List of my free indicators: bit.ly/1LQaPK8
List of my indicators at Appstore: blog.tradingview.com/?p=970
List of my indicators at Appstore: blog.tradingview.com/?p=970
כתב ויתור
המידע והפרסומים אינם מיועדים להיות, ואינם מהווים, ייעוץ או המלצה פיננסית, השקעתית, מסחרית או מכל סוג אחר המסופקת או מאושרת על ידי TradingView. קרא עוד ב־תנאי השימוש.