Session Volume Profile – Asia, London, NYSession Volume Profile – Asia, London, New York
Product Description
This tool displays intraday volume distribution for the Asian, London, and New York trading sessions.
It provides a visual breakdown of where trading activity concentrated during each session, helping users study volume structure across global market phases.
What the Tool Shows
1. Session Levels
Each session plots three main reference levels:
Point of Control (POC) — the price level with the highest volume traded during that session
Value Area High (VAH) — upper boundary of the primary volume region
Value Area Low (VAL) — lower boundary of the primary volume region
Each session is assigned its own color for easier differentiation.
2. Session Volume Histogram
A horizontal volume histogram displays how activity is distributed within each session.
Longer bars indicate higher relative volume at that price.
3. Session Highlighting (Optional)
Background shading can be enabled to visually identify the current active session.
4. Session Countdown (Optional)
A small text label shows how much time is left in the current session. This is for chart awareness only.
How to Read the Display (Educational Use Only)
POC is often viewed by many traders as a key reference point when studying intraday balance or activity clusters.
VAH / VAL can help users observe where the majority of volume occurred within a session.
Comparing session profiles may help identify how participation shifts from Asia → London → New York.
Observing how price interacts with these historical volume areas can provide context when studying intraday structure.
This panel does not generate trading signals. It is intended for chart analysis, market study, and understanding how volume distributes across global sessions.
Customization Options
Accessible via Settings → Inputs:
Enable/disable any session
Adjust value area percentage
Modify histogram density
Adjust visual opacity
Toggle countdown timer or session shading
These options allow users to tailor the display to different chart styles and timeframes.
Notes
This tool is for educational and informational purposes only.
It does not provide trading or financial advice.
No signals are produced; all outputs are historical/analytical.
Code is published as protected/closed-source to preserve the structure of the underlying calculations.
#newyorksession

Sessions Pro+ (@JP7FX)Sessions Pro Plus (JP7FX)
Sessions Pro Plus marks key trading sessions and gives real time session information. It helps traders track session behaviour without manual work.
Session Info Panel
Shows live updates for Tokyo, Frankfurt, London and New York.
Displays if session highs or lows are intact or taken.
Includes a countdown to the next session start.
Range High and Low Alerts
Alerts trigger when a session high or low is breached.
Useful for monitoring breaks, sweeps and changes in behaviour.
Daily Open Bias
Shows whether price is above or below the daily open.
Helps traders understand directional conditions quickly.
Custom Session Settings
Session times can be adjusted to fit personal trading hours.
Sessions can be renamed and recoloured for clarity.
Webhook and Real Time Alerts
Alerts support webhook integrations for external platforms, including Discord.
Countdown Timers
Displays countdowns to the next session open to help plan ahead.
This indicator is designed for traders who follow session timing, session highs and lows, and daily open behaviour. It aims to simplify chart preparation and reduce the need to track session information manually.

TMT Sessions - Hitesh_NimjeTMT Session - HiteshNimje
Overview
This indicator highlights four configurable trading sessions (default: New York / London / Tokyo / Sydney) and draws session ranges, session VWAPs, session mean/trendline, max/min lines and optional dashboard info. It was built for students of Thought Magic Trading (TMT) to quickly visualize intraday structure across major sessions.
Key features
4 separate sessions (A/B/C/D) — customizable names, times and colors.
Session Range boxes (high/low), optional outline and labels.
VWAP per session (volume-weighted average price).
Mean / Trendline for session price (optional).
Optional session Max/Min lines.
Small on-chart descriptive labels explaining what each plotted line means.
Simple dashboard showing session status (Active/Inactive), volume, trend strength and standard deviation (optional).
Timezone offset or use exchange timezone.
Default colors
Session A — Blue
Session B — Black
Session C — Red
Session D — Orange
Usage / Notes
Designed for intraday analysis — works best on intraday timeframes.
Toggle any session, overlay, or label via input settings to reduce chart clutter.
Labels and dashboard are optional; enable them only when you want the additional on-chart information.
The indicator does not provide buy/sell signals. Use it as a structural reference in conjunction with your trading plan.
Access & License
EXCLUSIVE ACCESS: This indicator is for TMT students only.
Distribution: Invite-only (author permission required) — the author will grant access by invitation.
Redistribution, modification, or public reposting without permission is prohibited.
Support / Contact
For access requests or issues, contact the author: Hitesh_Nimje (Thought Magic Trading).
(Provide invite requests directly to the author — do not attempt to share copies.)
Disclaimer
For educational purposes only. Trading involves risk. Past performance is not indicative of future results. The author is not responsible for trading losses.

GT3_Trades Sessions Highs & LowsThis indicator automatically identifies and displays the session highs and lows for the three major global market sessions: Asia, London, and New York. It is designed for intraday traders who rely on session-based structure, liquidity levels, and volatility windows. The script dynamically tracks and plots the highest and lowest price reached during each session and extends these levels forward on the chart for strong visual clarity.
Key Features
Session-Based Highs & Lows
Calculates and updates the high and low for each session (Asia, London, New York) in real time as price develops within the session window.
Fully Customizable Display Options
Traders can individually toggle the visibility of each session’s high and low levels.
Line colors, styles (Solid, Dashed, Dotted), and thickness are also user-configurable.
Accurate Timezone Handling
Session times are defined using user-selected timezone settings (default UTC+3), ensuring session boundaries match the trader’s desired market timing.
Automatic Daily Reset
At the start of each new trading day, the indicator clears the previous levels and begins tracking fresh highs and lows for the new day.
Dynamic Line Drawing
Each level is plotted using real Pine Script line objects, which update automatically as new highs or lows form. Once created, each line extends forward to the right—providing clear, persistent references for potential liquidity zones, breakouts, and reversions.
Efficient Tracking Logic
The script keeps track of the bar index where each high/low occurs and updates the line endpoints in real time. Historical levels are not reused, ensuring clean, uncluttered visuals.
How It Helps Traders
Identifies liquidity pools and sweep areas based on session extremes.
Highlights intraday structure shifts when price breaks or respects session highs/lows.
Provides a clear overview of volatility cycles across the global trading day.
Helps detect potential reversal or continuation setups when interacting with session boundaries.
Ideal For
Intraday and scalping strategies
ICT-based session analysis
Liquidity, sweep, and FVG traders
Forex, indices, crypto, and commodities

Forex Session TrackerForex Session Tracker - Professional Trading Session Indicator
The Forex Session Tracker is a comprehensive and visually intuitive indicator designed specifically for forex traders who need precise tracking of major global trading sessions. This powerful tool helps traders identify active market sessions, monitor session-specific price ranges, and capitalize on volatility patterns unique to each trading period.
Understanding when major financial centers are active is crucial for forex trading success. This indicator provides real-time visualization of the Tokyo, London, New York, and Sydney trading sessions, allowing traders to align their strategies with peak liquidity periods and avoid low-volatility trading windows.
---
Key Features
📊 Four Major Global Trading Sessions
The indicator tracks all four primary forex trading sessions with precision:
- Tokyo Session (Asian Market) - Captures the Asian trading hours, ideal for JPY, AUD, and NZD pairs
- London Session (European Market) - Monitors the most liquid trading period, perfect for EUR, GBP pairs
- New York Session (American Market) - Tracks US market hours, essential for USD-based currency pairs
- Sydney Session (Pacific Market) - Identifies the opening of the trading week and AUD/NZD activity
Each session is fully customizable with individual color schemes, making it easy to distinguish between different market periods at a glance.
🎯 Session Range Visualization
For each active trading session, the indicator automatically:
- Draws rectangular boxes that highlight the session's time period
- Tracks and displays session HIGH and LOW price levels in real-time
- Creates horizontal lines at session extremes for easy reference
- Positions session labels at the center of each trading period
- Updates dynamically as new highs or lows are formed within the session
This visual approach helps traders quickly identify:
- Session breakout opportunities
- Support and resistance zones formed during specific sessions
- Range-bound vs. trending session behavior
- Key price levels that institutional traders are watching
📱 Live Information Dashboard
A sleek, professional information panel displays:
- Real-time session status - Instantly see which sessions are currently active
- Color-coded indicators - Green dots for active sessions, gray for closed sessions
- Timezone information - Confirms your current timezone settings
- Customizable positioning - Place the dashboard anywhere on your chart (Top Left, Top Right, Bottom Left, Bottom Right)
- Adjustable size - Choose from Tiny, Small, Normal, or Large text sizes for optimal visibility
The dashboard provides at-a-glance awareness of market conditions without cluttering your chart analysis.
⚙️ Extensive Customization Options
Every aspect of the indicator can be tailored to your trading preferences:
Session-Specific Controls:
- Enable/disable individual sessions
- Customize colors for each trading period
- Adjust session times to match your broker's server time
- Toggle background highlighting on/off
- Show/hide session high/low lines independently
General Settings:
- UTC Offset Control - Adjust timezone from UTC-12 to UTC+14
- Exchange Timezone Option - Automatically use your chart's exchange timezone
- Background Transparency - Fine-tune the opacity of session highlighting (0-100%)
- Session Labels - Show or hide session name labels
- Information Panel - Toggle the live status dashboard on/off
Style Settings:
- Turn session backgrounds ON/OFF directly from the Style tab
- Maintain clean charts while keeping all analytical features active
🔔 Built-in Alert System
Stay informed about session openings with customizable alerts:
- Tokyo Session Started
- London Session Started
- New York Session Started
- Sydney Session Started
Set up notifications to never miss important market opening periods, even when you're away from your charts.
---
How to Use This Indicator
For Day Traders:
1. Identify High-Volatility Periods - Focus your trading during London and New York session overlaps for maximum liquidity
2. Monitor Session Breakouts - Watch for price breaks above/below session highs and lows
3. Avoid Low-Volume Periods - Recognize when major sessions are closed to avoid false signals
For Swing Traders:
1. Mark Key Levels - Use session highs and lows as support/resistance zones
2. Track Multi-Session Patterns - Observe how price behaves across different trading sessions
3. Plan Entry/Exit Points - Time your trades around session openings for better execution
For Currency-Specific Traders:
1. JPY Pairs - Focus on Tokyo session movements
2. EUR/GBP Pairs - Monitor London session activity
3. USD Pairs - Track New York session volatility
4. AUD/NZD Pairs - Watch Sydney and Tokyo sessions
---
Technical Specifications
- Pine Script Version: 5
- Overlay Indicator: Yes (displays directly on price chart)
- Maximum Bars Back: 500
- Drawing Objects: Up to 500 lines, boxes, and labels
- Performance: Optimized for real-time data processing
- Compatibility: Works on all timeframes (recommended: 5m to 1H for session tracking)
---
Installation & Setup
1. Add to Chart - Click "Add to Chart" after copying the script to Pine Editor
2. Configure Timezone - Set your UTC offset or enable "Use Exchange Timezone"
3. Customize Colors - Choose your preferred color scheme for each session
4. Adjust Display - Enable/disable features based on your trading style
5. Set Alerts - Create alert notifications for session starts
---
Best Practices
✅ Combine with Price Action - Use session ranges alongside candlestick patterns for confirmation
✅ Watch Session Overlaps - The London-New York overlap (1300-1600 UTC) typically shows highest volatility
✅ Respect Session Highs/Lows - These levels often act as intraday support and resistance
✅ Adjust for Your Broker - Verify session times match your broker's server clock
✅ Use Multiple Timeframes - View sessions on both lower (15m) and higher (1H) timeframes for context
---
Why Choose Forex Session Tracker Pro?
✨ Professional Grade Tool - Built with clean, efficient code following TradingView best practices
✨ Beginner Friendly - Intuitive design with clear visual cues
✨ Highly Customizable - Adapt every feature to match your trading style
✨ Performance Optimized - Lightweight code that won't slow down your charts
✨ Actively Maintained - Regular updates and improvements
✨ No Repainting - All visual elements are fixed once the session completes
---
Support & Updates
This indicator is designed to provide reliable, accurate session tracking for forex traders of all experience levels. Whether you're a scalper looking for high-volatility windows or a position trader marking key institutional levels, the Forex Session Tracker Pro delivers the insights you need to make informed trading decisions.
Happy Trading! 📈
---
Disclaimer
This indicator is a tool for technical analysis and should be used as part of a comprehensive trading strategy. Past performance does not guarantee future results. Always practice proper risk management and never risk more than you can afford to lose. Trading forex carries a high level of risk and may not be suitable for all investors.

Quantura - Session High/LowIntroduction
“Quantura – Session High/Low” is a professional-grade session mapping indicator that automatically identifies and visualizes the highs, lows, and ranges of key global trading sessions — London, New York, and Asia. It helps traders understand when and where liquidity tends to accumulate, allowing for better market structure analysis and session-based strategy alignment.
Originality & Value
This indicator unifies the three most influential global sessions into a single, adaptive visualization tool. Unlike typical session indicators, it dynamically updates live session highs and lows in real time while marking session boundaries and transitions. Its multi-session management system allows for immediate recognition of overlapping liquidity zones — a crucial feature for institutional and intraday traders.
The value and originality come from:
Real-time tracking of session highs, lows, and developing ranges.
Simultaneous visualization of multiple global sessions.
Optional vertical range lines for clearer visual segmentation.
Customizable session times, colors, and time zone offset for global accuracy.
Automatically extending and updating lines as each session progresses.
Functionality & Core Logic
Detects the start and end of each trading session (London, New York, Asia) using built-in time logic and user-defined UTC offsets.
Initializes session-specific high and low variables at the start of each new session.
Continuously updates session high/low levels as new candles form.
Draws color-coded horizontal lines for each session’s high and low.
Optionally adds vertical dotted lines to visually connect session range extremes.
Locks each session’s range once it ends, preserving historical structure for review.
Parameters & Customization
New York Session: Enable/disable, customize time (default 15:30–21:30), and set color.
London Session: Enable/disable, customize time (default 09:00–16:30), and set color.
Asia Session: Enable/disable, customize time (default 02:30–08:00), and set color.
Vertical Line: Toggle dotted vertical lines connecting session high and low levels.
UTC Offset: Adjust session timing to align with your chart’s local time zone.
Visualization & Display
Each session is color-coded for quick identification (default: blue for London, red for New York, green for Asia).
Horizontal lines track evolving session highs and lows in real time.
Once a session closes, the lines remain fixed to mark historical range boundaries.
Vertical dotted lines (optional) visually connect the session’s high and low for clarity.
Supports full overlay display without interfering with other technical indicators.
Use Cases
Identify liquidity zones and range extremes formed during active trading sessions.
Observe session overlaps (London–New York) to anticipate volatility spikes.
Combine with volume or market structure tools for session-based confluence.
Track how price interacts with prior session highs/lows to detect potential reversals.
Analyze session-specific performance patterns for algorithmic or discretionary systems.
Limitations & Recommendations
The indicator is designed for intraday analysis and may not provide meaningful output on daily or higher timeframes.
Adjust session times and UTC offset based on your broker’s or exchange’s timezone.
Does not provide trading signals — it visualizes session structure only.
Combine with liquidity and volatility indicators for full contextual understanding.
Markets & Timeframes
Compatible with all asset classes — including crypto, forex, indices, and commodities — and optimized for intraday timeframes (1m–4h). Particularly useful for traders analyzing session overlaps and volatility transitions.
Author & Access
Developed 100% by Quantura. Published as a Open-source script indicator. Access is free.
Compliance Note
This description fully complies with TradingView’s Script Publishing Rules and House Rules . It provides a detailed explanation of functionality, parameters, and realistic use cases without making any performance or predictive claims.

Market SessionsMarket Sessions (Asian, London, NY, Pacific)
Summary
This indicator plots the main global market sessions (Asian, European, American, Pacific) as boxes on your chart, complete with dynamic high/low tracking.
It's an essential tool for intraday traders to track session-based volatility patterns and visualize key support/resistance levels (like the Asian Range) that often define price action for the rest of the day.
Who it’s for
Intraday traders, scalpers, and day traders who need to visualize market hours and session-based ranges. If your strategy depends on the London open, the New York close, or the Asian range, this script will map it out for you.
What it shows
Customizable Session Boxes: Four fully configurable boxes for the Asian, European (London), American (New York), and Pacific (Sydney) sessions.
Session High & Low: The script tracks and boxes the highest high and lowest low of each session, dynamically updating as the session progresses.
Session Labels: Clear labels (e.g., "AS", "EU") mark each session, anchored to the start time.
Key Features
Powerful Timezone Control: This is the core feature.
Use Exchange Timezone (Default): Simply enter session times (e.g., 8:00 for London) relative to the exchange's timezone (e.g., "NASDAQ" or "BINANCE").
Use UTC Offset: Uncheck the box and enter a UTC offset (e.g., +3 or -5). Now, all session times you enter are relative to that specific UTC offset. This gives you full control regardless of the chart you're on.
Fully Customizable: Toggle any session on/off.
Style Control: Change the fill color, border color, transparency, border width, and line style (Solid, Dashed, Dotted) for each session individually.
Smart Labels: Labels stay anchored to the start of the session (no "sliding") and float just above the session high.
Why this helps
Track Volatility & Market Behavior: Visually identify the "personality" of each session. Some sessions might consistently produce powerful pumps or dumps, while others are prone to sideways "chop" or accumulation. This indicator helps you see these repeating patterns.
Find Key Support/Resistance Levels: The High and Low of a session (e.g., the Asian Range) often become critical support and resistance levels for the next session (e.g., London). This script makes it easy to spot these "session-to-session" S/R flips and reactions.
Aid Statistical Analysis: The script provides the core visual data for your statistical research. You can easily track how often the London session breaks the Asian high, or which session is most likely to reverse the trend, helping you build a robust trading plan.
Context is King: Instantly see which market is active, which are overlapping (like the high-volume London-NY overlap), and which have closed.
Quick setup
Go to Timezone Settings.
Decide how you want to enter times:
Easy (Default): Leave Use Exchange Timezone checked. Enter session times based on the chart's native exchange (e.g., for BTC/USDT on Binance, use UTC+0 times).
Manual (Pro): Uncheck Use Exchange Timezone. Enter your UTC Offset (e.g., +2 for Berlin). Now, enter all session times as they appear on the clock in Berlin.
Go to each session tab (Asian, European...) to enable/disable it and set the correct start/end hours and minutes.
Style the colors to match your chart theme.
Disclaimer
For educational/informational purposes only; not financial advice. Trading involves risk—manage it responsibly.

FOREXSOM Session Boxes (Local Time) — Asian, London & New YorkFOREXSOM Session Boxes (Local Time) highlights the three major Forex sessions — Asian, London, and New York — using your chart’s local timezone automatically.
This indicator helps traders visualize market structure, liquidity zones, and timing across global trading hours with accuracy and clarity.
Key Features
Automatically adjusts to your chart’s local timezone
Highlights Asian, London, and New York sessions with clean color zones
Works on all timeframes and asset classes
Ideal for Smart Money Concepts (SMC), ICT, and price action strategies
Helps identify range breakouts, session highs/lows, and liquidity grabs
How It Works
Each session box updates in real time to show the current range as the market develops.
The boxes reset at the end of each session, making it easy to compare volatility and liquidity shifts between regions.
Sessions (default times):
Asian: 17:00 – 03:00
London: 02:00 – 11:00
New York: 07:00 – 16:00
How to Use
Add the indicator to your chart.
Ensure your chart timezone matches your local time in chart settings.
Watch session ranges form and look for liquidity sweeps or breakouts between overlaps (London/New York).
Created by FOREXSOM
Empowering traders worldwide with precision-built tools for Smart Money and institutional trading education.

Session AnchorsDescription
This indicator highlights the four main global trading sessions — London, New York AM, New York PM, and Asia — as color-coded boxes on the chart. Each session is defined by fixed start/end times (New York time) and dynamically updates with the evolving high and low during that interval. This provides a clear view of how volatility and structure shift as trading activity passes from one region to another.
How to use
• Works on any timeframe.
• Toggle sessions on/off based on your trading hours.
• Observe price behavior as one session closes and another opens.
• Use session boxes as context for liquidity, volatility, and structure analysis.
Originality
This script delivers a clean, customizable visualization of global market hours and session ranges, avoiding extra overlays so traders can isolate session-based behavior without distraction.
⚠️ Disclaimer
This indicator does not generate signals. It provides a structural mapping of global sessions for contextual analysis only.

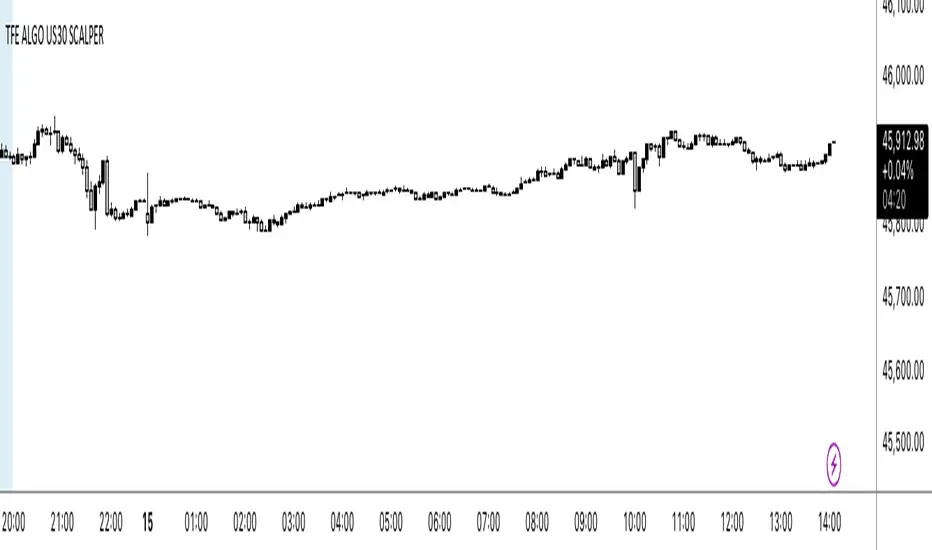
NY OPEN SIGNAL SCLAPER 📌 Indicator: US30 Scalper by TFE ALGOS
The US30 Scalper by TFE ALGOS is built for traders who want to capture fast and decisive moves on US30 during the New York session.
🔑 Key Features:
Clear Buy & Sell Signals with automatic plotting of trade levels.
Built-in Risk Management with stop loss and take profit levels, optimized at a 5:1 R:R.
Customizable Visuals – adjust colors, styles, and watermark display to fit your chart.
Alerts Included – stay updated when trade opportunities or key levels are reached.
Professional Branding – watermark logo keeps charts clean and consistent.
🎯 Designed For:
Scalpers and intraday traders who focus on US30.
Traders seeking a structured, professional charting tool.
⚠️ Disclaimer: This tool is for educational purposes only. Trading involves risk; always manage your capital wisely.
Forex Sessions(IST)📌 Forex Sessions (IST Version)
This indicator highlights the four major Forex market sessions — Asia, Frankfurt, London, and New York — automatically adjusted to Indian Standard Time (IST).
Session Timings in IST:
Asia: 02:30 – 10:30
🇩🇪 Frankfurt: 11:30 – 12:30
🇬🇧 London: 12:30 – 21:30
🇺🇸 New York: 17:30 – 02:30 (next day)
Trading Advantages:
Asia session → Spot the range high/low
Frankfurt → Detect inducement moves
London → Identify the main push/trend move
New York → Catch reversals & profit taking
Features:
Clean session highlights with custom colors
Optional tools: range, trendlines, mean, VWAP, max/min levels
Adjustable transparency and display settings
With this, you can easily track session overlaps, volatility shifts, and trade setups — all aligned with IST Forex timings.
Enhanced Market Sessions Indicator by NomadTradesEnhanced Market Sessions Indicator by NomadTrades
Summary
The Enhanced Market Sessions Indicator is a comprehensive trading tool that automatically identifies and marks the high and low price levels for Asia, London, and New York trading sessions. This indicator goes beyond basic session marking by extending previous session levels into the NY session as key support/resistance zones and providing real-time price interaction alerts when these levels are touched.
**Important Setup Notes:**
- **Update Your Timezone**: Ensure you select the correct timezone in the indicator settings to match your trading preferences
- **Verify Session Times**: Double-check that the default session times align with your market analysis requirements, as market hours may vary due to seasonal changes or regional differences
Key Features
**Session Tracking & Visualization**
- **Automatic Session Detection**: Identifies Asia (2300-0800), London (0800-1330), and New York (1430-2100) sessions
- **High/Low Marking**: Draws solid horizontal lines showing each session's highest and lowest price points
- **Color-Coded System**: Distinct colors for each session (Red for Asia, Blue for London, Green for NY)
- **Session Labels**: Clear price labels showing exact high/low values for easy reference
**Advanced Level Extension**
- **Smart Line Extension**: Automatically extends Asia and London session levels into the NY session as dashed lines
- **Key Level Identification**: Transforms previous session levels into actionable support/resistance zones
- **Visual Distinction**: Extended lines use transparent, dashed styling to differentiate from active session boundaries
**Real-Time Alert System**
- **Price Interaction Alerts**: Sends TradingView notifications when price touches Asia or London levels during NY session
- **Customizable Tolerance**: Adjustable touch sensitivity (0.01% to 1.0%) for precise interaction detection
- **Visual Confirmation**: Displays colored labels on chart when price interactions occur
- **Duplicate Prevention**: Smart logic prevents multiple alerts for the same level touch
**Customization & Control**
- **Lookback Period**: Control how many days of historical sessions to display (1-30 days)
- **Timezone Flexibility**: Support for all major timezones (UTC-12 to UTC+12)
- **Session Toggle**: Individual on/off switches for each session display
- **Color Customization**: Full color control for all session lines and labels
- **Clean Interface**: Organized input groups for easy configuration
**Chart Behaviour**
- **Fixed Positioning**: Lines remain anchored to time positions when dragging or scrolling the chart
- **Professional Appearance**: Matches the behaviour of manually drawn horizontal lines
- **Performance Optimized**: Efficient rendering with proper line and label limits
- **Multi-Timeframe Support**: Works reliably across all chart timeframes
**Alert Configuration Options**
- **Script Alerts**: Use "Any alert() function call" for comprehensive notifications
- **Individual Conditions**: Separate alert conditions for granular control
- **Flexible Notifications**: Compatible with mobile app, email, and desktop alerts
- **Session-Specific Logic**: Alerts only trigger during NY session for relevant level interactions
This indicator is perfect for traders who focus on session-based analysis, ICT concepts, and multi-session support/resistance strategies. The combination of visual clarity, automated alerts, and professional chart behaviour makes it an essential tool for serious forex and index traders.

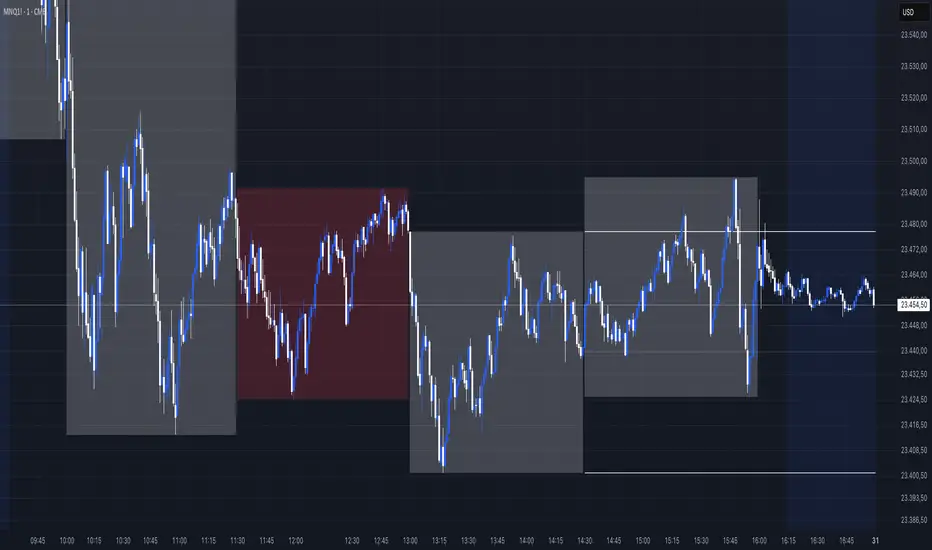
NY Time Cycles# New York Time Cycles Indicator
## Overview
The Time Cycles indicator is a specialized technical analysis tool designed to divide the trading day into distinct time blocks based on New York trading hours. Developed for TradingView, this indicator helps traders identify and analyze market behavior during specific time periods throughout the trading session. The indicator displays six consecutive time blocks, each representing 90-minute segments of the trading day, while tracking price ranges within each block.
## Core Concept
The Time Cycles indicator is built on the premise that different periods during the trading day often exhibit unique market characteristics and behaviors. By segmenting the trading day into standardized 90-minute blocks, traders can:
1. Identify recurring patterns at specific times of day
2. Compare price action across different time blocks
3. Recognize potential support and resistance levels based on the high and low of previous time blocks
4. Develop time-based trading strategies specific to certain market hours
## Time Block Structure
The indicator divides the trading day into six sequential 90-minute blocks based on New York time:
1. **Box 1**: 07:00 - 08:30 ET
2. **Box 2**: 08:30 - 10:00 ET
3. **Box 3**: 10:00 - 11:30 ET
4. **Box 4**: 11:30 - 13:00 ET
5. **Box 5**: 13:00 - 14:30 ET
6. **Box 6**: 14:30 - 16:00 ET
These time blocks cover the core US trading session from pre-market into regular market hours.
## Visual Representation
Each time block is represented on the chart as a visual box that:
- Spans the exact time period of the block (horizontally)
- Extends from the highest high to the lowest low recorded during that time period (vertically)
- Is displayed with customizable colors and transparency levels
- Automatically builds in real-time as price action develops
Additionally, the indicator draws dashed projection lines that:
- Display the high and low of the most recently completed time block
- Extend forward in time (for up to 24 hours)
- Help traders identify potential support and resistance levels
## Technical Implementation
The indicator employs several key technical features:
1. **Time Detection**: Accurately identifies the current New York time to place each box in the correct time period
2. **Dynamic Box Creation**: Initializes and updates boxes in real-time as price action develops
3. **Range Tracking**: Continuously monitors and adjusts the high and low of each active time block
4. **Projection Lines**: Creates horizontal dashed lines projecting the high and low of the most recently completed time block
5. **Daily Reset**: Automatically resets all boxes and lines at the start of each new trading day
6. **Customization**: Allows users to set custom colors and transparency levels for each time block
This Time Cycles indicator provides traders with a structured framework for analyzing intraday market movements based on specific time periods. By understanding how the market typically behaves during each 90-minute block, traders can develop more targeted strategies and potentially identify higher-probability trading opportunities throughout the trading day.
Market Session Boxes with Volume Delta [algo_aakash]This script highlights four key forex trading sessions — Tokyo, London, New York, and Sydney — by drawing color-coded boxes directly on the chart. For each session, it shows:
High and low of the session
Total volume traded
Volume delta (bullish vs bearish pressure)
Optional extension of session highs/lows into future candles
Cleanly labeled time range and stats
Users can:
Select which sessions to display
Customize session times (in UTC+0)
Choose colors per session
Toggle session labels and extension lines
Use Case: Designed to help intraday and short-term traders visualize market rhythm, liquidity zones, and session-based volatility. The volume delta metric adds an extra layer of sentiment analysis.
This tool works best on intraday timeframes like 15m, 30m, or 1H.
Disclaimer:
This indicator is for educational and visual analysis purposes. It does not constitute trading advice or guarantee results. Always conduct your own analysis before making trading decisions.

London/NY Sessions [jpkxyz]London/NY Sessions Indicator Guide
This indicator tracks the forex market's most active trading periods: London session, New York session, and their overlap.
This characteristics of the London and New York trading sessions are well documented and many traders use them as a key element in their trading strategies. It is most relevant in forex trading, however it is to an extend also applicable in cryptocurrencies.
London Session (08:00-16:00 UTC)
Most active trading session (35% of daily forex volume)
Highest trading volume and liquidity
Major price movements and trend development
Significant institutional participation
New York Session (13:00-20:00 UTC)
Second most active trading period
High institutional order flow
Major US economic releases
Significant impact on USD pairs
London/New York Overlap (13:00-16:00 UTC)
The most active period in forex markets:
Maximum market liquidity
Highest daily trading volume
Strong price movements
Tightest spreads
Peak institutional activity
This indicator helps traders:
Visualize key trading sessions
Track session highs and lows
Monitor overlap dynamics
Identify potential support/resistance levels (session highs/lows)

KillZones & Sessions [TradingFinder] Volume | Asia, London & NY🔵 Introduction
🟣 Session
The forex market operates 24 hours a day, 5 days a week, with only Saturdays and Sundays being off; traders often focus on one of the forex trading sessions instead of trying to trade in all markets 24 hours a day.
Trading sessions are time intervals during which a specific financial market is active and trades are conducted. The Asia, London, and New York sessions are the most important trading sessions throughout the 24-hour period, during which a significant amount of money and liquidity enters the market.
🟣 Kill Zone
Traders in financial markets profit from the difference between the price at which they buy or sell and the current market price. Traders have different time horizons for trading.
Among these, some traders engage in daily or even hourly trading and must operate during times when the market has desirable trading volumes and significant price movements.
Kill zones are segments of a session with higher trading volumes and price fluctuations compared to the rest of the session.
🔵 How to Use
🟣 Session Time
The "Asia Session" consists of two sessions: "Sydney" and "Tokyo." The beginning of this session, according to the "UTC" time zone, is at 23:00 and ends at 06:00. Similarly, the beginning of the "Asia KillZone," according to the "UTC" time zone, is at 23:00, and it ends at 03:55.
The "London Session" consists of two sessions: "Frankfurt" and "London." The beginning of this session, according to the "UTC" time zone, is at 07:00, and it ends at 14:25. Similarly, the beginning of the "London KillZone," according to the "UTC" time zone, is at 07:00, and it ends at 09:55.
The beginning of the "New York am" session, according to the "UTC" time zone, is at 14:30, and it ends at 19:25. Similarly, the beginning of the "New York am KillZone," according to the "UTC" time zone, is at 14:30, and it ends at 16:55.
The beginning of the "New York pm" session, according to the "UTC" time zone, is at 19:30, and it ends at 22:55. Similarly, the beginning of the "New York pm KillZone," according to the "UTC" time zone, is at 19:30, and it ends at 20:55.
Important : To prevent session overlap, the working hours of each session have slightly changed.
🔵 Features
🟣 Simultaneous Session and Kill Zone
With this indicator, you can simultaneously view the kill zone and session. High and low lines are used to indicate sessions, while filled areas with color represent kill zones. If you do not want to see kill zones, you can turn off the display settings.
🟣 Candle, Time, and Volume
Using the "More Info" feature, you can see the number of candles, elapsed time, and traded volume within the colored filled area.
🔵 Settings
•Show More Info: To display "More Info," you need to turn on this feature and turn it off whenever you don't need it.
• You can also customize these settings for each session separately :
o Display or hide session.
o Choose session color.
o Set session time range.
o Display or hide kill zone.
o Set kill zone time range.

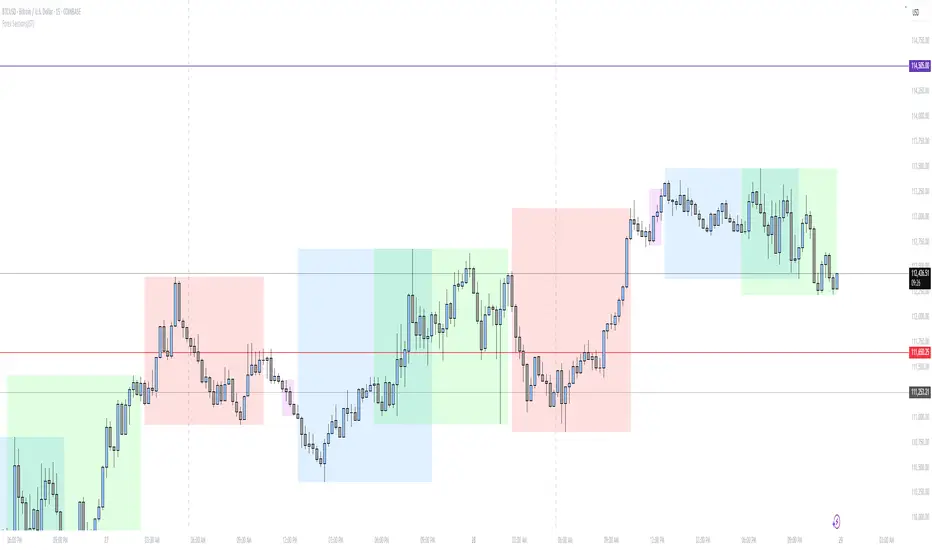
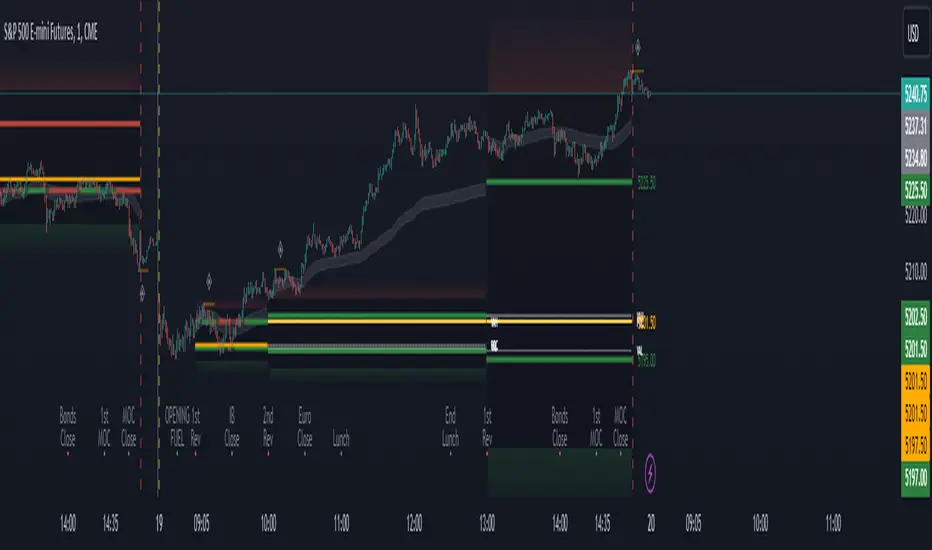
Period Value ZonesPeriod Value Zones is designed to help traders understand where current value is being found by splitting the day into 3 key periods based on common reversal times recognized for intraday trading.
By splitting the day into 3 periods, we can more efficiently determine where short-term value lies by using only the data we consider relevant during these periods of time.
> Overview
This indicator is recommended for low timeframe trading during the New York RTH Session.
By only trading within this session, we can ensure that volume and volatility remain fairly consistent.
Within each Period, you will find on the chart:
Value Area Points from Previous period (Value High(VAH)/Value Low(VAL)/Point of Control(POC))
Volume Weighted Average Price (VWAP) Cloud, based on High and Low values during the period.
Value Zone based Potential Reversal Zones.
Additional Displays:
Potential Reversal Detection Signals with Invalidation Levels
Forward Plotted Key Market times.
> Components
• Value Area Points
VAH/VAL/POC are important volume profile points which display where the market has previously held value.
We use these specific levels as support and resistance to confirm direction by monitoring interactions between price and these important levels.
The VAH and VAL lines change colors based on price's interaction with them to confirm whether that level should be regarded as support or resistance.
• VWAP Cloud
VWAP is a common metric used to determine the strength of a trend, and provides a point to look for re-bid & re-offer.
When price breaks out of our Fixed Value zone, VWAP helps us determine further direction.
Also included is VWAP deviation bands, for traders who would prefer to view the standard deviation away from this cloud as well.
• Value Reversal Zones
These Zones are calculated based on extensions of the Period Value Zone.
While in a balanced market, these zones have been shown to provide potential reversal opportunities.
• Potential Reversal Signals
These signals are based on an advanced method for confirming a higher-low or lower-high to reasonably create a signal that is not very laggy but also rooted in sound logic.
While helpful, These are NOT buy or sell signals, and you should always use further analysis to decide the next steps to take.
When a signal appears, an associated invalidation level is also displayed, if this level is crossed the associated signal is no longer considered relevant.
• Key Market Times
These are important times within the day that normally produce volatility caused by daily market catalysts.
Each key time is forward plotted 1 hour before it occurs to provide a clear heads up for potential opportunity.
Opening Fuel: Known for having an increase in Volume after the formation of the 15min Opening Range.
1st Reversal: Common Area for seeing initial large positioning effecting the market, often causing reversals.
Initial Balance Close: End of the first hour, a common positioning tool for futures traders.
2nd Reversal: Positioning is typically reactionary to IB Close, alongside Euro Traders Exiting Positions.
Euro Close: Close of Europe Session, a common positioning tool for futures traders.
Lunch: Usually Low Volume, traders are often out to lunch.
Lunch End: Volume tends to re-enter, as traders come back from lunch.
1st Reversal: New Hour, common area to see large position re-enter the market.
Bonds Close: Bonds markets close, Equities reacting to close of the bond market.
1st MOC: Initial Market on Close orders are places, market reaction is normally expected off of MOC positioning.
MOC Close: As MOC orders are reported, volatility is likely found within the market.
> Methodology
This indicator can be used with the same principles as trading balanced volume profiles.
Rule 1: Unless the price breaks and holds Value High or Value Low, we should expect buyers and sellers to maintain the current balance.
Rule 2: If we break and push away from the Period Value High, we should treat that level as supportive on retest unless we look back below and sellers defend on retest.
Rule 3: If we break and push away from the Period Value Low, we should treat that level as resistance on retest unless we look back above and buyers defend on retest.
Rule 4: If we recover Value Low, and it becomes supportive, we look for our Period POC and Period Value High as our targets above.
Rule 5: If we fail to hold Period Value High, and it becomes resistance, we look for our Period POC and Period Value Low as targets below.
Balance in the context of this indicator is considered as the area between Period Value High and Period Value Low
Acceptance outside of balance in the context of this indicator is considered as Period Value Low or High, becoming supportive or resistance.
> Examples
Theoretical Example:
In the bullish example below, price holds VWAP and makes POC supportive, showing interest from buyers pushing to Value High.
Real-World Example:
Below is an example of the same setup as the theoretical example, taking place on a real futures chart.
By utilizing these rules, we can look for opportunities at these levels and have a plan for how we should be interacting with them.
This will help us determine likely targets and risk-off levels that are based on volume and current "value" from participants.
Sessions Lite [TradingFinder] New York, London, Asia, NYSE Forex🔵 Introduction
A trading session is one of the basic concepts in the financial market that refers to specific time periods. In fact, a session means hours during the day and night, during which traders in a certain part of the world conduct their transactions.
Although the "Forex" and "CFDs" market is open 24 hours a day and it is possible to trade in it, but in some hours the activity in this market decreases so much that many traders prefer not to trade and only watch the market. On the other hand, there are specific times when the market is very busy and dynamic, and many traders tend to trade during these hours of the day and night.
Trading sessions are usually divided into three main categories, which are "Asian", "European" and "North American" sessions. These trading sessions are also called the "Tokyo", "London" and "New York" sessions, respectively. But they also categorized these sessions in more detailed ways such as "Sydney session", "Shanghai session" or "NYSE session".
🔵 Tokyo trading session (Asian session)
After the weekend that happens on Saturday and Sunday, the Forex market starts with the Asian session. In this continent, most of the transactions are done in the Tokyo session, and for this reason, it is usually called the Asian session or the Tokyo session. However, other countries such as Australia, China and Singapore also do a lot of trading in this session.
The Tokyo session has a lower volume of transactions compared to the London and New York sessions, and therefore the liquidity is lower. In this session, most of the Forex currency pairs move in a price range. For this reason, different people use the ups and downs with the trading strategy in the range and get profit.
The low liquidity of the Tokyo session means that trading spreads are also higher during these hours. Besides, most of the transactions of this session are done in the early hours and at the same time as the planned news release.
In the Tokyo or Asia session, the best currency pairs to trade are the "Japanese yen", the "Australian dollar", and the "New Zealand dollar".
"Nikkei" index is also a good option for trading. If you trade in the Tokyo session, you should also be aware of the release of economic news and data from Australian, New Zealand and Japanese financial institutions.
🔵 London trading session (European session)
After the Asian session, it is time for the European session. In this period of time, transactions are very large and many European markets are involved. However, the European session is usually known as the London session.
Because of its specific time zone, London is not only known as the Forex trading center in Europe, but it is also known as the Forex trading center in the world. The London session overlaps with two other major trading sessions in the world, Asia and America. This means that most of the Forex transactions are done in this session. According to the latest statistics, 32% of Forex transactions are related to the London session, which shows that about a third of the activity performed in Forex takes place during this period.
This will increase the volume of Forex transactions and increase liquidity. An event that causes the spread of transactions to decrease. Of course, high liquidity also leads to greater volatility, which is desirable for many traders.
In the European session, the pound and euro currencies and the "DAX", "FTSE100", and "CAC40" indices are known as the best tradable assets. Also, traders of this session should pay attention to the news and data published by the "European Central Bank" and the "Bank of England". The news of countries like Germany, France and Italy are also very important.
🔵 American trading session (New York session)
When the New York session begins, several hours have passed since the end of the Tokyo session, but the European session is in the middle. In this session, they usually affect the financial activities carried out in America, but they also affect other countries such as Canada, Mexico and several South American countries.
The "US dollar" and stock indices such as "S&P", "Dow Jones" and "Nasdaq" are the most important assets that are traded in this session.
The early hours of the American session have a lot of liquidity and volatility due to the overlap with the European session, but with the end of the European session, the activity in the American session also decreases.
You can trade all major Forex currency pairs in the New York trading session. In this session, the "Federal Reserve", as the most important central bank in the world, is the institution that you should pay attention to its news and data.
The trading session indicator is an analytical tool in the financial markets that is used to display and analyze specific trading periods during a day. These indicators are generally useful for determining support and resistance levels during any trading session and for detecting different trading patterns.
For example, usually these indicators display the open and close price levels, the highest and lowest prices during a trading session. Also, you may notice various price patterns such as price channels, price phase phases and market trend changes during different trading sessions using these indicators.
🔵 cause of construction
In particular, the session light indicator version is designed and built for those traders who use many different tools on their chart at the same time. These traders can include "Volume Traders", "ICT traders", "Day Traders" and... These individuals can use "Session Lite" without disturbing the display of their other trading tools such as "Order Blocks", "Liquidity", "Zigzag", "FVG" etc.
But in general, there are several reasons for making tools like trading session indicators in financial markets, some of which include the following :
1. Analysis of specific time frames : Some traders and investors like to consider specific time frames for price analysis and review. For example, analyzing price changes during each trading session can help analyze trading patterns and identify trading opportunities.
2. Recognize different price patterns : Different price patterns may be observed during trading sessions. Trading session indicators can help to make better trading decisions by analyzing these patterns and their strengths and weaknesses.
3. Identifying Support and Resistance Levels : These tools may help to identify support and resistance levels during any trading session which can be helpful in deciding whether to enter or exit the market.
🔵 How to use
The Session Lite indicator displays 8 sessions by default. Asia session, Sydney session, Tokyo session, Shanghai session, Europe session, London session, New York session and New York Stock Exchange (NYSE) session are the sessions that are displayed.
You can activate or deactivate the display of each session by using the tick button next to the name of each session.
Two gray vertical dashes are also displayed by default, which indicate the beginning of the European session and the New York session. This feature is available for all sessions, but it is enabled by default only for these two sessions, and you can activate it for the rest of the session. You can enable or disable the display of this line by using the Start Session tick key.
Likewise, the information table is displayed by default, which includes the open or closed information of each session and the start and end times of each session. These timings are based on the UTC time zone.
Accordingly, the schedule of trading sessions is as follows :
Asia session from 23:00 to 06:00
Sydney session from 23:00 to 05:00
Tokyo session from 00:00 to 00:06
Shanghai session from 01:30 to 06:57
European session from 07:00 to 16:30
London session from 08:00 to 16:30
New York session from 13:00 to 22:00
New York Stock Exchange (NYSE) session from 14:30 to T 22:00
Important note : the beginning of the European session coincides with the opening of the Frankfurt market.
🔵 Settings
• In the settings section, there are customization capabilities according to the type of use of each user. The settings related to showing or not showing the box of each session, the start indicator of each session, setting the start and end time of the session and choosing the desired color to display each session are among the things that can be set from this section.
• At the end of the settings, you will see the "Info Table" option; By disabling this option, the "sessions" clock table displayed on the upper right side will be disabled.

NY Open Breakout Strategy - High Liquidity & Favorable RRR Pine Description:
The NY Open Breakout Strategy is an advanced Pine Script indicator tailored for the TradingView platform. This strategy is specifically designed to exploit the high liquidity found during the New York session opening in the Forex market. Its primary goal is to provide traders with an opportunity to engage in positions with lower risk and higher potential profits, thereby ensuring an advantageous risk-to-reward ratio (RRR).
Core Objectives:
Leveraging High Liquidity: Capitalizes on the significant market movements at the New York session opening, known for its high liquidity, to identify strong breakout signals.
Achieving Favorable RRR: By setting strategic stop-loss and take-profit levels, the strategy aims for a higher RRR. This approach can lead to overall profitability, even if the win rate is lower than the loss rate.
Functionality:
Dynamic Breakout Identification: Uses the first 15-minute candle’s high and low after NY open as benchmarks for detecting potential breakouts.
Customizable Stop-Loss & Take-Profit: Provides options to configure stop-loss at the last swing or the previous candle’s close. The take-profit levels are determined based on a favorable risk-reward ratio.
Visual Session Indicators: Includes distinct background coloring and vertical lines to mark the New York session for easy visibility.
Methodology:
This strategy hinges on the premise that the opening of the New York session often triggers key price movements due to an influx of trading activity. By focusing on these moments, our indicator aims to capture strong trends and breakout patterns. The carefully calibrated stop-loss and take-profit settings ensure that each trade aims for a higher potential reward compared to the risk undertaken.
Unique Features:
Enhanced Risk Management: With adaptable risk-reward settings, traders can tailor their trading strategies to align with individual risk appetites.
Personalized User Experience: Offers a range of customizable settings for visual elements, allowing traders to adjust the look and feel of the indicator to their preferences.
Usage Guidelines:
Customize the indicator settings, including the stop-loss reference and risk-reward ratio, to match your trading style.
Watch for 'Buy Enter' and 'Sell Enter' signals during the New York session opening.
Utilize the displayed stop-loss and take-profit levels to effectively manage each trade.
This NY Open Breakout Strategy is ideal for traders who prioritize efficient risk management while aiming to capitalize on the high liquidity periods of the Forex market. The strategy is designed to be robust, providing a pathway to profitability even in scenarios where the number of losing trades surpasses winning ones, thanks to its emphasis on a high risk-to-reward ratio.

Forex Kill Zones - SMC IndicatorsWhat are Kill Zones?
Kill Zones are specific Time Windows of opportunity during the Session that have the potential for the highest volatility and where looking for trading opportunities is ideal.
The Forex Kill Zone Indicator is specifically designed for the Forex Market. What differentiates this script from other Kill Zones scripts is that this script is based on NY Midnight as the basis for the start of the day.
This is not the usual below-average Kill Zone indicator because this indicator does not only show the 3 main Kill Zones or Sessions, but it also offers extra Kill Zones that are called "Asian Range (AR)", "Central Bank Dealing Range (CBDR)", and "FLOUT".
Another key differentiator of this indicator's functionality is that it shows the highs and lows of each Kill zone allowing SMC traders to monitor Time-Based Liquidity above the highs and lows of each trading session.
Another added benefit of this indicator is the Standard Deviations features for the AR, CBDR, and FLOUT that we added. The Standard Deviations act as key levels where there is a high probability of price reacting when in confluence with 1H or higher key levels (PD Arrays). The Standard Deviations are not pivot levels but are ranges above and below the Kill Zones that rely on TIME and PRICE in their calculations.
Finally, we have also incorporated a Notification function to remind the trader of the start of the trading Kill Zones to not miss out on potential trade opportunities.
Key Functionalities
1) Universal Time Reference:
Every day starts at 00:00 NY Midnight, irrespective of the trader's local time, Instead of the Standard GMT Midnight. This allows all Kill Zones to be in line with the New York start of the day at Midnight, as thought by ICT.
Weekend Highlighter
This feature highlights time from Sunday Market Open at 5 PM NY Time to 00:00 NY Midnight.
It's useful for identifying the non-trading or the low volatility periods when trading should be avoided.
Features Breakdown
Lookback Period
Defaulted to 60 trading days, aligning with “IPDA Data Ranges”, which is ideal for backtesting.
Adjustable for trading, and it's recommended to keep it at 20 trading days to focus on most recent data only.
24-hour Daily Intervals
The 24-hour intervals are not the same as the usual daily candle. Instead, the start of each trading day is anchored to the 00:00 NY Midnight.
Highlights "Days of the Week" labels, "Weekend" Trading Time, and the daily high-low ranges based on the start of trading day mark being at 00:00 NY Midnight.
London Kill Zone (Green)
Starts from 01:00 NY Time to 05:00 NY Time.
London closes at 12:00 NY Time.
Highlight the high and low of the London Kill Zone to Identify Time-Based Liquidity above and below the London Kill Zone Range.
Marks the London Close Session to mark the end of London End of the trading day, where volatility drops.
Highlights the time when there is the highest volatility during the London Session Kill Zone.
New York Kill Zone (Blue)
Starts from 07:00 NY time to 10:00 NY Time.
Marks The CME Open at 08:30 (the opening of the Bond Market).
Highlight the high and low of the New York Kill Zone to Identify Time-Based Liquidity above and below the NY Kill Zone Range.
Highlights the time when there is the highest volatility during the New York Session.
The Central Bank Dealing Range or "CBDR" (Orange)
Starts From 14:00 NY Time to 20:00 NY Time.
Highlight the high and low of the CBDR Kill Zone to Identify Time-Based Liquidity above and below the CBDR Kill Zone Range.
Also, there is an added ability to add the CBDR Standard Deviations above and below the CBDR.
Can also extend the CBDR Standard Deviations key levels until the end of the next day's London Kill Zone.
What are the CBDR Standard Deviations?
The Standard Deviations are extensions of the CBDR above and below the CBDR original range. It takes the high and low of the range and adds the range above and below the original range by x times.
The CCBDR Standard Deviations are NOT pivot levels. They are used as points of reference where we could expect the price to react when in confluence with higher timeframe reference points.
The idea behind them is that if the price is Bearish, the price could rally to +1 CBDR Standard Deviation below dropping lower. As shown in the image below on Thursday, the two vertical lines before the start of Thursday mark the CBDR Kill Zone, then the price rallied to +1 CBDR SDv and then dropped.
Asian Range "AR" Kill Zone
Starts from 20:00 NY Time to 00:00 NY Time.
Highlight the high and low of the AR Kill Zone to Identify Time-Based Liquidity above and below the AR Kill Zone Range.
Also, there is an added ability to add the AR Standard Deviations above and below the AR.
This KillZone should be primarily used when CBDR exceeds 40 pips.
Similar to the CBDR, the AR Standard Deviations also can be used as points of reference where we could expect the price to react when in confluence with higher timeframe reference points.
The AR Standard Deviations can also be extended until the end of the next day's London Kill Zone.
FLOUT Range
It Combines AR and CBDR, spanning from 14:00 NY Time to 00:00 NY Time.
The FLOUT should only be used when both AR and CBDR have small ranges of less than 10 pips combined.
Highlight the high and low of the FLOUT Kill Zone to Identify Time-Based Liquidity above and below the FLOUT Kill Zone Range.
The FLOUT Standard Deviations also can be used as points of reference where we could expect the price to react when in confluence with higher timeframe reference points.
The Flout Standard Deviations can be extended until the end of the next day London Kill Zone.
Bonus Features
Daily & Weekly Open Price Levels
The Open Price levels draw a horizontal line from the start of the trading day at 00:00 NY midnight, and it extends it towards the end of the trading day.
This is useful for understanding where the price is relative to the daily candle.
When Bullish, the trader should look for setups at or below the daily or weekly open price.
When Bearish, the trader should look for setups at or above the daily or weekly open price.
Whether to choose the Daily or Weekly open price depends on the trader's trading style. If the trader is day trading or scaling, then it's more appropriate to choose the Daily Open Price.
However, Day Traders can also use the Weekly candle to align with the Weekly Candle's expected range direction.
On the other hand, if the trader is a Swing Trader and wants to capitalise on the weekly candle's trend, then it's more appropriate to choose the Weekly Open Price.
However, Swing Traders can also use the Daily Open Price when looking to take a trade to time better entries with a high risk-to-reward ratio.
Notifications
The trader can also receive alerts as a reminder at the start of the desired session to not miss out on the start of the trading session.

Sessions [TradingFinder] New York, London, Tokyo & Sydney ForexTiming is one of the influential factors in a trader's position. This indicator categorizes transactions into three sessions (Asia, Europe, and America). Five significant trading cities (New York, London, Frankfurt, Tokyo, and Sydney) are selectable.
I recommend using the tool on a 5-minute time frame, but it is usable on all time frames.
Settings:
• Trading sessions: Display or hide each trading session as needed.
• Color: Change the color of each box.
• Session time intervals: The default is based on the main working hours for each time interval and can be adjusted.
• Information table: Delete or display additional information table.
Information Table:
• Trading sessions
• Opening and closing times of each trading session
How to Use:
Initiating trading sessions involves entering with increased liquidity, and the market usually experiences significant movements. Many trading strategies are based on "time" and "session openings." This tool empowers traders to focus intensely on each time interval.
These trading sessions are crucial for all Forex, stock, and index traders:
The total price ceiling and floor in the Asia session (Tokyo and Sydney) are crucial for traders in the European session.
The European session starts with Frankfurt, and an hour later, London begins, collectively forming the European session.
The dashboard provides additional information, displaying hours based on UTC.
Customization options are considered in all sections so that everyone can apply their own settings.
Important: Default times are the most accurate for each region, and in most indicators, this time is not correctly selected. Therefore, the level of influence and time intervals are specified at the beginning of each session. If you are using another indicator, match its default time to the announced time and share the results with me in the comments.

Main Market Opener Breakout [RH]Based on my observations while analyzing the crypto and forex charts, particularly BTCUSDT and EURUSD, I have noticed that the prices exhibit significant movements during most stock market sessions, particularly during New York main market session.
With the aim of capturing these moves, I embarked on extensive research. Through this research, I discovered that by considering the very first "15m" or "30m" candle of the main market trading session and marking that first candle's high and low points, we can create potential trigger points.
A break above the high point indicates a bullish signal, while a break below the low point suggests a bearish signal. To further refine our analysis and filter out some noise, we can incorporate the Average True Range (ATR) value of that candle.
Candle time is very important here. We will mark the candle when the actual trading begins in New York stock exchange. The trading hours for the New York Stock Exchange (NYSE) typically begin at 9:30 AM and end at 4:00 PM Eastern Time (ET), Monday through Friday. This is known as the "NYSE Regular Trading Session." However, it's important to note that there are also pre-market and after-hours trading sessions that occur outside of these core hours. We will not consider these pre and after-hours.
Example:
First break-above and break-below is marked automatically and alerts are also available for first breaks.
Example:
I have also added the option to add the, London Stock Exchange Main Market and Tokyo Stock Exchange Regular Trading Session. You can add those sessions also and test with different symbols.
Stocks symbols from different stock exchanges just mark the very first candle of the day(main market trading session).
Alerts are available.

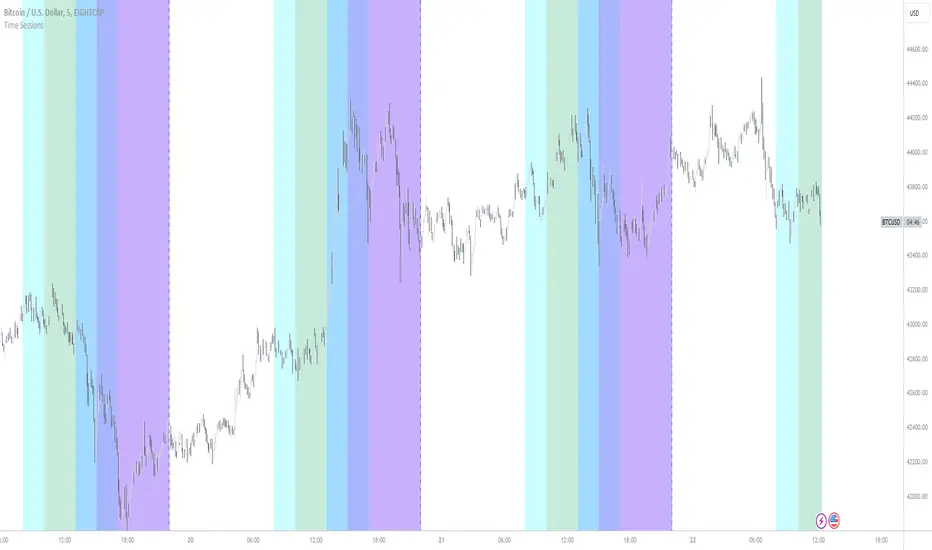
New York, London and custom trading sessionsHi Traders
The script :
The Time sessions script plots the trading sessions of both New York and London markets (background fills), In addition to the above the script also plots a user defined trading session period (vertical lines). All plots may be toggled true or false inorder to ensure you can focus on the respective market / markets / custom session.
Market sessions are useful for technical or quantitative analysis, as the majority of trading activity and net daily volume occurs in these zones, in fact the U.S./London market overlap tends to have the greatest volume accumulation across that range of time / bars than that range at any other time within the daily session. For FX traders it may also be important to take into account for many currency pairs the average exchange rate pip movement is greatest within these zones.
The custom session, is intended to be used for traders who trade only within specific intervals within the market session or day for 24/7 traded asset classes
Additional notes :
Not as of now, I have only added three optional trading sessions. If you would like to change the sessions, copy the scripts code and change the "ctm_session" default time range value, insuring the second time value is 1 min > than the first.
As always i Hope this is a useful script, and I will be updating this script in the near future.