checkm8's ADX & DMI v2 with MTF Godmode CrossoversHello & welcome to my updated version of the ADX & DMI indicator.
The average directional index and directional moving indices are a godsend and I think you should incorporate it into your trading.
Here's a quick how-to:
A detailed guide is available in my first version:
Additional edits:
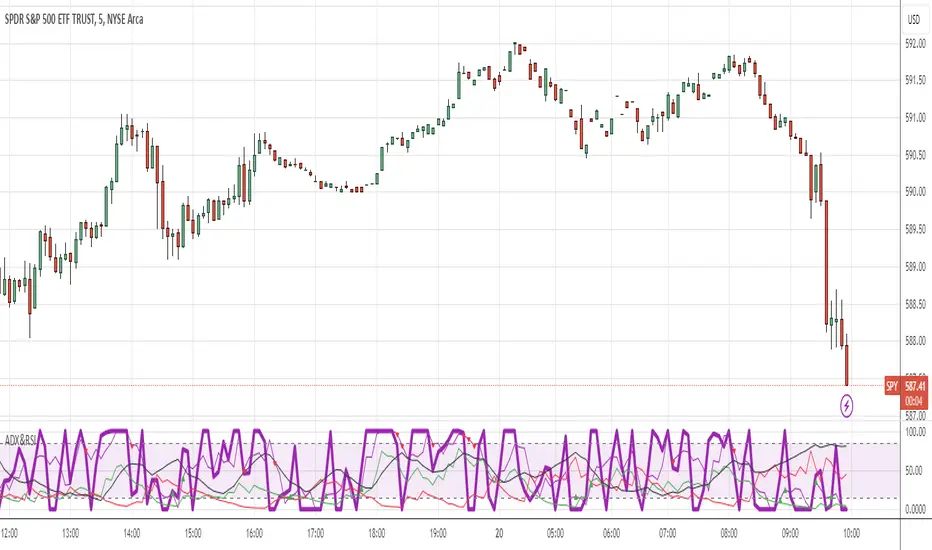
My indicator paints the background of the indicator green when +DMI is above -DMI and red when -DMI is above +DMI. In addition to this, the background will paint darker green when the RSI on the timeframe exceeds 70 and even darker when the RSI exceeds 80, in a +DMI dominance. The background will paint darker red when the RSI on the timeframe falls below 30 and even darker when the RSI falls below 20, in a -DMI dominance.
The indicator also displays multi-timeframe (MTF) crossovers on Godmode MACDs, plotted on the ADX line. If the dots are teal, it means that the shorter-term MA crossed above the longer-term MA (bullish), and if it is fuchsia, the shorter-term MA crossed below the longer-term MA (bearish).
Additional notes:
Additional edits:
1) Speculating on DMI crossovers is dangerous, especially on larger timeframes. Be careful when doing so if you are not familiar with the calculations behind the DMIs and if you are not familiar with how movements on lower timeframes translate to larger timeframes.
Additional resources to learn about ADX & DMI:
1) seekingalpha.com
2) stockcharts.com
Special thanks:
-xSilas, for the development of the Godmode calculations used in my indicator
-dent77x, for being a thinkpool and emotional support
-kristarling, for help with the coding
ADX

ADX + DMI v.checkm8Hello & welcome to my custom version of the ADX & DMI indicator.
The average directional index and directional moving indices are a godsend and I think you should incorporate it into your trading.
Here's a quick how-to:
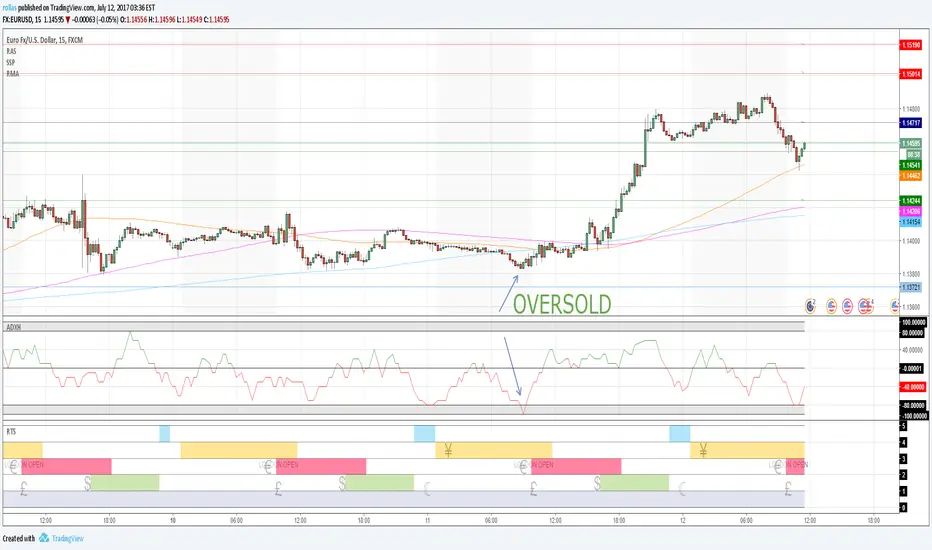
The ADX , despite its name, is a directional index but only represents the strength of the dominant trend, which is marked by the DMIs ( +DMI and -DMI ). To interpret this, a rising ADX signifies that the dominant trend is gaining strength or momentum, while a falling ADX represents the weakening of the dominant trend. My indicator paints the ADX black if it is rising (trend gaining strength) and white if it is falling (trend losing strength). The ADX also has a critical level of 20, which signifies whether or not a trend actually exists. For example, if the ADX is above 20, there is a trend in effect, but if it is below 20 - there is no definite trend in play, even if the price may be rising or falling. On my indicator, the ADX turns grey when it is below 20 to signify the irrelevance of the dominant trend at such points. To better explain this, it does not matter which DMI dominates when the ADX is below 20, as it can be interpreted as a very weak move.
There are two DMIs, represented by +DMI (blue), which represents bullish momentum, and -DMI (red), which represent bearish momentum. If the +DMI dominates the -DMI , a bullish trend is most likely at play, and if the -DMI dominates the +DMI , a bearish trend most likely prevails. The ADX must be considered in this, as a +DMI dominance over -DMI when ADX is below 20 could be interpreted as "chop", with no clear directional signals, while the same dominance on a rising ADX will represent a strong momentum in favor of the dominant DMI.
The aim of the indicator is to identify trend reversals and give signals to newly developing trends. Crossovers are a key element, as they dictate which DMI dominates the playing field.
Additional notes:
1) The strongest possible position you can have is one where the DMIs have a crossover on an ADX that is perking or sloping upwards.
2) You should be exiting your positions at the peak of the ADX , shown by the color changes, as this is often the furthest extent of the dominant trend. Once the ADX tips, the trend weakens and is less likely to see continuation. NOTE: Divergences are possible, where the ADX may be falling, but the dominant trend sees continuation. This simply means that the dominant trend is weakening, but still going.
3) The indicator has green and red bars to show which trend dominates. If the +DMI is above -DMI , the area until the next crossover will be green, while a -DMI dominance over +DMI will show a red area until the crossover.
4) If you have any questions, feel free to reach out and ask me!

RSI BULL BEAR + ADXlong-signal when crossig the lower threshold
short-signal when crossing the upper threshold
Bryan - Multi Indicator v2Developed as a professional service and published for customer acceptance/verification.
Notes
Ichimoku and ADX combined strategy.
Strategy logic ported to the indicator to allow automation through 3rd party services. (Position management, orders etc)
Long and exit long alert conditions created
Zero-Lag Average Directional Index with DI+ and DI-This average directional index follows the Nyquist Sampling Criterion making showing even better behaviour in high volatility environments than the Ehlers & Ric's "Zero Lag Moving Average".
Applies the same formulae as the moving average at Zero-lag Dürschner Moving Average
From the paper abstract: "The well-known Moving Averages (MA), namely the Simple Moving Average ( SMA ), the Exponential Moving Average ( EMA ) and the Weighted Moving Average ( WMA ), are modified in this paper with the help of the Nyquist Criterion. These modified Moving Averages 3.0 show good smoothing characteristics, illustrate relevant trends and trend reversals in price series without a time lag as far as calculated. With regard to smoothing, trend patterns and time lag bring about a significant improvement on conventional SMA (Moving Averages 1.0: SMA, EMA and WMA ). In addition to this, the efficiency of the Moving Averages 3.0 is demonstrated by applying several tests and a simple trading system."
The Dürschner Moving Average was published at the IFTA 2012 (International Federation of Technical Analysts) Journal, page 27.

Bryan - Multi IndicatorCustom Indicator - Developed for a Backtest-Rookies customer and published for testing and acceptance.
Ichimoku + ADX combined indicator with custom entry criteria and plotting for buy signals.

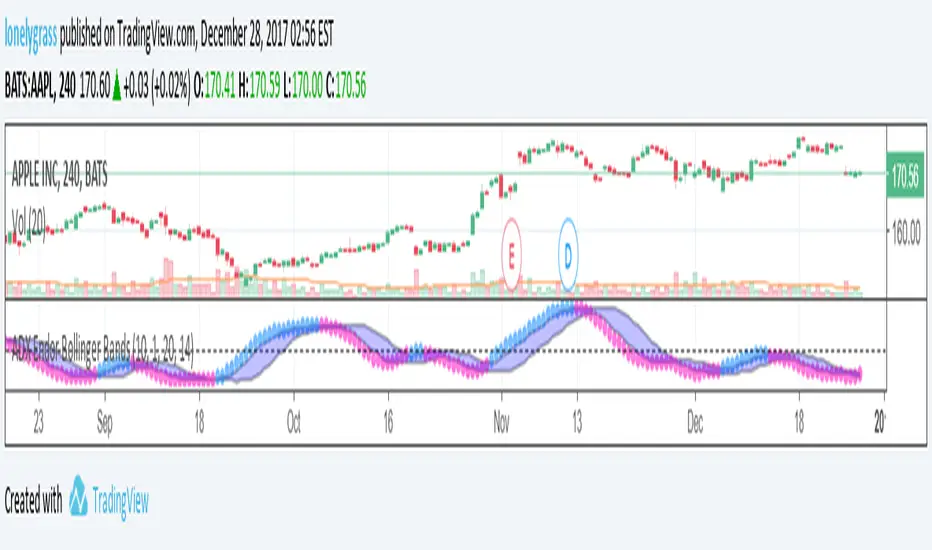
ADX Endor Bollinger BandsThis is a modified version of ADX , and it has a bollinger bands endorsed. An advantage of the indicator is allowing users to capture short term rise or drop of trend strength, particularly useful for scalping.
There are three modes open to users: ADX, DIPlus and DIMinus. Users can simply choose the indicators in their favor. A breach of the upper bollinger band will be in blue, breaching lower band or inside-the-bands signals are painted in pink.
Hope you will enjoy it. Make sure to follow my trading journal and give a thumb up to this post.
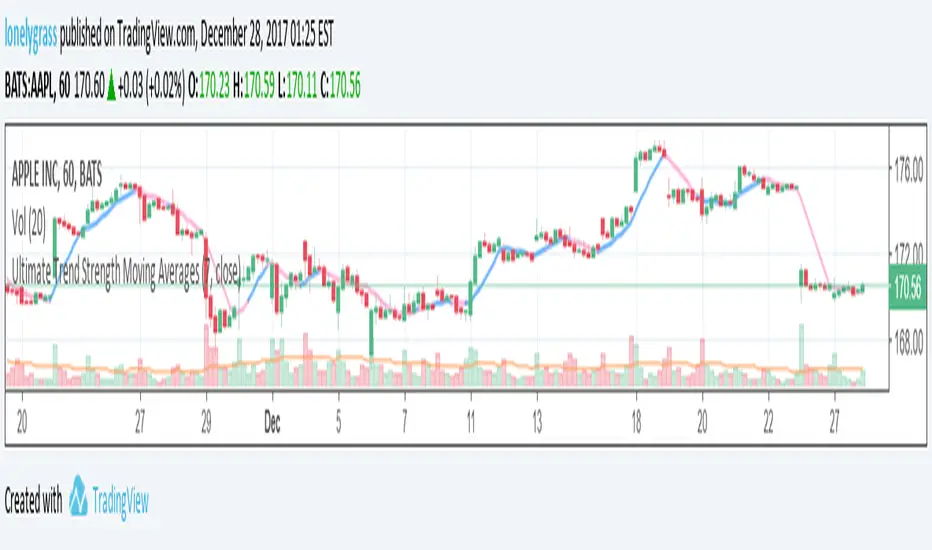
Ultimate Trend Strength Moving AveragesHi , this is lonelygrass. Since the day I joined Tradingview, I decided to challenge myself and to code at least one indicator every single day. Keep grinding, stay focused and everything will pay off.
It is called "Ultimate Trend Strength Moving Averages" .
I have taken several factors to write this moving average indicator, adx ,bar location (above/below the moving average), open v close, to name a few.
It is meant to let users know the current market trend in a timely order. I can say that this will be one of the most practical indicators for intraday, swing and other kinds of trading.
Users can select the sort of moving average they would like to use, such as SMA, EMA, WMA and VWMA, and just change the time span you want to look at! Blue color signalizes an uptrend while pink color signalizes a downtrend. Let's utilize it to its fullest.
Happy trading! Stay tuned!
DepthHouse - ATR BandsDepthHouse ATR Bands works very similar to the well-known Bollinger Bands.
However, these bands are calculated slightly different.
Instead of using the standard deviation formula, ATR Bands determines the size of the bands based on the average range.
How to use:
The bands tighten while the markets’ range becomes lower, and widens as its' range becomes broader. Giving the indicator a loaded spring effect.
A break outside of the bands in either direction usually indicates a breakout.
All 3 bands serve as possible support and/or resistance. Meaning breaks back into the bands could indicate a reversal, or end of the breakout.
This indicator is completely customizable, so compiling multiple sized bands on top of each other may create a strong competitive edge.
This indicator is free until January,1st 2018 – see how to get below
--
DepthHouse's ATR Bands is 1 of 3 indicators that will be available for purchase via subscription come Jan 2018.
This indicator package will come with the following 3 indicators:
:: MaxADX ::
::Premium oscillator to help spot forming trends and reversals.
:: MaxADX Signals ::
::Taking MaxADX a step farther by creating an overlay that show possible trend strengthening and reversals via bar colors and shapes.
:: ATRBands ::
::Like Bollinger Bands , this indicator is uses to help spot breakouts, and overbought/sold areas.
--
How to get:
To qualify for the trial period which ends January, 1st 2018, please go to the link on my profile and click subscribe!
You will then be sent directions for your account to be added to the whitelist.
If you have already subscribed to one of my previous indicators, you will be added to the list shortly
Likes and comments are so very much appreciated!

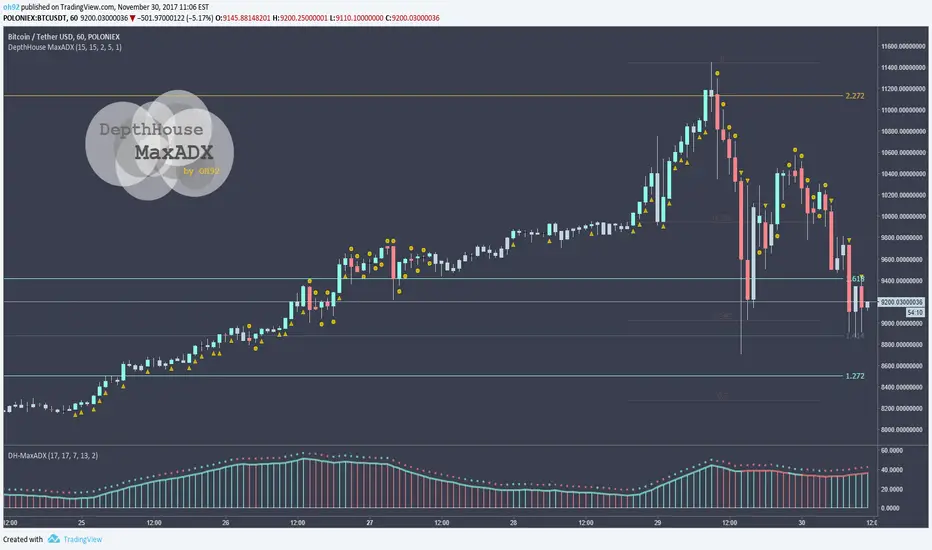
DepthHouse - MaxADX LayoverThis indicator takes our MaxADX a step further by giving possible trend change signals.
MaxADX combines directional information and smoothed moving averages to help traders indicate trend reversals and strengthening trends. As you can see in the chart above this indicator makes it very easy to spot trend reversals in trending markets.
How to use MaxADX Oscillator:
The top circles represent the immediate trend. Used as very early indication of trend changes and/or reversals
The solid line just below that represents the general trend direction. Green meaning up white red meaning down.
The histogram below that represents the general trend strength. A change in that indicate a reversal or a breakout in either direction.
The MaxADX Layover:
The layover then calculates three variables above, and determines the possible direction with symbols and/or bar colors which can easily be turned on or off.
Where this indicator falls short unfortunately, is its use in ranging markets.
Which leaves this as a great indicator for all beginners and professionals who prefer to trade in volatile markets such as cryptocurrencies.
This indicator will be free until January,1st 2018 – see how to get below
--
DepthHouse's MaxADX is 1 of 3 indicators that will be available for purchase via subscription come Jan 2018.
This indicator package will come with the following 3 indicators:
:: MaxADX ::
:: Premium oscillator to help spot forming trends and reversals.
:: MaxADX Signals ::
:: Taking MaxADX a step farther by creating an overlay that show possible trend strengthening and reversals via bar colors and shapes.
:: ATRBands ::
:: Like Bollinger Bands , this indicator is uses to help spot breakouts, and overbought/sold areas.
--
How to get:
To qualify for the trial period which ends January, 1st 2018, please go to the link in my bio and click subscribe!
You will then be sent directions for your account to be added to the whitelist.
If you have already subscribed, you will be added to the list shortly.
DMI strategykr.tradingview.com
Time of purchase : After the triangle under the Candle, Buy it if cross Just before the high on the day. and Consider the down trend and Whether the color of the candle is green and lime.
DMI+ADX를 이용한 전략입니다. +DI가 -DI를 상향돌파하면 캔들 아래 삼각형이 생기며 봉 캔들이 그린이면 +DI > -DI 일때이며 진정한 상승은 ADX도 20보다 클때인 형광색 캔들일때 입니다.
매수시점은 당일 즉 블루라인 범위내에서 고점을 캔들아래 삼각형 생기고 캔들색이 그린이나 형광색일때 돌파하면 매수입니다. 그리고 하향추세선이 위에있으면 참고하셔야합니다. 올라갈 공간이 있는지 확인해야합니다.

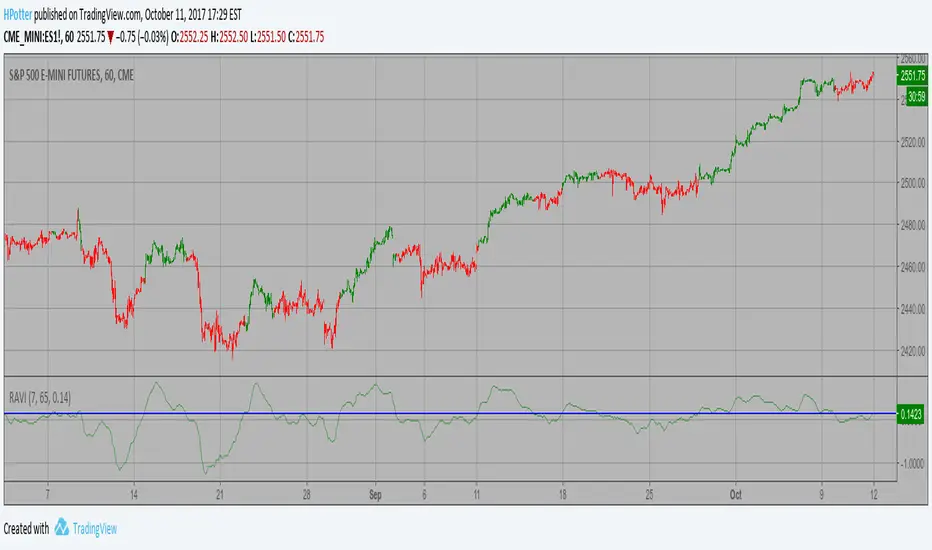
Range Action Verification Index (RAVI) Strategy The indicator represents the relative convergence/divergence of the moving
averages of the financial asset, increased a hundred times. It is based on
a different principle than the ADX. Chande suggests a 13-week SMA as the
basis for the indicator. It represents the quarterly (3 months = 65 working days)
sentiments of the market participants concerning prices. The short moving average
comprises 10% of the one and is rounded to seven.
WARNING:
- This script to change bars colors.
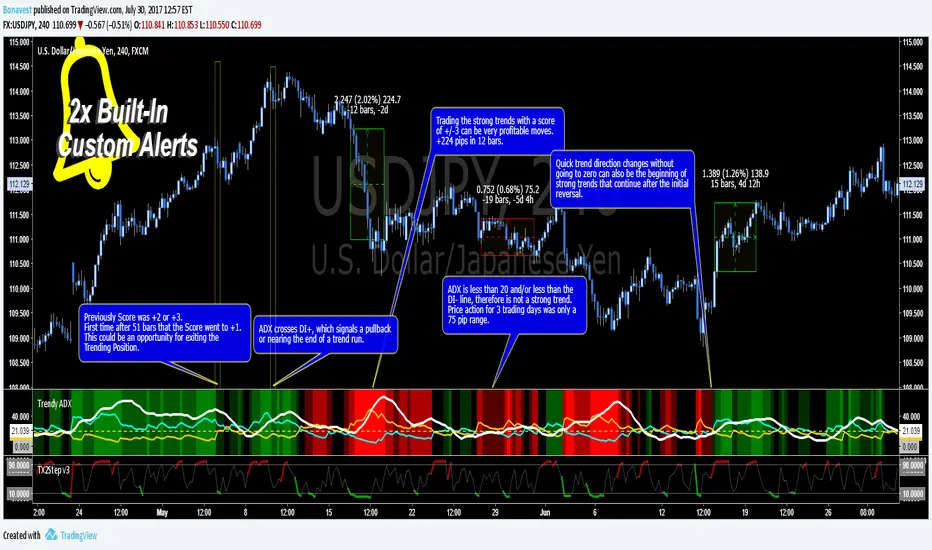
Trendy ADX DI+ DI- Trend Strength - BonavestTo add this indicator to your charts:
Click the 'Add to Favorite Scripts' button down below this description.
Trendy ADX is a lower indicator that is used to determine strength of trends. The DI+ and DI- lines cross one another depending on the trend direction based on the Length input with the current trend, DI line, being on top or higher.
The ADX line shows the strength of the current trend, with a value over 20 being a trend with growing strength. Trends with ADX less than 20 are said to not be strong enough to be traded as well as if the ADX is less than both the DI+ and DI- even though it is higher than 20.
An added number value that is not a part of the typical ADX/DI indicator is the 'Score'. This is a value that ranges from -3 to +3 including 0. This score allows you to set alerts based on Score and be alerted when a certain level is reached. The Score values are fully configureable in the Input Settings screen.
The Length setting is the only important adjustment for the indicator itself. The 3 suggested values to use are 7, 11 and 20 (default 11).
The Threshold setting is purely for visual adjustment of the yellow dashed line (default 20).
I use this indicator for:
Keeps me in a trade longer to capture long trends
Determining if the current trend has more room to continue
Filter out reversal buy/sell signals if trend is just beginning
My observations in using this indicator is to ignore reversal signals if the ADX line has not crossed above the DI+ or DI- line of the current trend (red/green background). I also expect a small pullback or sideways price action when the ADX line does cross the current trending DI line.
There are 2 Built-In Notifications already created for you and are available by simply right clicking in the indicator area and selecting:
Condition: Trendy ADX
Then 1 of the 2 Alerts:
Trend Direction Change - Score crosses 0 changing to 1 (green/UP) or -1 (red/DOWN)
Trend Strength Change - Score changes in any direction by a value of 1
How to Trade the Average Directinal Index Video: youtu.be
This adaptation was based off of the original code from @MasaNakamura.
ADX and RSI ComboThis indicator combines two separate Simple RSI indicators so you can show different periods together, as well as an ADX indicator with DI+ and DI-. I prefer to use one indicator to show the whole thing, instead of stacking the individual indicators.
[naoligo] Simple ADXI'm publishing this indicator just for study purposes, because the result is exactly the same as DMI without the smoothing factor. It is exactly the same as ADX Wilder from MT5.
I was looking for the algorithm all over and it was a pain to find the right formula, meaning: one that would match with the built-in ones. After several study and comparison, I still didn't find the algorithm that match with the MT5's built-in simple ADX ...
Enjoy!

HYPER ADXADX typically shows the strength of a trend. Hyper ADX is specially coded for showing intraday overbought and oversold conditions.

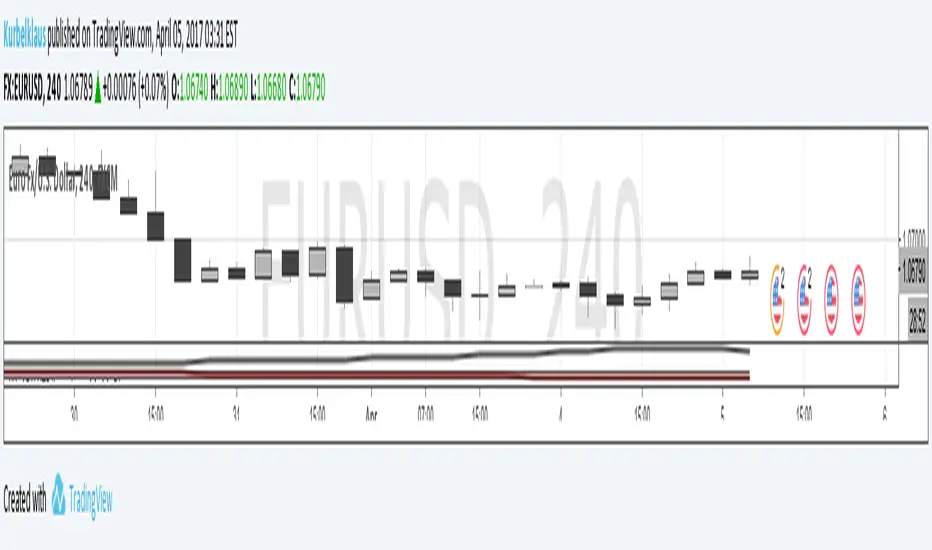
KK_Average Directional Index (ADX) Higher TFHey guys,
sometimes you just want to plot an Indicator value from a higher Timeframe on your Chart. For most Indicators this is pretty straightforward however there is one Indicator that has been giving me quite a headache while trying to do this: The Average Directional Index . Anyway after going through almost 200 versions of this script I finally found a solution that works and thought I would share this with you, since I'm sure some of you have encountered the same problem.
How it works
Go to your desired Instrument/Timeframe and add the Script
Under Settings in the field for "Higher ADX TF" put the Timeframe-code you want to pull the ADX Values from.
- Codes: Monthly - M, Weekly W, Daily - D
- Codes Intraday: The amount of hours in minutes, e.g. if you want to pull values from the 4h-Chart the code is 240 (60 for 1h, 15 for 15m ...)
In some cases (see below) the calculation might not be correct. So make sure the values are correct:
a) Write down the latest ADX of the higher TF while you are on the lower TF
b) Switch the Resolution to the higher TF
c) Compare the value you have just written down to the next to last value. They should be the same.
d) Switch back the Resolution to the lower TF and you're good to go.
Limitations
You can only pull values from higher Timeframes, e.g. you're on a 4h Chart, so you can only pull values from the Daily, Weekly and Monthly Chart. You can't pull values from the 1h Chart.
You can only pull values from Timeframes, where the higher Timeframe Close always has a corresponding Close on the lower Timeframe, e.g. you can't pull values from the 3h Chart when you are on a 2h Chart. This should be pretty rare.
The Script needs a certain amount of Data from the Higher TF before the calculated values are correct. I have tested this on several Instruments and the Script usually needs approximately 100 Bars on the higher Timeframe (often less) for the values to be correct (error < 1%).
So when the difference between your lower Timeframe and you higher Timeframe is large, e.g. you want to pull the Daily ADX value on a 15m-Chart, the calculation can be wrong. This can lead to errors in 2 Cases:
a) Backtesting: When you go over old data and get close to the last available Bar the Data will be wrong. This will limit the amount of data you can backtest.
b) Live values: When the difference between the two Timeframes is too large, it is possible that even live values are wrong, e.g. this will be the case when you are trying to pull the Daily ADX value on a 5 minute Chart. Always check if the calculation works with your desired combination of Timeframes before using it (see above).
I hope this is useful for you and whish all of you successful trading!
Best regards
Kurbelklaus
Directional Trend Index (DTI) Strategy This technique was described by William Blau in his book "Momentum,
Direction and Divergence" (1995). His book focuses on three key aspects
of trading: momentum, direction and divergence. Blau, who was an electrical
engineer before becoming a trader, thoroughly examines the relationship between
price and momentum in step-by-step examples. From this grounding, he then looks
at the deficiencies in other oscillators and introduces some innovative techniques,
including a fresh twist on Stochastics. On directional issues, he analyzes the
intricacies of ADX and offers a unique approach to help define trending and
non-trending periods.
Directional Trend Index is an indicator similar to DM+ developed by Welles Wilder.
The DM+ (a part of Directional Movement System which includes both DM+ and
DM- indicators) indicator helps determine if a security is "trending." William
Blau added to it a zeroline, relative to which the indicator is deemed positive or
negative. A stable uptrend is a period when the DTI value is positive and rising, a
downtrend when it is negative and falling.
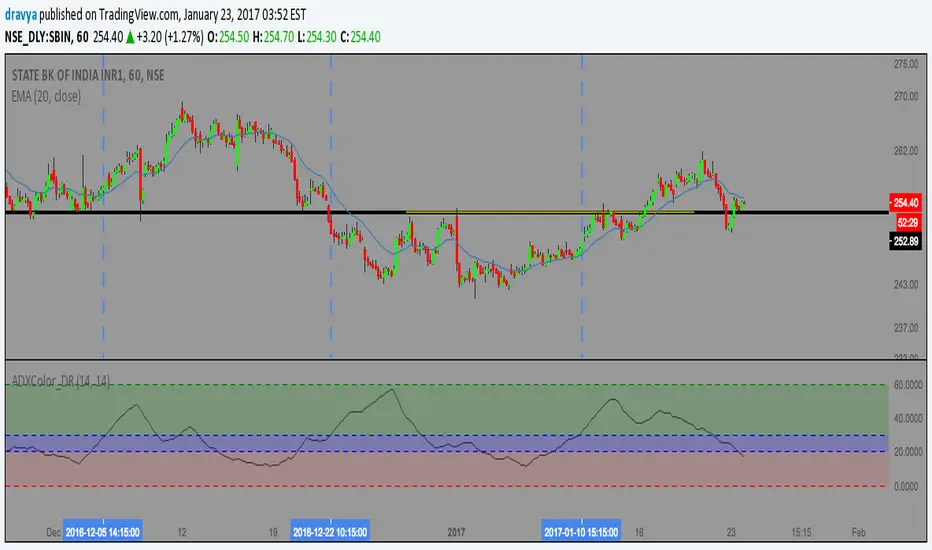
ADX Color Easy [Dravya]Script #1
So,
here is my first script.
This is the normal 14 period ADX,
but with a color twist, to make it extremely easy on eyes.
and then,
easily spot the strength.
ADX, as you know, shows the strength of the trend.
As short term traders, we need price movement and a strong trend.
How to use this script ?
1. We don't trade when ADX is in the red zone (0-20)
2. We get ready for trading when it enters the blue zone (20-30)
3. We trade when the ADX enters the green zone (>30)
Simple, right !
Now, in the green zone,
in which direction you should trade?
Here are a few links, to help you use ADX as a strategy ,
www.tradingsetupsreview.com
www.babypips.com
Other than this, you can combine this with your own strategies.
Personally, I like to use it on stocks on 1H timeframe.
Thanks.
Would love to hear from you.
Please like it to support the project,
and help spread it.
HYPER ADX V5Fixed rendering problen at progressing bars for ultra low time frames. Added alert options for cross types.