Dane - MA StudyThis strategy has been developed as a development service. It is published for customer acceptance and verification. As such, I am unable to provide access to anyone other than the paying customer. Sorry about that.
For those interested in development services, please check out the backtest-rookies (.com) website.
MA Study
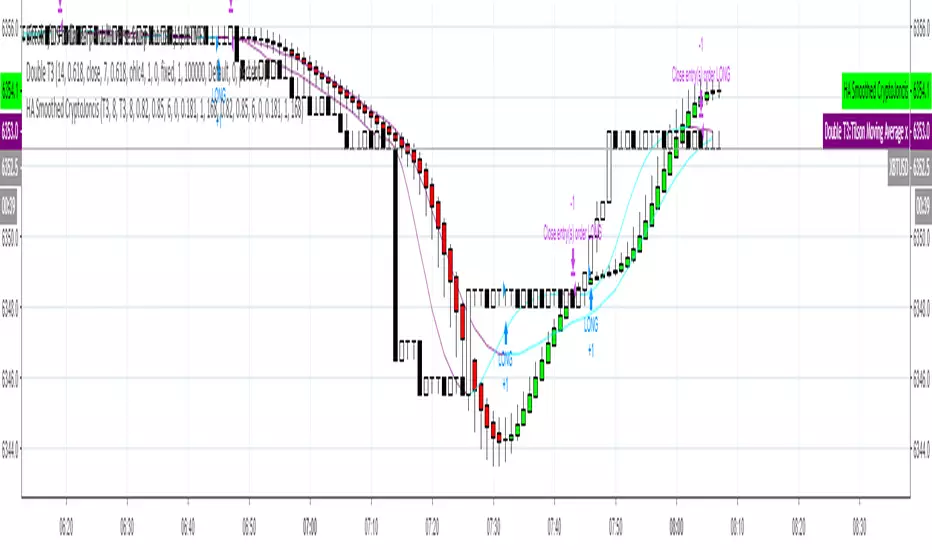
This is a study version of the Dane - MA Strategy with few extra features:
Position Simulation - So we can synchronise with the strategy.
Alerts for Going Long, Short and exiting positions
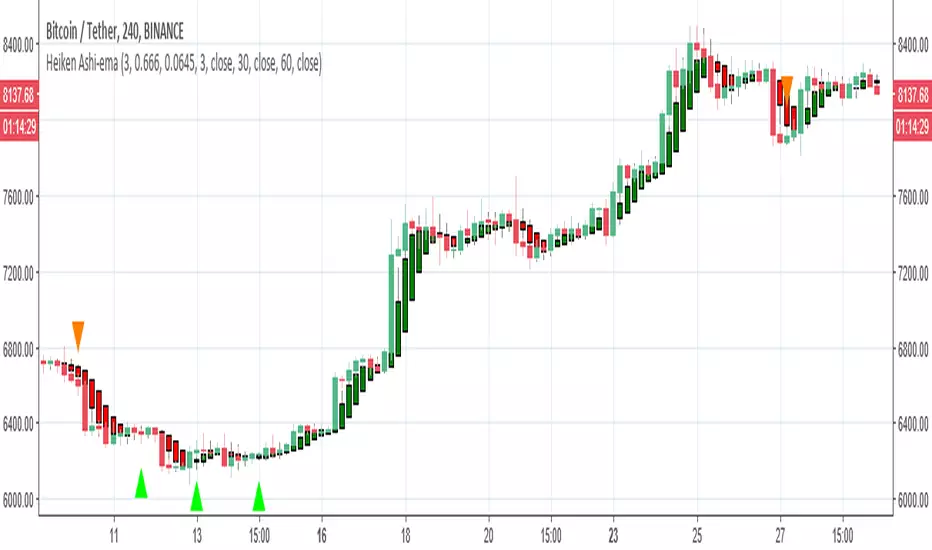
Plotting entry/exit and close markers
Plotting dots at the bottom of the chart to show whether we are in a simulated long, short or flat state.
Ashi

Heikin-Ashi Smoothed with option to change MA types CryptoJoncisPine Script version=3
Author CryptoJoncis
Heikin-Ashi Smoothed
The Heikin-Ashi Smoothed study is based upon the standard Heikin-Ashi study with additional moving average calculations. The following is the calculation formula for the bars:
1. The current bar Open, High, Low, Close values are smoothed individually by using the moving average type specified by the Moving Average Type 1 Input with a length/period specified by the Moving Average Period 1 Input.
2. The Heikin-Ashi bar Open, High, Low, Close values are set using the smoothed values from step 1. This is performed using the standard Heikin-Ashi formula.
3. The final Heikin-Ashi Open, High, Low, Close values are calculated by doing a second smoothing of the bar values from step 2 by using the moving average type specified by the Moving Average Type 2 Input with a length/period specified by the Moving Average Period 2 Input.
If you choose to tick the box where it offers to use only one smoothed HA then it skips the third/final step and you do not need to choose the second MA type for it to work.
Remember, using FRAMA, always make sure you use even number for length.
For simple Heikin-Ashi, please tick single smoothed and DEFAULT (Not smoothed as there are no MA used)
Heikin-Ashi bars are calculated:
1. Close = (Open + High + Low + Close) / 4
This is the average price of the current bar.
2. Open = (Open of Previous Bar + Close of Previous Bar) / 2
This is the midpoint of the previous bar.
3. High = Max of (High, Open, Close)
Highest value of the three.
4. Low = Min of (Low, Open, Close)
Lowest value of the three.
Any questions/suggestions/errors or spelling mistakes? Please leave a comment and let me know. I will try to fix it.
This took me few days to finish, so I hope you will find it useful.
Would you like to have more MA type choices? Please comment down with any other which aren't included in this indicator and I will research them and add.
MA included in this script:
Tillson Moving Average (T3)
Double Exponential Moving Average (DEMA)
Arnaud Legoux Moving Average (ALMA)
Least Squares Moving Average (LSMA)
Simple Moving Average (SMA)
Exponential Moving Average (EMA)
Weighted Moving Average (WMA)
Smoothed Moving Average (SMMA)
Triple Exponential Moving Average (TEMA)
Hull Moving Average (HMA)
Adaptive moving average (AMA)
Fractal Adaptive Moving Average (FAMA)
Variable Index Dynamic Average (VIDYA)
Triangular Moving Average (TRIMA)
You can use,publish,modify this code in any way as you wish, but only if you reference me after.
You are not allowed to sell it as it is.
If this code is useful to you, then consider to buy me a coffee (or better a pint of beer) by donating Bitcoin or Etherium to:
BTC: 3FiBnveHo3YW6DSiPEmoCFCyCnsrWS3JBR
ETH: 0xac290B4A721f5ef75b0971F1102e01E1942A4578
References:
www.sierrachart.com
www.investopedia.com
www.binarytribune.com
www.investopedia.com
www.stockfetcher.com
www.mql5.com
www.incrediblecharts.com
help.cqg.com
www.blastchart.com
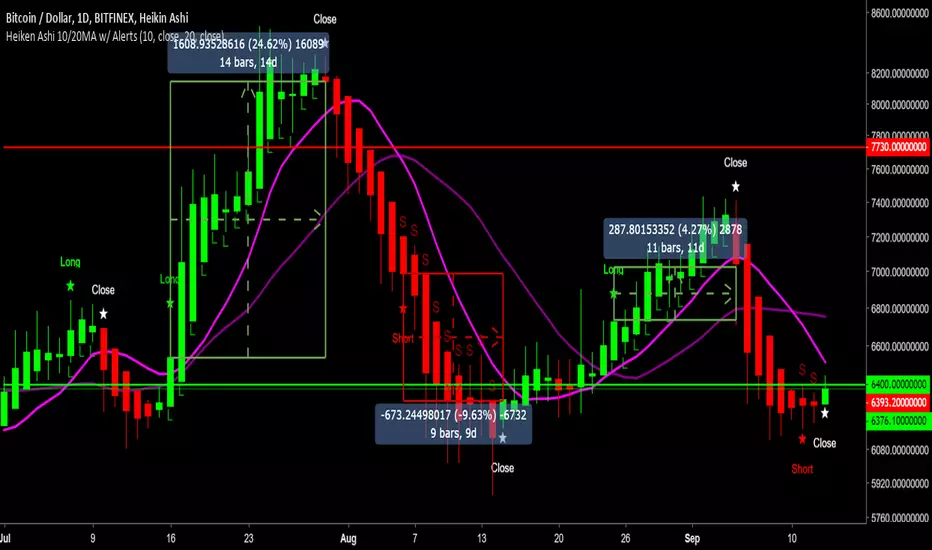
Heiken Ashi 10/20MA w/ Alerts v2.0Summary:
Using Heiken Ashi candles and default 10 and 20 Moving Averages for crossover signals to determine signals to go long, short and close trades.
How it works:
- Is the 10MA above the 20MA and a bullish candle? If yes, open a long.
- Will close the trade at the first bearish candle.
- Reverse this for going short.
- If you can't short, just close your long and hold till the next long signal.
Quite a conservative strategy, not for day trading. Comes into it's own in trending markets as long as you stick to the signals.
Alert messages:
- Long
- Short
- Close
Backtesting results:
XBTUSD = 85.9% (Bitmex)
LTCUSD = 75.6% (Bitfinex)
ETHUSD = 73.8% (Bitfinex)
NEOBTC = 83.9% (Binance)
TRXBTC = 79.4% (Binance)
EOSBTC = 88.1% (Binance)
Will need to be able to short altcoins to make the most of it, or at least will at least keep you out of sustained downtrends (=/= holding).
Backtest it on bitcoin and other large cap alts on high time frames to see for yourself. For lazy trading, can set up alerts with AutoView.
0.1ETH for lifetime access. Message for details and support.
Check out my other scripts.
Heiken Ashi 10/20MA w/ AlertsHeiken Ashi 10/20MA script with alerts.
General premise:
- Is the 10MA above the 20MA and a bullish candle? If yes, open a long.
- Will close the trade at the first bearish candle.
- Reverse it for going short.
Quite a conservative strategy, not for day trading.
Alerts:
- Long
- Short
- Close
Will need to be able to short altcoins to make the most of it, but will at least keep you out of sustained downtrends.
Backtest it on bitcoin and other large cap alts on high time frames. For lazy trading, can set up alerts with AutoView.
Check out my other scripts.

Kozlod - Heikin-Ashi Bar Color Change AlertsYou can use this script to setup alerts on Heikin-Ashi bar color change.
You have to apply this script to usual candles and not Heikin-Ashi!!!
Background color indicates HA bar color. On change you'll see green/red arrows and alert will be fired.
Also you can find in the code calculations of all HA OHLC values.

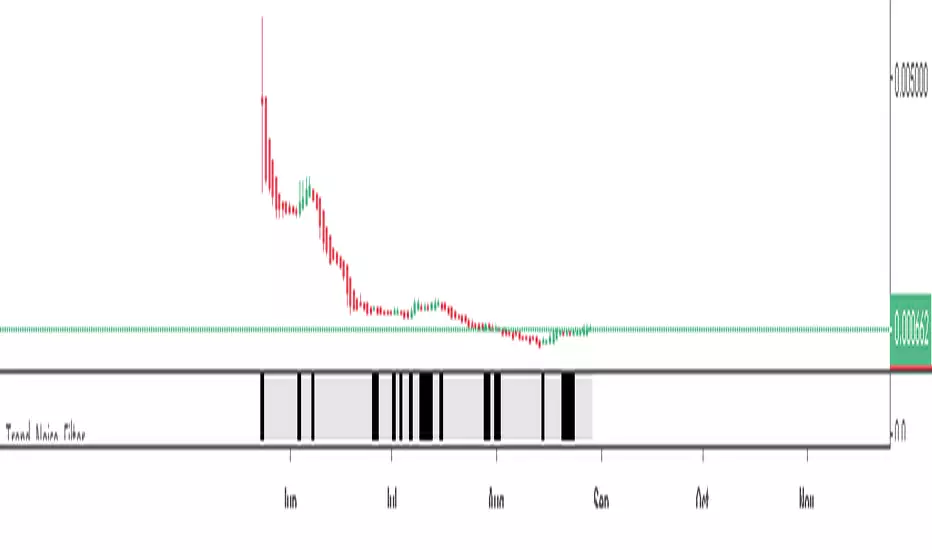
Trend_Noise_FilterA yes is when a candle closes the same colour as the preceding candle. A no is when it flips. Black bars on indicator signal a flip. Running count maintained in top left of indicator. Gives count from 01/01/2010 until present day.
Note: Hover over the latest bar to display the count up until today's date.
HA_Counter_V2A yes is when a red/green candle closes the same colour as the preceding candle. A no is when it flips.
HA_CounterScript to count the number of green and red Heikin-Ashi candles in a user specified date range.
{CDT} v1.0 - Opal Signal ALERTSAlert version of my 87.5% profitable Opal Signal Strategy for 1 Day chart which can be found here:
----------------------------------------------
Highly profitable script, decent on all timeframes but designed specifically for XBTUSD with Heiken candles on 1D timeframe.
No repaint.
7 day free trials available on request.
----------------------------------------------
*Use at your own risk & DYOR.

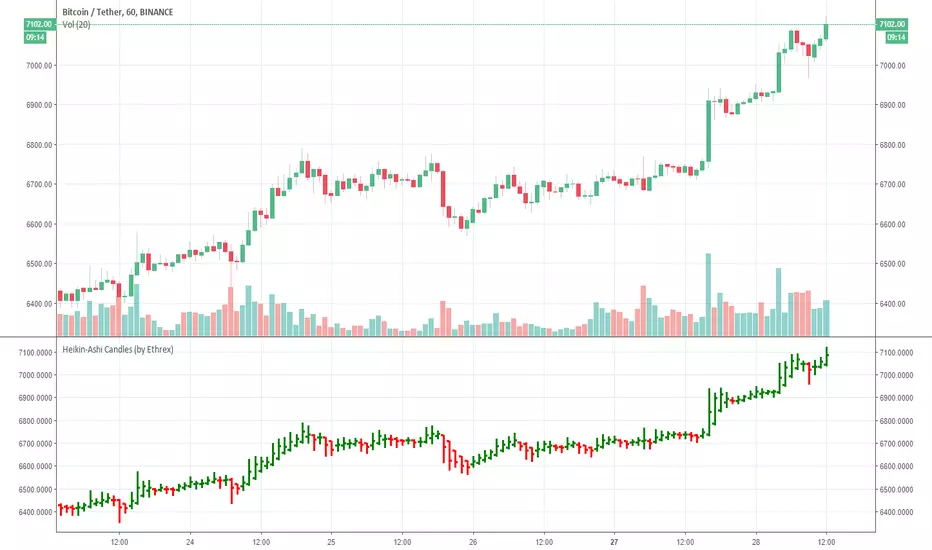
Heikin-Ashi Candles (by Ethrex)Allows to see how Heikin-Ashi candles are computed and see the bars side-by-side with normal prices.
linear-heikenThis model is based on two things
1. Heiken-Kaufman model made by marco (seen in red green arrow)
2. the colour coding is linear regression (green-up period) and (yellow-down period)
alerts inside

heiken-stochThis model has two system
1. is the well known heiken (lime or red)
2. stoch cross up or down in relation to volume indicator (B or S)
alerts inside
have fun

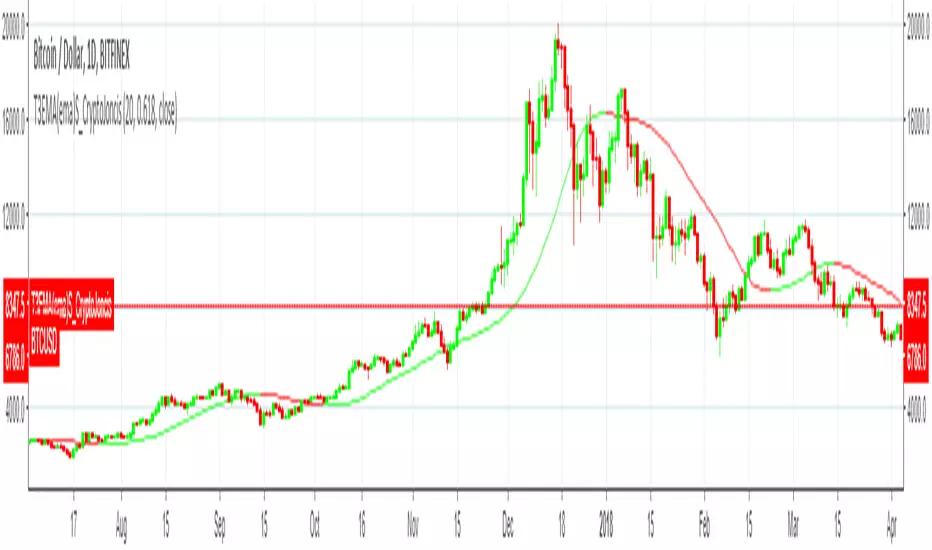
Tillson Moving Average(ema) singleT3 Moving Average indicator was originally developed by Tim Tillson in 1998/99.
T3 Moving Average is considered as improved and better to traditional moving averages as it is smoother and performs better in trending market conditions.
It offers multiple opportunities when the price is in the state of retracement and therefore allows to minimize your exposed risk and allowing your profits run.
This version provides simple T3 MA
Source options - all standard + HA
T3 based on 6x ema
Only adds 1 T3 MA on chart
Consider a tip in ETH to
0xac290B4A721f5ef75b0971F1102e01E1942A4578
Thank you and have a nice day
CryptoJoncis
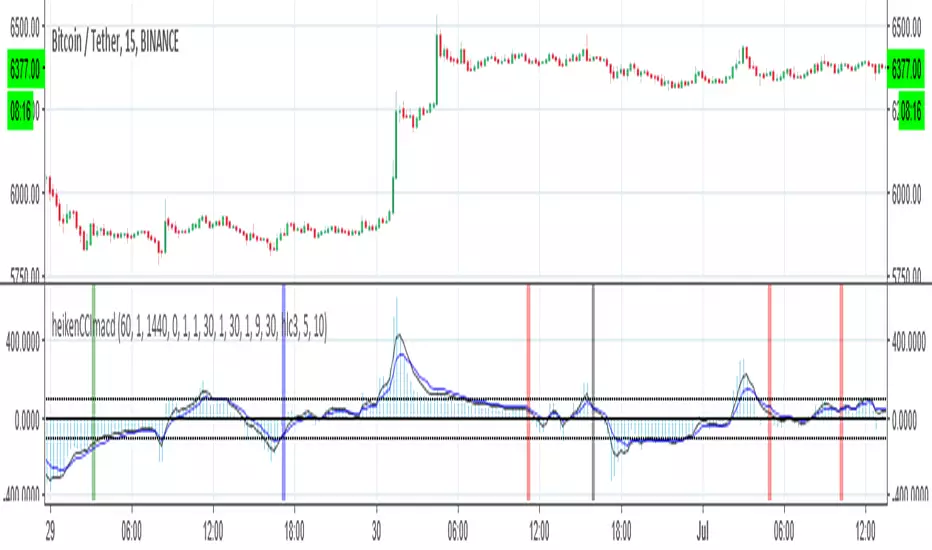
heikenCCImacdI just made new exit point and buy point to older version with some tweek
two buy system 1. based on heiken strategy with filtering by CCI (green red =long short) i little change the old exit point
the other 2. based on cross of CCI in constriction of macd (blue black =long1 shor1)
alerts included
so one can decide on what he like also it possible to combine between them :)
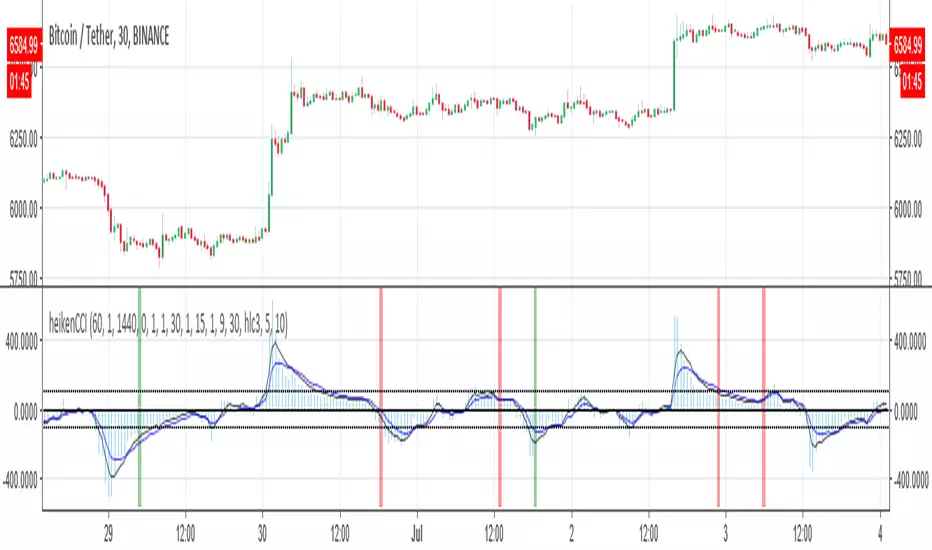
heikenCCIthe aim is to make winning strategy better. the buy point based on heiken strategy with more 80% winning rate and to filter the wrong buy points with CCI buy points
alerts inside
Heikin Ashi Historical TF Developmental BarsAn improvement to the built-in security(heikinashi()...) method, this indicator plots Heikin Ashi (HA) candles for an input timeframe (TF) on an underlying regular candlestick chart of a shorter TF. The improvement is that it plots the value of each in-development HA bar as it would have appeared while still repainting, for each underlying chart bar. The last chart bar of each TF matches the value available from security() calls and from HA charts directly.
For best results, be sure to use a HA TF greater than chart TF (I prefer 1 minute unless longer history is required).
1 hour HA on 1 minute underlying price chart
4 hour HA on 1 minute underlying price chart
V3: Release.

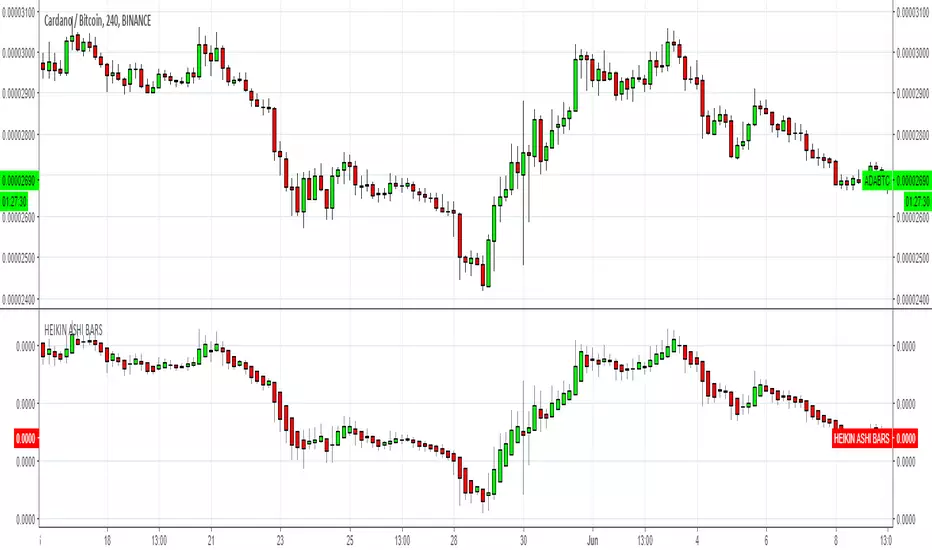
HEIKIN ASHI BARSSimple Heikin Ashi candlebars
Please consider a tip if you find this useful
BTC: 3FiBnveHo3YW6DSiPEmoCFCyCnsrWS3JBR
ETH: 0xac290B4A721f5ef75b0971F1102e01E1942A4578
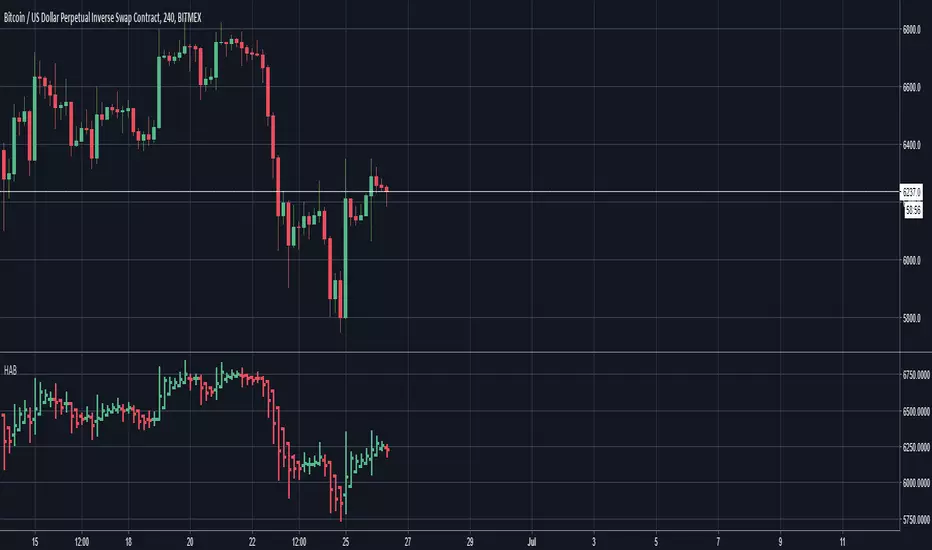
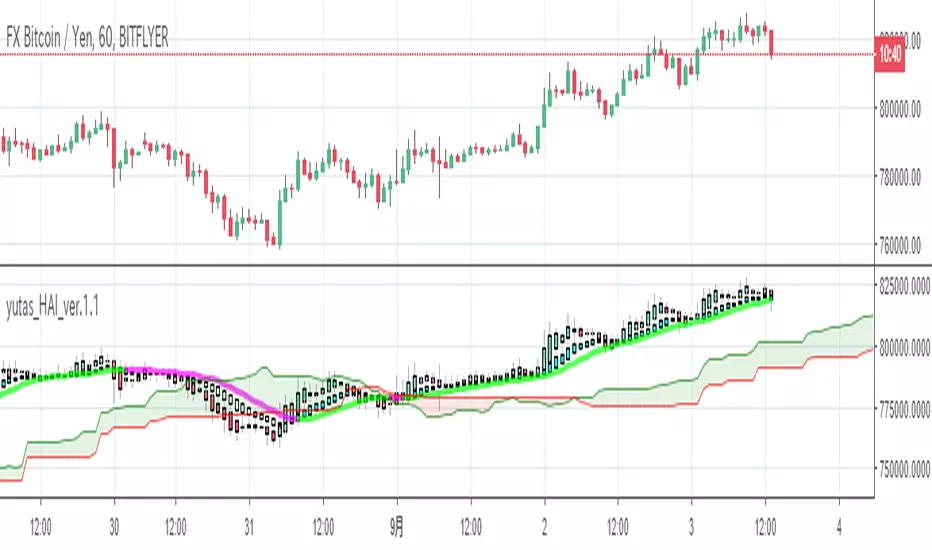
Heikin-Ashi VWMA Smoothed Trend Ribbon with Custom time framesThis is a Heikin - Ashi Smoothed Trend Ribbon.
I'm using the VWMA for its smoothing calculation.
The Ribbon is based on the open and close of the Heikin - Ashi candles and doesn't show the wicks.
I have also allowed the viewing of different time frames to the current chart layout.
If you have any comments and feedback please comment below.
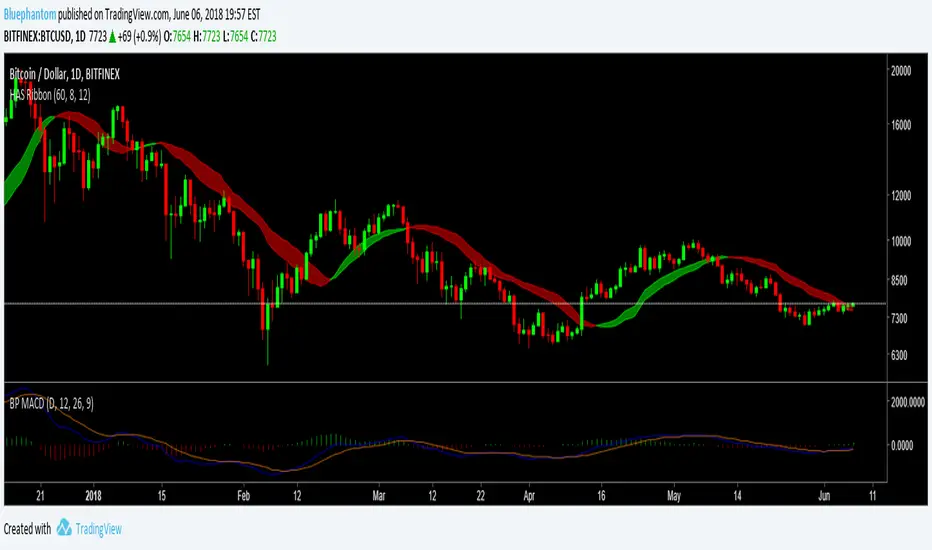
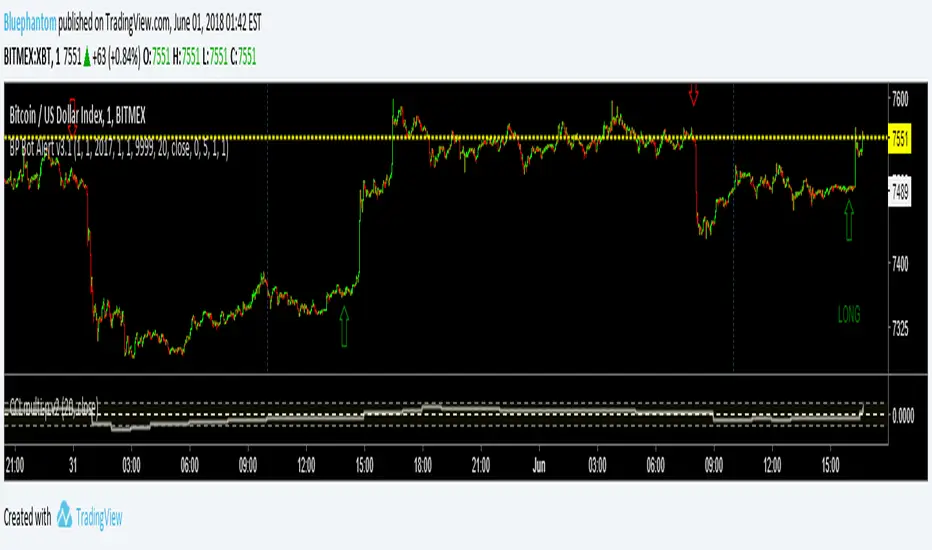
Autoview Bot Alert v3.1 By BluephantomThis Alert Script is invite only. To be considered you must contact me through the Autoview Discord group.
It uses an EMA smoothed Heikin-Ashi and an average CCI based on multi time frames.
mcbw_RSI_candlesAn RSI can have any input, but most commonly used is the closing price. I thought it would be interesting to see if feeding the open high low and close information into the RSI to make RSI candles, if there are candlestick formations that can be recognized or possible patters in wicks.
To make it smoother there also is the option to turn the RSI candles into Heiken Ashi form, just check the box labeled HA. The result is an RSI that is easier on the eyes.
Happy trading!
Remember to not take everything too seriously
