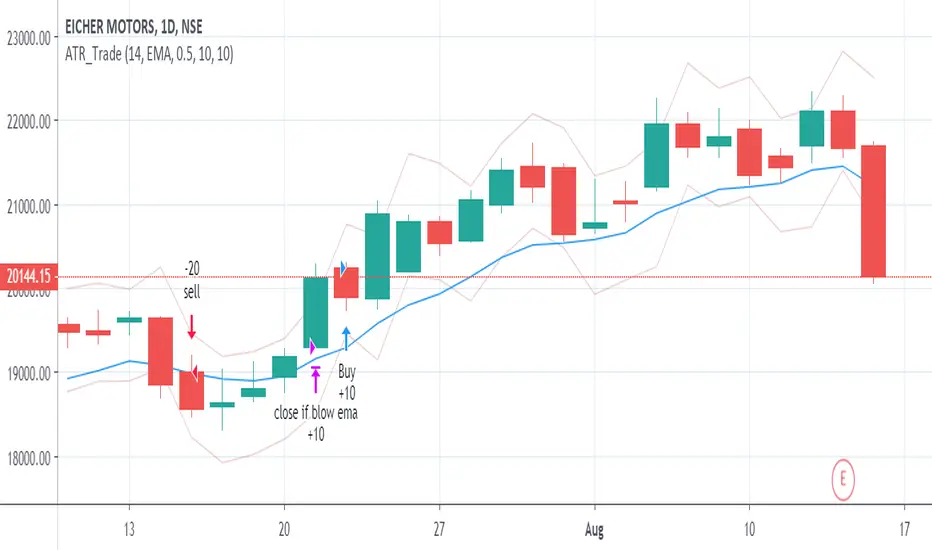
ATR_Trade_strategyATR Based Strategy
Identify the ATR range on Daily Chart.
ATR HIGH= Previous Close +ATR
ATR Low =Previous Close - ATR
Long when Close is above ATR High
Short when Close is below ATR Low
Exit when close moves below EMA(10) OR
a user-selected max loss
טווח ממוצע אמיתי (ATR)
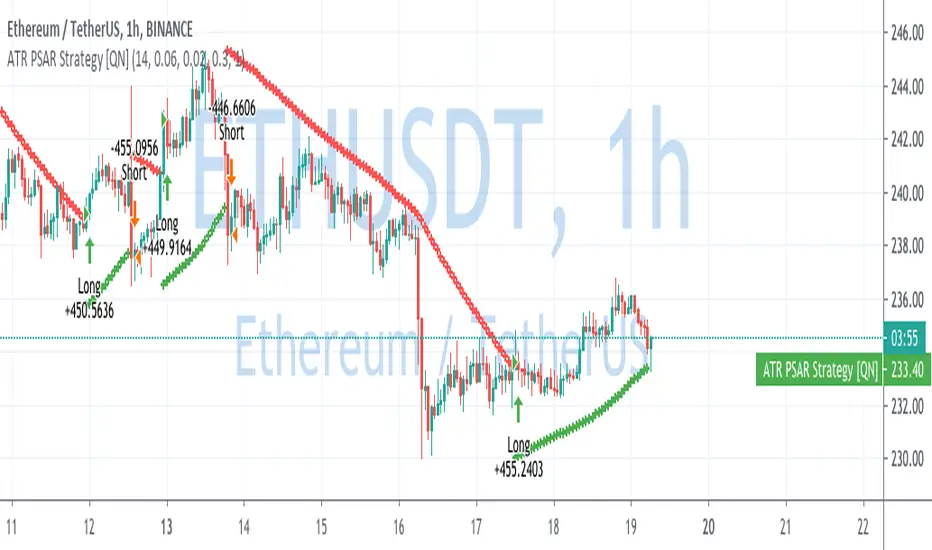
ATR Parabolic SAR Strategy [QuantNomad]I created a version of Parabolic SAR when I accelerate it not based on the difference from the extreme point but based on current ATR. So the idea is that for a more volatile market it should move faster.
Performance is calculated based on 25% equity invested and 0.1% commission.
What do you think about it? Does it make sense to do something like that?
Do you have in mind other ways I can accelerate it when the market starts to be more volatile?
Disclaimer
Please remember that past performance may not be indicative of future results.
Due to various factors, including changing market conditions, the strategy may no longer perform as good as in historical backtesting.
This post and the script don’t provide any financial advice.
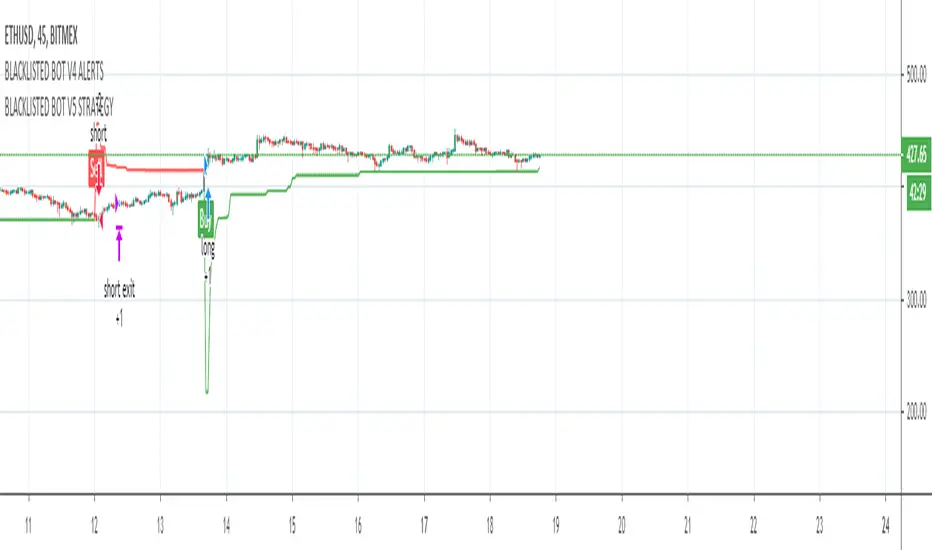
BLACKLISTED BOT V3 STRATEGYStudy used for the Blacklisted Trading Bot
This script uses a variation of ATR and Moving averages giving an alert for a fully automated trading solution.
Fine tuned parameters vary per coin which will be provided for the user after permission is granted.
To gain access to this strategy feel free to contact me directly using a private message.
Support/ Resistance with H1 ATR - strategy mainline versionThis script using ATR (average true range) with source hl2 for create Support/ Resistance line
The color meaning:
- Green = Support line
- Red = Resistance line
Signal:
- If close price breakout Resistance line -> LONG signal will been active.
- If close price breakout Support line -> SHORT signal will been active.
Input setting:
Recommended default setting.
- Factor: amplitude for create Support/ Resistance line.
- Length: length of ATR.
- Offset: number of bar for check sideway or choppy market.
- Take profit: if you want test close position by profit.
- Stop loss: should not be missed.
- Open Position with Stop-Market type:
+ Open LONG position with high price and type Stop-Market.
+ Open SHORT position with low price and type Stop-Market.
Strategy setting:
Recommended default setting if you trade on Binance Futures or change Comission if you trade on another exchange.
Best backtest if:
- Max drawdown less than 10%.
- Min backtest time: 6 month.
- Avg profit: 10%/ month when no leverage is used.
Alert version:
1 - Select create new alert
2 - Condition:
+ eb BUY -> LONG signal
+ eb BUY close -> close LONG position
+ eb SELL -> SHORT signal
+ eb SELL close -> close SHORT position
3 - Option: recommended using only. Because the signal will be more accurate if the price close breakout successfully.
+ Always put stop loss position to avoid PUMP/ DUMP market.
// Note: alert version not free, send for me a private message on TradingView to get price and gain access.
Recommended:
- Using in M30, M45, H1 timeframe with default setting.
- Symbol: BTC
- Exchange: Binance Futures
- Order size: 10% wallet balance, maximum 25% wallet balance.
- Leverage: X2-X5, maximum X10.
---> I using 10% wallet balance and X2 only.

Twin Range Filter Algo@Colinmck used two different ranges to generate signals. Read his release notes to find out what the original script does.
I added one condition which seems to increase performance on 15m BTCUSD as well as 1h BTCUSD and that is ATR with 32 periods being smaller than ATR with 64 periods. I used my script Volatility Optimiser to discover this tendency.
Both buying and selling conditions are same as in @Colinmck's script plus one condition of my own. You can disable my condition.
Target and stop-loss are manually set values in ticks.
Time stop-loss is manually set value in a number of candles. After this number of candles, a position always exits (or should 😇). You can disable it by inserting a very long period. I do not recommend it, because a value of indicator should not be measured in luck and if market starts moving in the direction after 40 periods, the predictive capability of an indicator is questionable.
I used 300/150/17 for 15m BTCUSD chart and 900/30/17 for 1h BTCUSD. I didn't try to optimize any other parameters for these periods.
Since this script relies mostly on volatility for its prediction, I wouldn't recommend using it on its own. Individual approach to the market is recommended. Also, it didn't work on EURUSD when using the same default values and different order management (tp, sl, time sl), so it is probably not as versatile.
Let me know what do you think of this strategy. If you have some ideas about how to make it more reliable, share it in the comments, I might put it to the test. Good luck 🍀

TradeSense Breakout Strategy v1TradeSense is a Renko brick breakout trading system for short-term or intraday trade. It is also a trend following strategy using a confluence of multiple MA's to spot the underlying trend. Exit and Stop Loss is based on dynamic ATR to predict possible target based on ticker's real time volatility.
So far this has been back-tested on major cyrptos, and the same concept is applicable to other asset types. It is more suitable for lower timeframes (such as the 30m, 15m, and 5m) though you may try adjusting the parameters for higher timeframes.
Feel free to backtest it and comment below!
Optimum parameters:
BTCUSD-15m
- Noise Filter: 1
- ATRLength : 15
- SL coefficient : 2.0
- TP coefficient : 1.5
ETHUSD-15m
- Noise Filter: 7
- ATRLength : 16
- SL coefficient : 2.0
- TP coefficient : 1.5

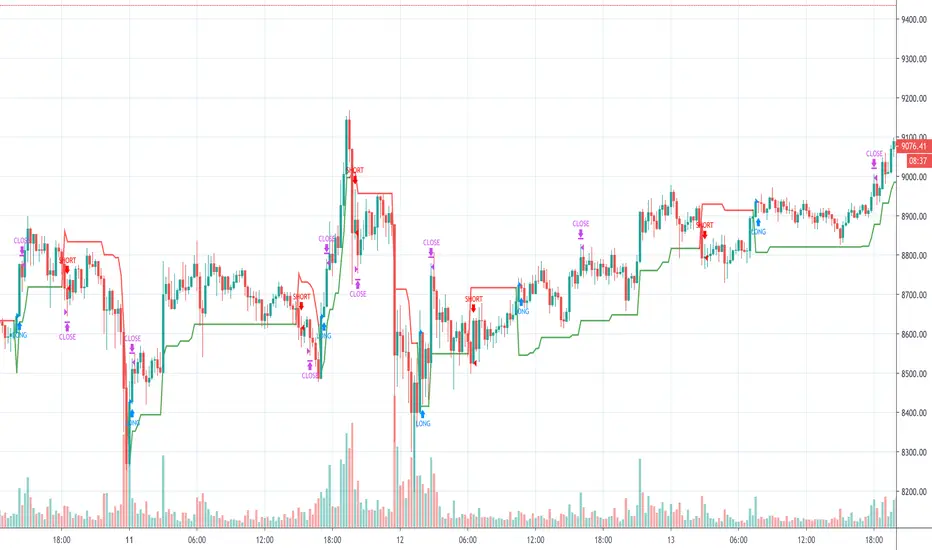
ATR Trailing Stop advanceHello Traders,
The average true range (ATR) is a technical analysis indicator that measures market volatility . The ATR indicator is easy to use and gives an accurate reading about an ongoing trend that very effective.
I. Signals are used for entry
- Entry your long position (buy) when price crosses above the ATR trailing stop line.
- Entry your short position (sell) when price crosses below the ATR trailing stop line.
II. ATR Trailing Stops Setup
- The ATR period is used to adjust the sensitivity of the ATR trailing stop line. With larger period, the ATR will "smoother" but will signal slower than the price.
- ATR multiplier is a multiple of ATR trailing stop.
- If you want to backtest with trailing take profit, you can tick the box “test with trailing?”. It will affect 2 parameters which are: Trailing point and trailing offset. Where: Trailing Point is the trigger point, the distance from the entry price. Trailing Offset is the take-profit price, which is the distance from the Trailing Point.
III. A few ATR trailing stop configurations, you can use for backtesting:
1. BTC /USDT (M15):
- ATR period: 80
- ATR multiple: 1.91
- Trailing point: 63
- Trailing offset: 10
2. BTC /USDT (M30):
- ATR period: 71
- ATR multiple: 1.63
- Trailing point: 60
- Trailing offset: 10
3. ETH/USDT (M30):
- ATR period: 90
- ATR multiple: 1.81
- Trailing point: 1.12
- Trailing offset: 0.15
4. XRP/USDT (M30):
- ATR period: 125
- ATR multiple: 1.61
- Trailing point: 0.0016
- Trailing offset: 0.0003
IMPORTANT:
Generally, ATR trailing stop still fails in a sideways-moving market. Be Careful and research the strategy before making a buy/sell order.
Hope you enjoy it. We look forward to hearing from you so we can improve this strategy.
Thank you,
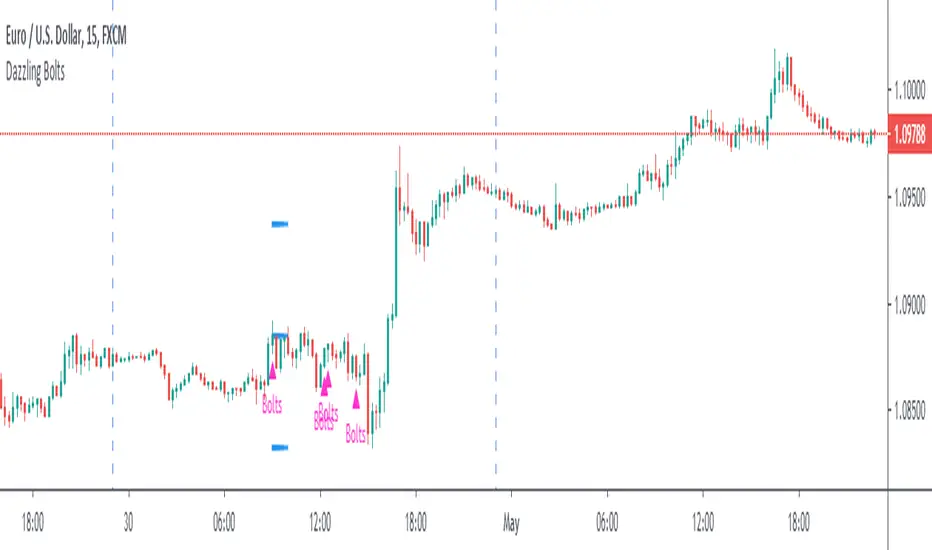
Dazzling BoltsThis is three moving average based strategy focused on trend-following. Targets and stops are set based on ATR. Following image pictures the strategy with all mas plotted:
Buying conditions are:
►A smoothened moving average (red) is above the exponential moving average (yellow)
►An exponential moving average is above simple moving average (black)
►Low five candles ago was still above the exponential moving average
►Low two candles ago reached below the exponential moving average
►Close of the previous candle was above the exponential moving average
►Ema force is disabled or exponential moving average set candles ago (orange) is still above simple moving average now.
If these conditions are met, Dazzling Bolts will always give you a signal. However, it holds only one position at a time and it will not buy again until it is closed or exited.
There are two ways exiting may happen. Smoothened moving average crosses below simple moving average or it reaches value based on your settings of average true range and its multiplier.
Settings 10/76/200/true/50/true/true/5/5 shows perfect results on EURUSD 15m chart but it does not guarantee the results. It is only 62 trades which is barely a useful statistical source. It is also highly optimized which means its settings filters out bad trades that may be bad only because of randomnation rather than set market behaviour. You need to test it on 200 trades + before using.
USDJPY 30 MIN STRATEGYThis strategy uses a combination linear regression moving averages and ATR, fine-tuned to the USD/JPY 30 minute chart. Without going into too much detail, the long/short signals are based upon linear regression moving average crosses and slope with ATR confirmation.
All code is based on one time frame with no security functions so zero repaint. Backtest is based upon compounding 100% of your capital using zero leverage.
PM me for access to the strategy. Alert indicator for this available for donation via BTC.
I'm not a professional coder, but the backtests speak for themselves. As with anything on Tradingview, your results may vary and use at your own risk. Past performance is no indication of future performance.
- Hoffdaddy

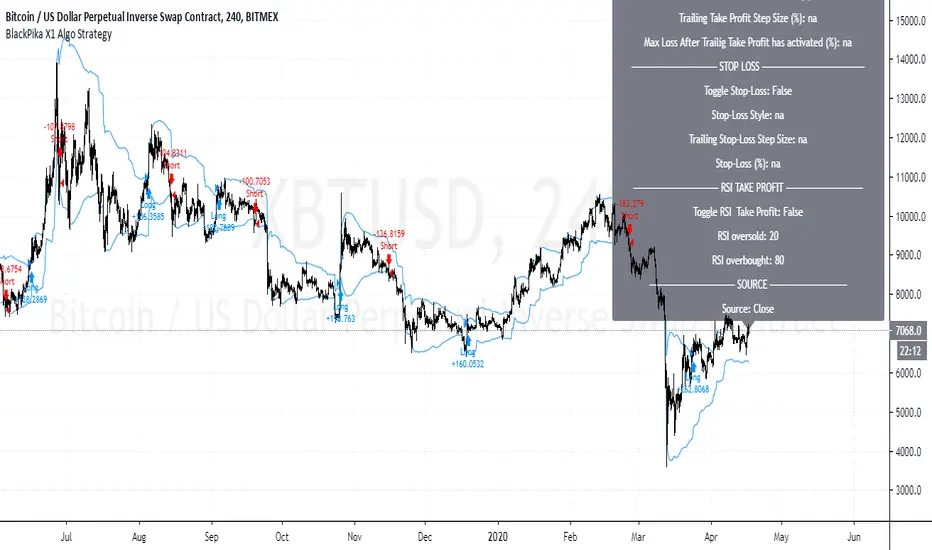
BlackPika X1 Algo StrategyBlackPika X1 Algo is a successor to the original BlackPika Algo.
It uses the following main elements:
RSI
ATR
ADX
Volume
Chopiness Filter
Trailing Profit
Fixed Profit
Trailing Stop loss
Fixed Stop Loss
Donchian channels and some more...
The backtest you see includes a commision of 1% and slippage of 1 tick. and the start date is from 2015
All the above mentioned settings are customisable, and can be adapted to your liking, timeframe and Asset.
Hit me up if you have any questions. This is only a backtest version.
All the best in your trading.
KBL Trend - Master Pro v1KBL Trend Master is Specially design to detect the upcoming and current trend using Price action and ATR based combined Trading strategy.
When KBL Trend - Master line indicated with Green color and price is above the KBL Trend - Master Line , Then the trend is in buy side and a buy trade is preferred.
And same for sell trade,
When KBL Trend - Master line indicated with Orange color and price is Below the KBL Trend - Master Line , Then the trend is in sell side and a sell trade is preferred.
In This Pro Version 1 , new studies have been added to give more crisp to the accuracy of the indicator.
We added following new parameters,
Added Buy Sell Signals
Added Back-test Option
Added Trend Bases Auto Signals
PM us to obtain access.

KBL Trend - FilterKBL Trend Filter is a combination of Average true range and range breakout settings.
When KBL Trend -Filter Vertical line indicated with Green color and price cross over the candle on which the green vertical indicator came, then it is considered as a buy trades.
And same for sell trade,
When KBL Trend -Filter Vertical line indicated with Red color and price cross below the candle on which the Red vertical indicator came, then it is considered as a sell trades.

KBL Trend - MasterKBL Trend Master is Specially design to detect the upcoming and current trend using Price action and ATR based combined Trading strategy.
When KBL Trend - Master line indicated with Teal color and price is above the KBL Trend - Master Line , Then the trend is in buy side and a buy trade is preferred.
And same for sell trade,
When KBL Trend - Master line indicated with Orange color and price is Below the KBL Trend - Master Line , Then the trend is in sell side and a sell trade is preferred.

XPloRR S&P500 Stock Market Crash Detection Strategy v2XPloRR S&P500 Stock Market Crash Detection Strategy v2
Long-Term Trailing-Stop strategy detecting S&P500 Stock Market Crashes/Corrections and showing Volatility as warning signal for upcoming crashes
Detecting or avoiding stock market crashes seems to be the 'Holy Grail' of strategies.
Since none of the strategies that I tested can beat the long term Buy&Hold strategy, the purpose was to detect a stock market crash on the S&P500 and step out in time to minimize losses and beat the Buy&Hold strategy. So beat the Buy&Hold strategy with around 10 trades. 100% capitalize sold trade into new trade.
With the default parameters the strategy generates 10262% profit (starting at 01/01/1962 until release date), with 10 closed trades, 100% profitable, while the Buy&Hold strategy only generates 3633% profit, so this strategy beats the Buy&Hold strategy by 2.82 times !
Also the strategy detects all major S&P500 stock market crashes and corrections since 1962 depending on the Trailing Stop Smoothness parameter, and steps out in time to cut losses and steps in again after the bottom has been reached. The 5 major crashes/corrections of 1987, 1990, 2001, 2008 and 2010 were successfully detected with the default parameters.
The script was first released on November 03 2019 and detected the Corona Crash on March 04 2020 with a Volatility crash-alert and a Sell crash-alert.
I have also created an Alerter Study Script based on the engine of this script, which generates Buy, Sell and Volatility signals.
If you are interested in this Alerter version script, please drop me a mail.
The script shows a lot of graphical information:
the Close value is shown in light-green. When the Close value is temporarily lower than the Buy value, the Close value is shown in light-red. This way it is possible to evaluate the virtual losses during the current trade.
the Trailing Stop value is shown in dark-green. When the Sell value is lower than the Buy value, the last color of the trade will be red (best viewed when zoomed)
the EMA and SMA values for both Buy and Sell signals are shown as colored graphs
the Buy signals are labeled in blue and the Sell signals are labeled in purple
the Volatility is shown below in green and red. The Alert Threshold (red) is default set to 2 (see Volatility Threshold parameter below)
How to use this Strategy?
Select the SPX (S&P500) graph and add this script to the graph.
Look in the strategy tester overview to optimize the values Percent Profitable and Net Profit (using the strategy settings icon, you can increase/decrease the parameters), then keep using these parameters for future Buy/Sell signals on the S&P500.
More trades don't necessarily generate more overall profit. It is important to detect only the major crashes and avoid closing trades on the smaller corrections. Bearing the smaller corrections generates a higher profit.
Watch out for the Volatility Alerts generated at the bottom (red). The Threshold can by changed by the Volatility Threshold parameter (default=2% ATR). In almost all crashes/corrections there is an alert ahead of the crash.
Although the signal doesn't predict the exact timing of the crash/correction, it is a clear warning signal that bearish times are ahead!
The correction in December 2018 was not a major crash but there was already a red Volatility warning alert. If the Volatility Alert repeats the next weeks/months, chances are higher that a bigger crash or correction is near. As can be seen in the graphic, the deeper the crash is, the higher and wider the red Volatility signal goes. So keep an eye on the red flag!
Here are the parameters:
Fast MA Buy: buy trigger when Fast MA Buy crosses over the Slow MA Buy value (use values between 10-20)
Slow MA Buy: buy trigger when Fast MA Buy crosses over the Slow MA Buy value (use values between 21-50)
Minimum Buy Strength: minimum upward trend value of the Fast MA Buy value (directional coefficient)(use values between 10-100)
Fast MA Sell: sell trigger when Fast MA Sell crosses under the Slow MA Sell value (use values between 10-20)
Slow MA Sell: sell trigger when Fast MA Sell crosses under the Slow MA Sell value (use values between 21-50)
Minimum Sell Strength: minimum downward trend value of the Fast MA Sell value (directional coefficient)(use values between 10-100)
Trailing Stop ATR: trailing stop % distance from the smoothed Close value (use values between 2-20)
Trailing Stop Smoothness: MA value for smoothing out the Trailing Stop close value
Buy On Start Date: force Buy on start date even without Buy signal (default: true)
Sell On End Date: force Sell on end date even without Sell signal (default: true)
Volatility EMA Period: MA value of the Volatility value (default 15)
Volatility Threshold: Threshold value to change volatility graph to red (default 2)
Volatility Graph Scaler: Scaling of the volatility graph (default 5)
Important : optimizing and using these parameters is no guarantee for future winning trades!

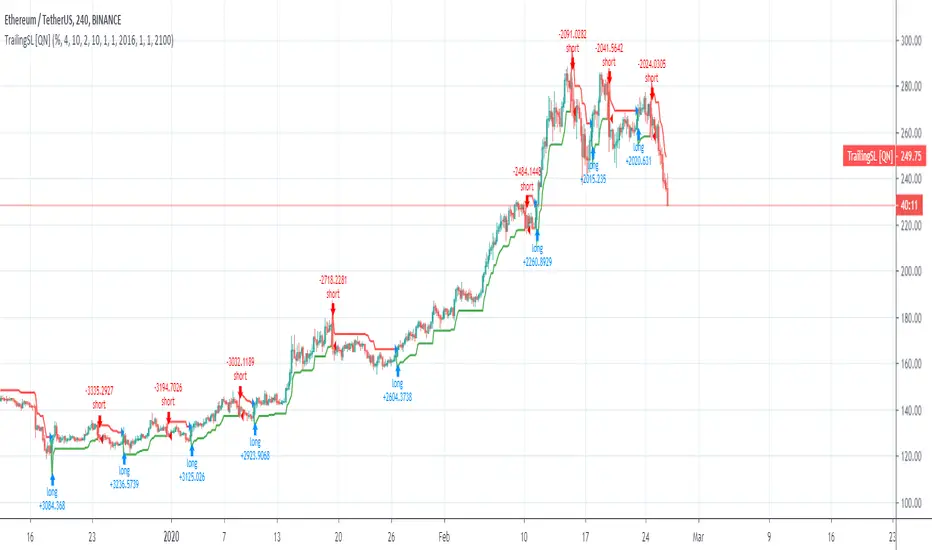
Trailing SL Strategy [QuantNomad]I'm a big fan of simple strategies.
This one is a very simple one. So it consists only from one Trailing SL. When SL is hit, the position is reversed and SL is tracked for a new position.
You can choose one of 3 types of SL:
% of your price
ATR - it is calculated as current ATR * multiplier
Absolute
As you can see even this simple strategy can show pretty good results.
[LunaOwl] 超級趨勢2 (SuperTrend2)It is very similar to the previous version. I changed the function from study to a strategy, and added the Average true range to RMA again.
I don't know the academic suitability, but using this strategy to trade the Altcoins market may have a good effect.
refer to Binance for 0.1% of fees, starting from Q4 2017.
跟以前的版本變化不大,我將腳本函數從"study"更改為"strategy",然後將平均真實範圍再次用遞迴平均線均化數值。
不知道學術上的適不適合這麼做...但是,直到目前交易小幣現貨市場,效果還算不錯,用用看。
交易手續費參考幣安小幣,0.1%,從2017年第四季開始測。
Updated:
--1. use RMA to reduce ATR noise.
--2. for the highly volatile Altcions market, strategy should focus on reducing noise.
--3. the Street commonly used alpha filtering for Random Walk.
--4. compared to other MAs, the performance is not outstanding, but the advantage is stability.
--5. I choose the 4H time frame to test the Altcoins (ex: ETH).
稍做更新:
--1.平均真實區間利用了遞迴均線減少雜訊
--2.針對高波動率的小幣市場,中期順勢策略應該以減少雜訊為重點
--3.研究國外交易策略後,它們常用平滑因子過濾隨機走勢
--4.績效上和其它平均法比較並沒有突出,但優點是參數變動穩定性
--5.我選擇四小時線回測小幣市場,並且選擇經歷過牛熊市的以太坊
The purpose of publishing Chinese Scripts is to make Pine close to more Chinese user.
發布中文腳本的目的,是希望可以讓 Pine 親近更多中文圈的使用者。


ATR Strategy FOREX for long only with market filterI did a modification and added a market filter and changed to buy only. It showed a remarkable good result by doing so. It make sense, since upptrends and downtrends behave different and a strategy that includes both buying and selling will do poorly in general.

BlackPika XBTUSD Algo StrategyThis is a strategy script to the "BlackPika XBTUSD Algo" with Take Profit and Stop Loss features.
Easy to backtest. Enjoy

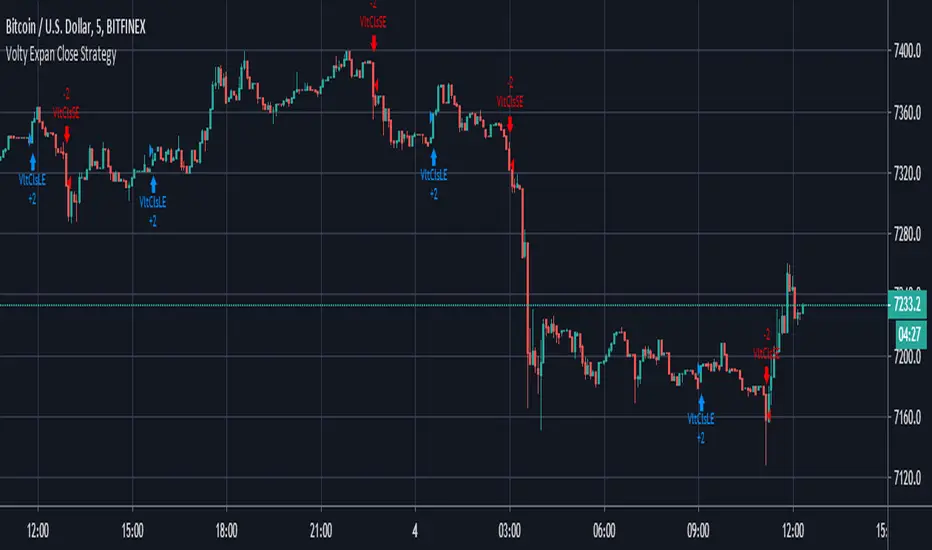
Volty Expan Close Strategy with Backtest Date RangeInput Information
Length Numeric 5 Number of bars used to determine the average true range.
NumATRs Numeric .75 Factor used to calculate a percentage of the average true range, used to
Long and short entry based on a percentage of price movement beyond the average range.
Profitable and simple strategy..
ANN RSI SUPER TREND STRATEGY BY che_traderCreate a strategy for the good indicator created by @RafaelZioni
Which is composed of ANN data taken from
and the super trend shared by www.tradingview.com
Feel free to share and copy this script!
Enjoy!
