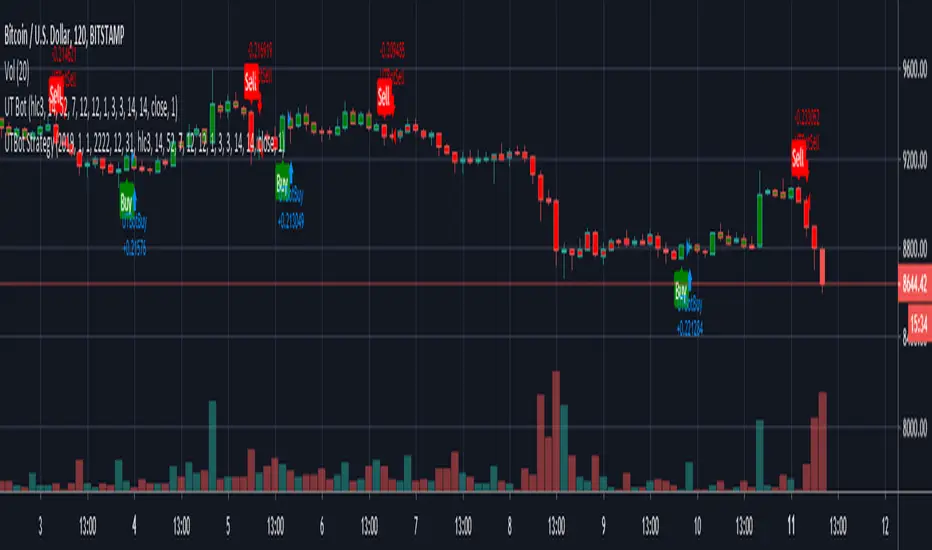
Kirk65 UTBot Strategy FixedCredits to @HPotter for the orginal code.
Credits to @Yo_adriiiiaan for recently publishing the UT Bot study based on the original code.
Credits to @TradersAITradingPlans for making UT Bot strategy.
Strategy fixed with time period by Kirk65.
UT Bot works great with 2 hour time frame with Heikin Ashi, but riskier. Use "Once per bar" In alerts with 1.5% stoploss. If the price goes against Alerts, stoploss will save your assets. Wait until next Alert.
4 hour time frame is less risky and less profitable.
Happy trading..
Kirk65
טווח ממוצע אמיתי (ATR)
SuperTrend Strategy This is almost the same strategy that Alex Orekhov (everget) sells to unnoticed newbies... The only thing he added was a tool that analyses the better performance of the indicator, that is the difference from his script, and i dont have it here, what i have is what is freely distributed in many communities... But as i follow him for more than 1 year i saw that theese configs. In more than 95% of the time range betweern 7.2-6.8 with the most common settings the 7-7
So i made a description of each part of the code that i WRITED and is free and i am just using the configs that are public in Alex Orekhov (everget) profile. If it is public the configs he use in his charts and he is not the owner of the code right? Also the code is very easy to find in google in the MQL5 community or in a lot of videos in youtube.
He charges $10 for a 4 day trial (LOL) and $100 for this shit.
Here is a strategy that has a correlation with 95% of the time of the Profitable Strategy that he sells.
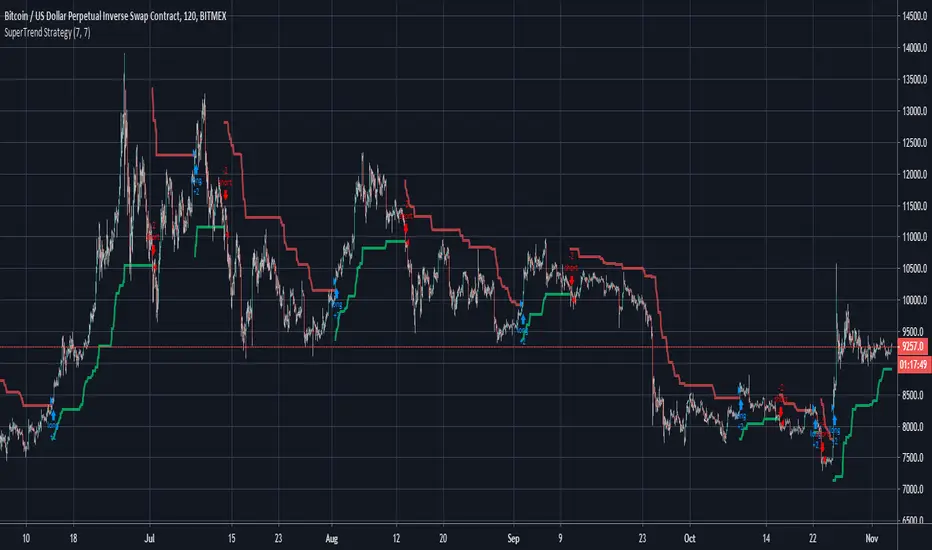
[STRATEGY] SuperTrendA private strategy from the Profitable SuperTrend preview for backtesting purposes.
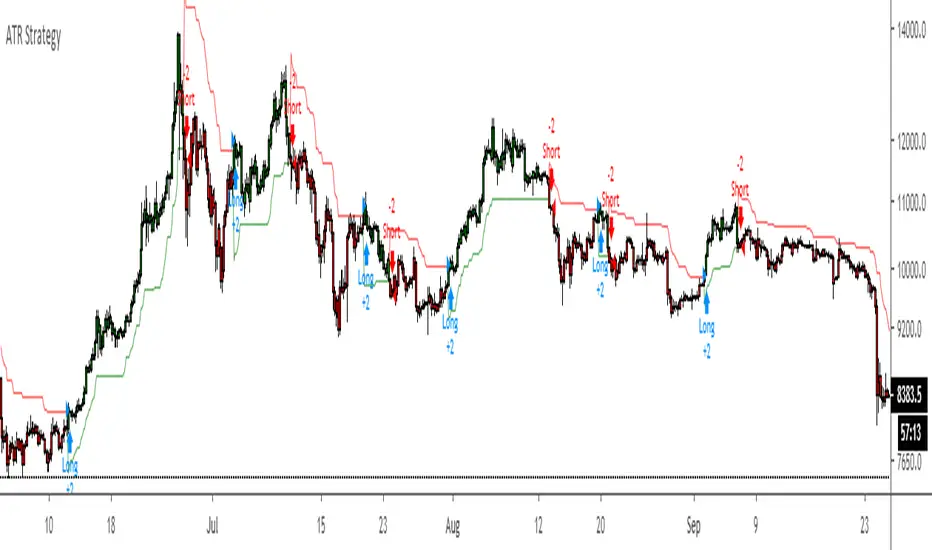
ATR Strategy Back test Original script by HPotter
ATR strategy is profitable.
Buy when it says buy and sell when it says sell.
Simple EMA Long Only StrategySimple EMA long only strategy, using ATR on crossings to minimize fake signals.

Turtle trading strategy (Donchian/ATR)Strategy based on Turtle Trading Strategy from William Eckhardt and Richard Dennis
- Considers entering trades on breakout of Donchian channels (upper for long, lower for short) (Default length = 20 for daily)
- Considers exiting trades on breakout of Donchian channels (lower for long, upper for short) with lower length (10 for daily)
- Uses 2N ATR (default) as stop loss


BlackMagic [BTC]BlackMagick is a trend following script looking to enter on retracements when a trend has been defined and should only be used on BTC/USD
Entries are marked with the X symbol
Stop-loss is a red circle
take profit is a green circle
The background colour of the entry defines which direction the trade should be placed green for long, red for short.
You can configure the stop loss which uses a 20-period ATR multiplied by 2.2 (this is configurable)
Take profit is derived by a Risk-Reward ratio, which is a default of 2 (this is configurable)

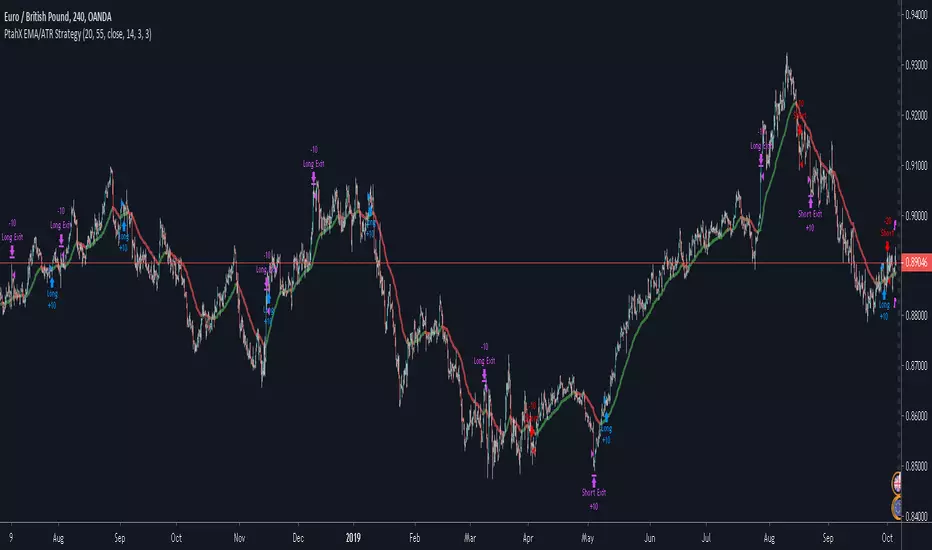
PtahX EMA/ATR StrategyPtahX EMA/ATR Strategy Public Release
written October 2019
EMA Strategy with ATR & "Fear Factor" built in
* modifications welcome
* please let me know if you improve it so I can continue to learn :)
* use at your own risk - I'm a new programmer and still learning
* Best of luck on your trades!!
// Take Profit (TP) option based on ATR or MA Crossover
Super Trend 4hr XBT BFThis script is designed for XBT/USD on Bitmex 4hr chart .
The signals are generated from a calculation of the overall super trend using ATR.
The stop loss level is also determined by a separate ATR calculation. This allows for dynamic stop loss placement depending on how volatile the market. Lower ATR = tighter Stop.
I tried a Take-Profit function but it seems the best results I can find come from exiting a trade upon an opposing signal.
INSTRUCTIONS
1. Go Long when background turns green, or short when it turns red.
2. Set your stop loss as indicated on the chart by the dotted lines. Yellow is stop loss for a long signal, orange for short.
3. Exit on an opposing signal.
NB: the Stop losses are only plotted on the chart when we are not stopped out. If we get stopped out, we wait for the next signal.

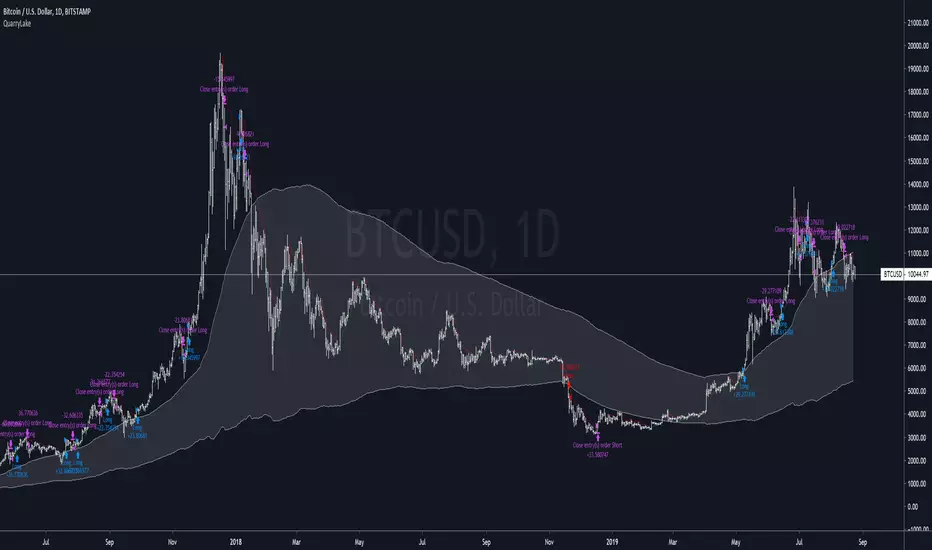
QuarryLake v4As some of you requested, I will make the code for QuarryLake Open for you all.
I have also updated the script in version 4.
This strategy consists of 3 indicators that I found works quite well together.
Keltner Channel, Waddah Attah Explosion, and Volatility Stop .
KC Period = 200
KCATR = 5
Vstop Period = 3
Vstop Mult = 1.5
Long when close > KC, close > Vstop, WAE trendUp
Short when close < KC, close < Vstop, WAE trendDown
Works well on BTCUSD XBTUSD , as well as other major liquid Pair.
This strategy utilized a modified Kelly position sizing for BTCUSD Bitstamp , feel free to modify it to your needs.
And lastly,
Save Hong Kong, the revolution of our times.

inwCoin CDC ATR Trailing Stop Risk% StrategyATR Strategy base on CDC ATR Trailing stop นะครับ
ตัวนี้มี option ให้เลือกว่าจะใช้ stop ตาม ATR หรืออยากจะ stop แบบแท่งเทียนย้อนหลัง
ลองเล่นๆ ดูครับ

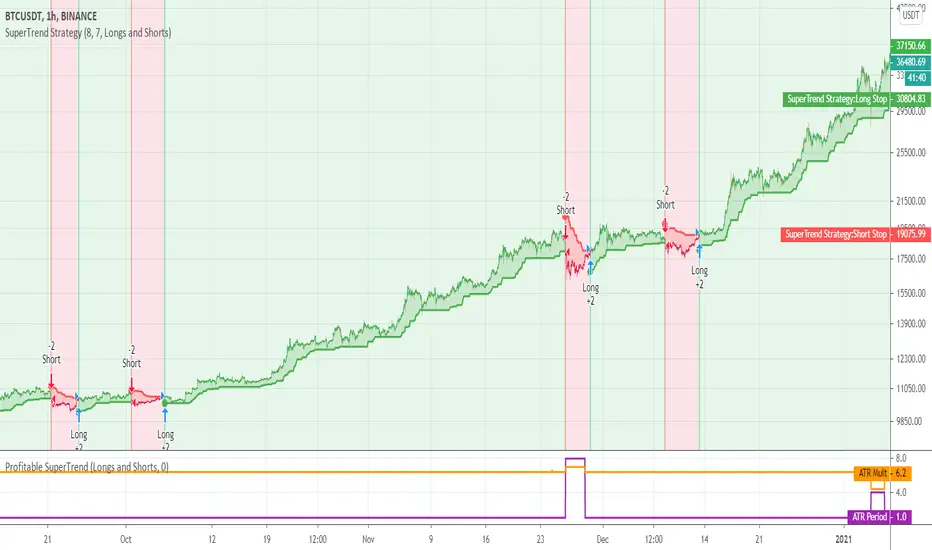
Cyatophilum SuperTrend [BACKTEST]The SuperTrend Indicator and Strategy built upon Average True Range.
- Backtest Version -
>> READ HOW TO USE HERE <<

QuarryLake - An ATR base strategyThis strategy consists of 3 indicators that I found works quite well together.
Keltner Channel, Waddah Attah Explosion, and Volatility Stop.
You can find WAE here
KC Period = 200
KCATR = 5
Vstop Period = 3
Vstop Mult = 1.5
Long when close > KC, close > Vstop, WAE trendUp
Short when close < KC, close < Vstop, WAE trendDown
Works well on BTCUSD XBTUSD, as well as other major liquid Pair.
This strategy utilized a modified Kelly position sizing for BTCUSD Bitstamp, feel free to modify it to your needs.
More information can be found here dqydj.com
Feel free to follow me on Twitter @Lancelot_Auger for more free Alpha.

IFT Stochastic + Trailing StopInverse fisher transform on stochastic strategy with trailing stop. Good work on flats with mid-wave length

Stochastic + ATRStochastic oscillator with dynamic buy/sell levels. Levels calculate with volatility/averag true range. No repaint

Stochastic + ATRIt is a stochastic with dynamic buy sell levels. Levels are calculate from volatility/average true range. No repaints

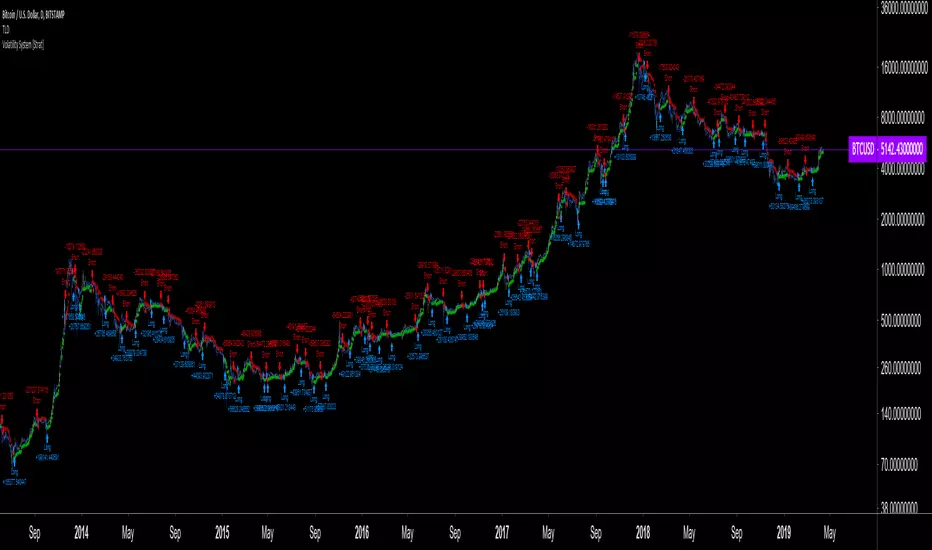
Volatility System by Wilder [LucF]The Volatility System was created by J. Welles Wilder, Jr. It first appeared in his seminal masterpiece, "New Concepts in Technical Trading Systems" (1978). He describes the system on pp.23-26, in the chapter discussing the first presentation ever of the "Volatility Index", built using a novel way of calculating a value representing volatility that he named Average True Range (ATR). The latter stuck.
The system is a pure reversal system (it is always either long or short). One of its characteristics is that its stop strategy moves up and down during a trade, widening the gap from price when volatility (ATR) increases. Because of this, this strategy can suffer large drawdowns and is not for the faint of heart.
The strategy uses a length (n) to calculate an ATR. ATR(n) is then multiplied by a factor to calculate the Average Range Constant (ARC). The ARC is then added to the lowest close n bars back to form the high Stop and Reverse points (SAR), and subtracted from the highest close n bars back to calculate the low SAR. Reversals occur when price closes above the high SAR or below the low SAR.
The system is best suited to higher time frames: 12H and above. Its performance depends heavily on calibration of the length and ARC factor. Wilder proposes a length of 7 and a factor between 2.8 to 3.1. My summary tests at 12H, 1D and 3D on stocks and cryptos yield better results with values of approximately 9-10/1.8-2.5 for cryptos and 9-10/3.0-4.0 for stocks. Small changes in the values will sometimes yield large variations in results, which I don’t particularly like because it tends to imply fragility, whereas I’d expect more robustness from a system with such simple rules. Additionally, backtests at 1D on cryptos provide so little data that no solid conclusions can be drawn from them.
All in all, the system is not very useful in my opinion; I publish it more for completeness, since as far as I can tell, it did not exist on this platform before. I also publish it out of respect for Wilder’s work. His book laid the foundation for many of the building blocks used by system designers, even today. In less than a hundred pages he presented RSI, ATR, DMI, ADXR and the Parabolic SAR indicators, some of which have become built-in functions in programming languages. This is a colossal feat and has not been repeated. Wilder is a monument.
Some lesser-known facts about his book:
It sells for the exact same price it cost in 1978: 65$,
The book has always been published by Wilder himself,
The layout hasn’t changed in 40 years,
He sells >35K copies/year.
Gotta love the guy.
The strategy is shown here on BTC /USD with settings of 12/1.8 (the defaults are 9/1.8). It shows the system under its best light. Other markets will most not reproduce such results. Also, the drawdown is as scary as the results are impressive.
Features
The code is written as a strategy but can easily be converted to an indicator if you want to use the alerts it can produce. Instructions are in the code.
You can change the length and ARC factor.
You can choose to trade only long or short positions.
You can choose to display the SARs (the stops) in multiple ways.
You can show trigger markers.
A date range can be defined.
3 alerts: reversals (both long and short), longs, shorts. Remember that for the moment, strategies cannot generate alerts in TradingView, so the strategy must be converted to an indicator in order to make the alerts available.
Flow Trend Indicator Strategy V2Incorporated some strategies into one strategy. Every strategy can be tested using the TV StrategyTester.


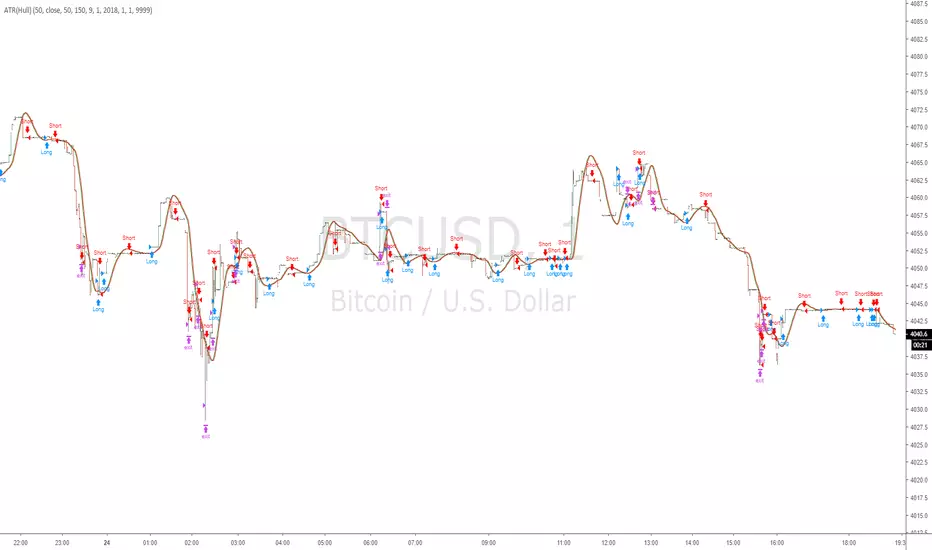
HMA_ATR_TSIA combination of signals trigger this strategy.
HMA crossovers (short period & long period) -Hull moving average-
ATR (smoothed with HMA) -Average true range-
TSI -True strength index-
The final close price is not known until right at the end of the bar.
This means that the indicator is constantly “repainting” during the bar.
You will see that indicators are constantly moving with each tick received
Use Open instead, the value is set and does not change even after refreshing the page.
An attempt to reduce repainting.

ATR smoothed by Hull MAThis is Average True Range indicator, but it is smoothed with Hull MA ( not WMA etc )
It is set to overlay the candles so looks different from normal ATR but i assure you it is ATR
Script open so you can see for yourself.
perhaps different settings are better,
Help me test it, and suggest improvements thankyou