stock-vs-industry using NQUSB benchmark idexesOriginal idea from Stock versus Industry by Tr33man .
━━━━━━━━━━━━━━━━━━━━━━━━━━━━━━━━━━━━━━━━
═══ PRIMARY IMPROVEMENT: NQUSB Hierarchical Index Benchmarks ═══
The KEY improvement: Multi-Level Industry Granularity with Drill-Down/Drill-Up Navigation
From: Simple ETF Comparison (1 Level) Stock → Industry ETF (e.g., "SOXX" for all semiconductors)
To: NQUSB Hierarchical Comparison (4 Levels)
Level 4 (Primary): NQUSB10102010 → Semiconductors (most specific)
Level 3 (Secondary): NQUSB101020 → Technology Hardware and Equipment
Level 2 (Tertiary): NQUSB101010 → Software and Computer Services
Level 1 (Quaternary): NQUSB10 → Technology (broadest sector)
Users can now drill up and down the industry hierarchy to see how their stock performs against different levels of industry classification!
━━━━━━━━━━━━━━━━━━━━━━━━━━━━━━━━━━━━━━━━
═══ WHY THIS MATTERS ═══
Original Limitations:
Single comparison level - ETF only
No drill-down capability - Can't zoom in to more specific industries
No drill-up capability - Can't zoom out to broader sectors
ETF limitations - Not all industries have dedicated ETFs
Arbitrary mappings - Manual ETF selection may not represent true industry
Improved Capabilities:
4-level hierarchical navigation - Drill-down and drill-up through industry classifications
361 NQUSB official indices - NASDAQ US Benchmark Index structure
Official NASDAQ classification - Industry-standard taxonomy
Large Mid Cap (LM) option - Focus on larger companies when needed
Enhanced UI - Clear level indicators and full index descriptions
━━━━━━━━━━━━━━━━━━━━━━━━━━━━━━━━━━━━━━━━
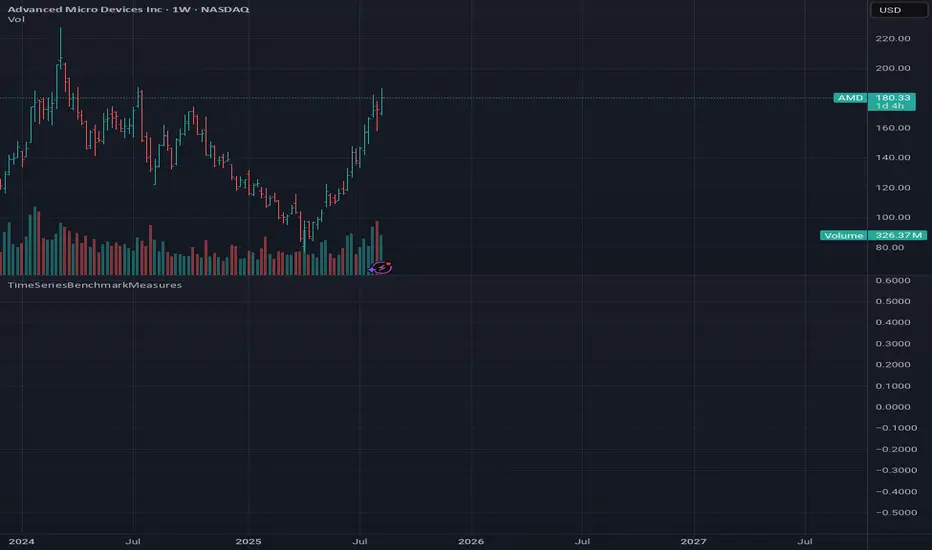
═══ EXAMPLE: ANALYZING NVDA (Semiconductors) ═══
Level 4 - Primary (Most Specific):
NQUSB10102010 - Semiconductors
→ NVDA vs. AMD, AVGO, QCOM, TXN, etc. (direct competitors)
Level 3 - Secondary (Broader):
NQUSB101020 - Tech Hardware & Equipment
→ NVDA vs. AAPL, CSCO + semiconductors
Level 2 - Tertiary (Even Broader):
NQUSB101010 - Software and Computer Services
→ NVDA vs. all tech hardware
Level 1 - Quaternary (Broadest):
NQUSB10 - Technology Sector
→ NVDA vs. entire technology sector
You can now zoom in to see direct competitors or zoom out to understand macro sector trends - all in one indicator!
━━━━━━━━━━━━━━━━━━━━━━━━━━━━━━━━━━━━━━━━
═══ COMPARISON SUMMARY ═══
Original Version:
Comparison System: Industry ETFs
Industry Levels: 1 (flat ETF mapping)
Total Classifications: ~140 industries
Hierarchy Navigation: ❌ No
Data Source: Manual ETF curation
Improved Version:
Comparison System: NQUSB Official Indices
Industry Levels: 4 (hierarchical drill-down/up)
Total Classifications: 361 NQUSB indices
Hierarchy Navigation: ✅ 4-level drill navigation
Data Source: NASDAQ official taxonomy
Large/Mid Cap Option: ✅ LM variant toggle
Level Indicator: ✅ to labels
━━━━━━━━━━━━━━━━━━━━━━━━━━━━━━━━━━━━━━━━
═══ ADDITIONAL FEATURES ═══
Dual Comparison System - Toggle between ETF mode (original) and Index Benchmark mode (NQUSB hierarchy)
Better Fallback Logic - Manual Override > NQUSB Index > ETF > SPY default
Enhanced Display - 4-row information table with full NQUSB index description
Backward Compatible - All original ETF mappings still work, existing charts won't break
Large Mid Cap Toggle - Optional "LM" suffix for focusing on larger companies only
━━━━━━━━━━━━━━━━━━━━━━━━━━━━━━━━━━━━━━━━
For complete documentation, data files, technical details, and the full NQUSB hierarchy structure, visit the GitHub repository.
The result: More accurate, more flexible, and more comprehensive industry strength analysis - enabling traders to understand exactly where their stock's performance comes from by drilling through multiple levels of industry classification.
אינדיקטור Pine Script®