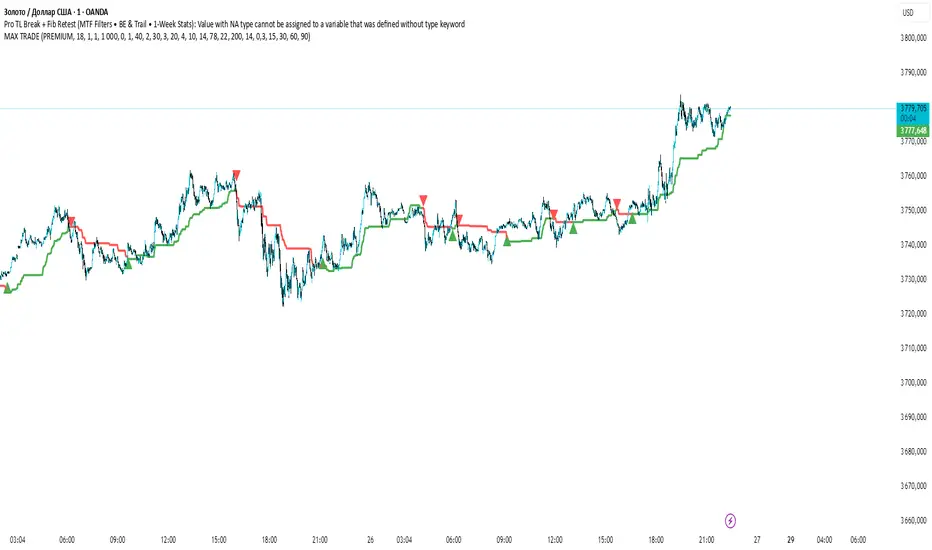
MAX TRADE C1MAX TRADE is designed to identify strong market trends and precise reversal points.
🔹 Built on Fibonacci levels
🔹 Generates Buy & Sell signals
🔹 Calculates Risk/Reward ratios
🔹 Automatically displays TP (Take Profit) and SL (Stop Loss) zones
מתנדי ביל וויליאמס

MAX TRADEMAX TRADE is designed to identify strong market trends and precise reversal points.
🔹 Built on Fibonacci levels
🔹 Generates Buy & Sell signals
🔹 Calculates Risk/Reward ratios
🔹 Automatically displays TP (Take Profit) and SL (Stop Loss) zones
CCI vs Two EMAs + Trendlines + Breakout HighlightPerfect indicator which analyzes the cci4000 & 2 EMAS.
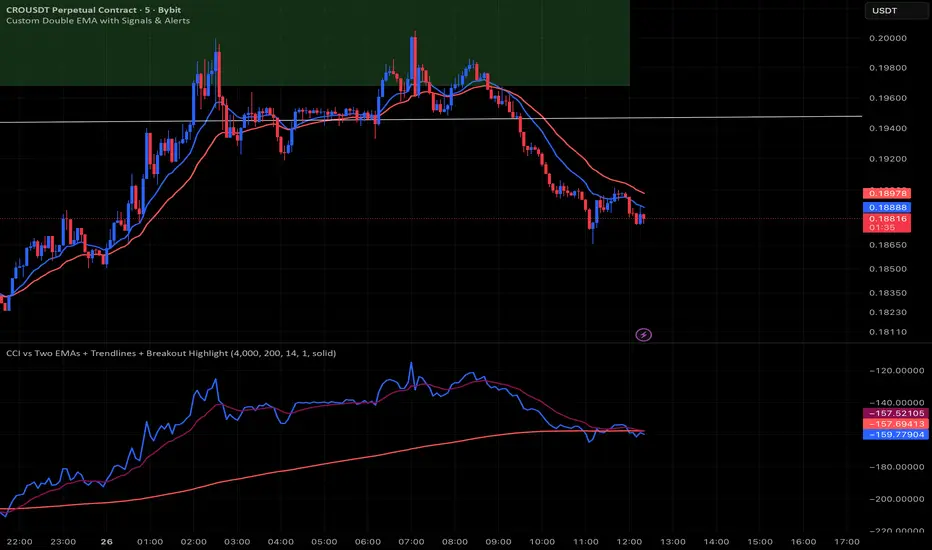
Painel Tendência Multi-TF (EMA Customizável)📊 Multi-Timeframe Trend Panel (Customizable EMA)
This indicator was designed for traders who need clarity and agility when analyzing trends across multiple timeframes.
It provides a quick overview of the relationship between two customizable EMAs and helps spot potential entry or exit points.
✨ Features:
✅ Multi-Timeframe Panel: Instantly check if the short EMA is above (bullish) or below (bearish) the long EMA across different timeframes (from 1m up to 1W).
✅ Automatic Sound Alerts: Configurable notifications for EMA crossovers on the 1H and 4H timeframes.
✅ Customization: Choose the EMA periods that best match your trading strategy.
✅ Full Control: Enable or disable alerts anytime through the settings panel.
🚨 How to use:
Add the indicator to your chart.
Set the EMA periods according to your strategy (default: 9 and 21).
Enable sound alerts for EMA crossovers on 1H and/or 4H as needed.
Create an alert in TradingView (Alerts menu) → select this indicator → choose the condition → receive real-time notifications.
🎯 Benefits:
Clear panoramic view of several timeframes in one panel.
Automatic alerts on key timeframes for trend confirmation.
Saves time: no need to manually switch between charts.
📌 Important Note:
This indicator is not financial advice. It is a tool to support your technical analysis. Always combine it with your own strategy and risk management.

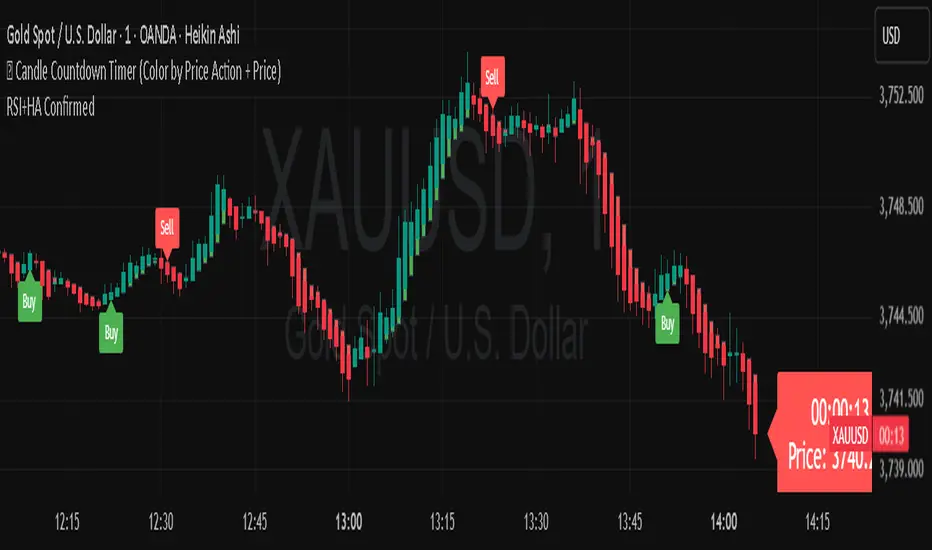
TOP-RSI Double Confirm + Heiken Ashi + Buy/Sell Labels v01📊 RSI Double Confirm + Heiken Ashi + Labels
🔎 Concept
This indicator combines a Zero-based RSI filter with strict candle close confirmation, overlays Heiken Ashi candles for clearer trend visualization, and adds Buy/Sell labels directly on the chart for easier interpretation.
⚙️ Components
1. RSI Double Confirm
RSI is calculated from OHLC4 (open+high+low+close)/4.
The RSI value is shifted by -50 to center it around zero (above 0 = bullish, below 0 = bearish).
Uses user-defined thresholds: Overbought (OB) and Oversold (OS).
📌 Entry conditions:
Buy Signal → RSI crosses upward through OS and the last closed candle is higher than the previous candle.
Sell Signal → RSI crosses downward through OB and the last closed candle is lower than the previous candle.
2. Heiken Ashi Candles
Custom Heiken Ashi values are calculated: haOpen, haClose, haHigh, haLow.
Candles are colored green (if haClose > haOpen) or red (if haClose < haOpen).
Helps smooth price action and highlight trend direction.
3. Alerts
alertcondition is set for both Buy and Sell signals.
Users can create TradingView alerts that trigger whenever a new signal appears.
4. Signals & Labels
A green up arrow is plotted under the candle when a Buy signal is triggered.
A red down arrow is plotted above the candle when a Sell signal is triggered.
Additionally, labels ("Buy" or "Sell") are added at the respective candle to make signals more visible.
📝 How to Use
Add the indicator to your chart (it overlays directly on price).
Adjust inputs:
OB (Overbought) → e.g. 20
OS (Oversold) → e.g. -20
RSI Length → e.g. 7
Watch for signals:
Buy Signal → Green arrow + "Buy" label → potential bullish entry.
Sell Signal → Red arrow + "Sell" label → potential bearish entry.
Set up alerts in TradingView to be notified when new signals appear.
✅ Benefits
Combines RSI confirmation + Heiken Ashi trend filter + Clear chart labels.
Reduces false signals by requiring both RSI cross and strict close confirmation.
Easy to interpret visually with arrows and text labels.
⚠️ Notes
This indicator is meant as a signal confirmation tool, not a standalone strategy.
Best used alongside support/resistance analysis, price action, or volume.
Does not provide automatic stop loss / take profit levels → risk management must be applied by the trader.


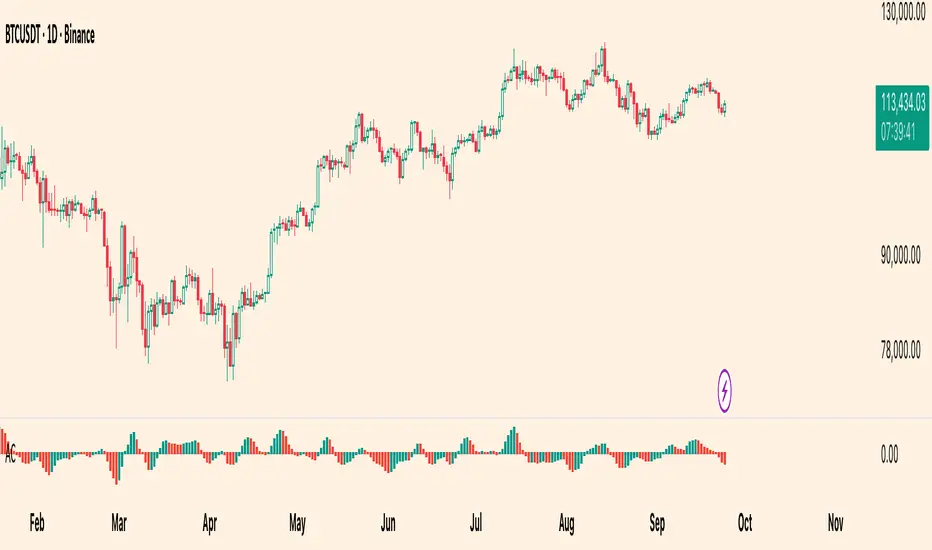
Williams Accelerator Oscillator — ACWhat it is
The Accelerator Oscillator (AC) measures the acceleration/deceleration of momentum. It’s derived from the Awesome Oscillator (AO) and shows whether momentum is speeding up or slowing down. In this implementation, columns are green when AC rises vs. the previous bar and red when it falls.
How it’s calculated
Price source: Median Price (HL2) by default; Close can be used instead.
AO = SMA(HL2, fastLen) − SMA(HL2, slowLen) (defaults: 5 & 34).
AC = AO − SMA(AO, signalLen) (default: 5).
Coloring: Green if AC > AC , else Red.
Zero line (optional) helps contextualize acceleration around neutral.
How to read it (typical interpretation)
Above 0: Upside acceleration (bullish pressure increasing).
Below 0: Downside acceleration (bearish pressure increasing).
Color sequences: Consecutive green columns suggest increasing upside acceleration; consecutive red columns suggest increasing downside acceleration.
Note: AC reflects change in momentum, not trend direction by itself. Many traders confirm with trend filters or price structure before acting.
Inputs
AO Fast SMA (default 5)
AO Slow SMA (default 34)
AC Signal SMA (default 5) — smoothing for the AO used in AC calc
Use Median Price (HL2) for AO (on/off)
Show zero line (on/off)
Show AO (for reference) (on/off)
Show AC signal (SMA of AO) (on/off)
Plots
AC Histogram — column chart colored by acceleration (green/red).
Zero — optional baseline at 0.
AO — optional reference line.
AO Signal (SMA) — optional smoothing line of AO.
Alerts
AC crosses above 0 — acceleration flips positive.
AC crosses below 0 — acceleration flips negative.
AC green above zero — AC rising and > 0.
AC red below zero — AC falling and < 0.
Usage tips
On lower timeframes, consider a slightly larger signalLen to reduce noise.
Confirm with price action, trend filters, or volatility context.
Values update intrabar; for stricter signals, confirm on bar close.
Limitations
AC is built from moving averages and is therefore lagging relative to raw price.
It is not normalized; behavior can vary by instrument and timeframe.
Do not use in isolation for entries/exits without risk management.
Credits
Concept by Bill Williams. This script is an independent implementation for educational and research purposes.
Disclaimer
No financial advice. Markets involve risk; test thoroughly before live use.
Market Weather CompassMarket Weather Compass: Your At-a-Glance Market Condition Dashboard
Markets move like the weather: sometimes calm, sometimes stormy. This indicator acts as your personal market weather station, providing an intuitive, at-a-glance view of current conditions across major markets. Instead of juggling dozens of charts, you can instantly assess risk and identify opportunities with a single, easy-to-read tool.
Key Features
Multi-Market Analysis: Automatically detects and evaluates conditions for US Stocks (NYSE, NASDAQ), Korean Stocks (KRX), and the Crypto market.
Composite Weather Score: Synthesizes complex data from key economic drivers—VIX (volatility), DXY (dollar index), US10Y (bond yields), and USD/KRW (FX rate)—into a single, smoothed score line on your chart.
Intuitive Dashboard: Displays the current "Weather State" (e.g., Sunny, Cloudy, Risk), a corresponding strategy, and real-time values of key indicators in a clean table at the bottom-right of your chart.
Crypto-Specific States: For crypto markets, it identifies unique conditions like "Alt Season" or "Bitcoin Bull" by analyzing total market cap and Bitcoin dominance (BTC.D) trends.
Intelligent Alert System: Provides timely, configurable alerts for significant changes, including weather state shifts, index spikes/crashes, volatility surges, and trend changes in key drivers.
Bilingual Support: Fully localized interface with a simple language toggle (English/Korean) in the settings.
How to Use
Load the Indicator: Add the "Market Weather Compass" to your TradingView chart.
💡 Important: The indicator auto-detects the market (US, KR, Crypto) based on the current chart. To receive alerts for a specific market, you must apply the indicator to a chart of a ticker from that market (e.g., AAPL for US stocks, BTCUSDT for crypto).
Configure Settings:
In the indicator settings, choose your preferred Language.
Enable or disable the Dashboard and Alerts for each market type as needed.
Fine-tune thresholds for alerts and criteria for the weather score to match your trading style.
Interpret the Visuals:
Dashboard: Use the dashboard for a quick summary of the current market state, index performance, and key metric trends (indicated by 🔺 or 🔻).
Weather Score Line: Follow the main score line in the indicator pane. A rising line indicates improving conditions (moving toward green), while a falling line suggests worsening conditions (moving toward red). The zero-line acts as a neutral baseline.
Detailed Alerts Guide
This indicator acts as your personal market radar. You can configure alerts for the following key events:
Market Weather Change: Get notified instantly when the overall market condition shifts (e.g., from Sunny to Cloudy or Risk).
Index Volatility: Receive alerts for sudden market spikes or drops based on your custom percentage threshold for the main index (e.g., Nasdaq futures, KOSPI).
Volatility Index Trends : Alerts for when the VIX (for US) or VKOSPI (for KR) begins a new rising or falling trend, signaling shifts in market sentiment.
Currency & Bond Yields: Notifications when the Dollar Index (DXY) or USD/KRW exchange rate breaks key trends, or when the US 10-Year Treasury Yield (US10Y) crosses into a risk zone.
Crypto Market Dynamics: Specific alerts for the start of an "Alt Season," a shift in Bitcoin dominance, or changes in the ETH/BTC trend.
Example Strategies
The indicator's output is not a signal, but a guide to inform your strategy.
Weather = Sunny → Conditions are favorable. Consider focusing on strong sectors or scaling into positions.
Weather = Risk → Conditions are unfavorable. Consider reducing exposure, taking profits, or increasing cash positions.
Crypto = Alt Season → Broad market rally. Capital may be flowing from majors to altcoins.
Crypto = Bitcoin Bull → Bitcoin is leading the market. Altcoins may underperform.
Disclaimer
This indicator is a tool for market analysis and should not be considered financial advice. It provides a simplified model of complex market dynamics. All trading and investment decisions involve risk, and you are solely responsible for your own choices. Always conduct your own thorough research before entering a trade. Past performance is not indicative of future results.
Final Note
Investing is a constant balance between risk and opportunity. The Market Weather Compass aims to make that balance as clear and intuitive as a daily weather forecast. Next time you open a chart, let this compass be your guide.

Volume Profile Bar-Magnified Order Blocks [JacobMagleby]djfkudfudgfdsfhdcjdgcgbkdcjbfsdhgfhgignhdghklgdlgdkgnhdghnfjknvlskvmjldkvmjlkfgmjlfgvjljm

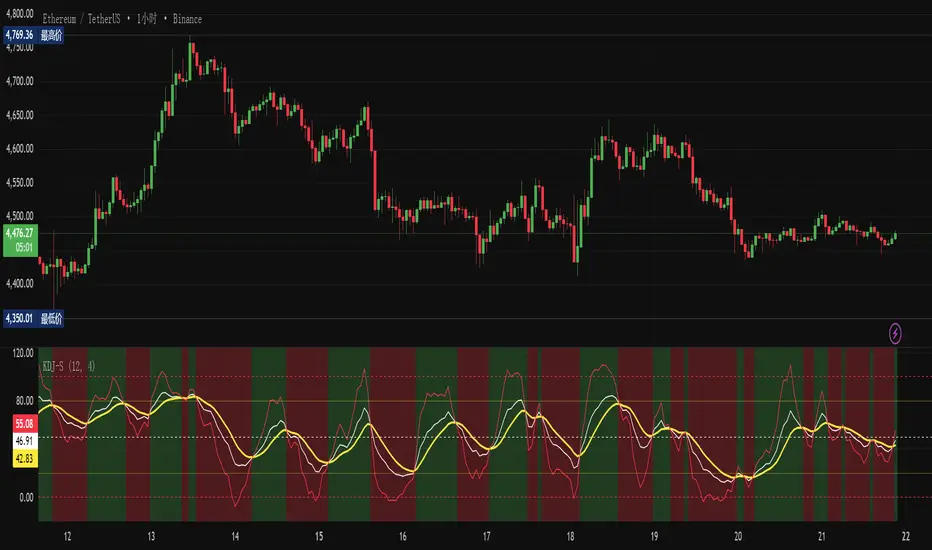
CuteWilly Oscillator_SKThis is a potent combination of Williams % R , EMA & SMA on Williams % R alongwith input from RSI as well. Gives very good picture of the trend, trend reversal and strength of the trend as well.

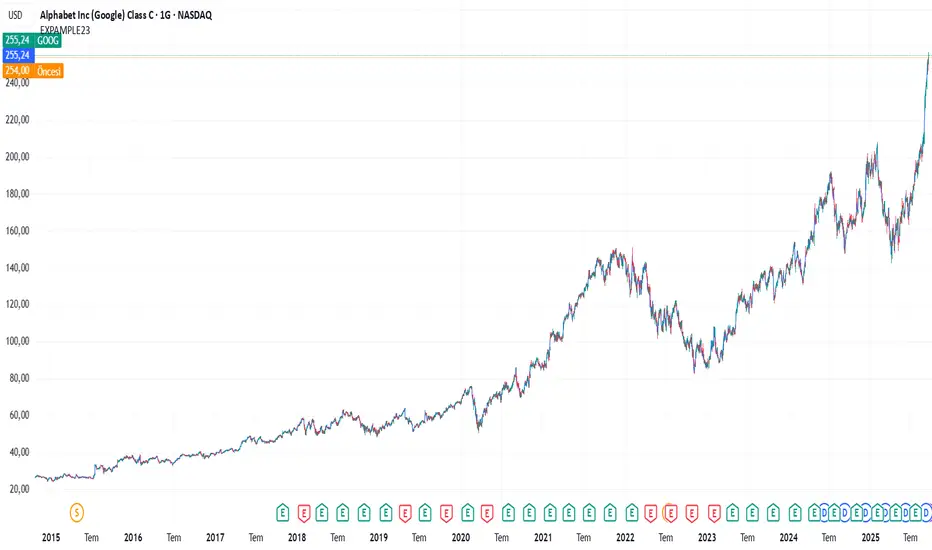
Financial Success Indicator Financial Success Indicator (Guiding with Fundamental Analysis from Macro to Micro)

Finansal Başarı Göstergesi Finansal Başarı Göstergesi (Makro'dan Mikro'ya Temel Analizlerle Yol Gösterici)

Phato Candle ProjectionsPhato Candle ProjectionsPhato Candle ProjectionsPhato Candle ProjectionsPhato Candle ProjectionsPhato Candle ProjectionsPhato Candle ProjectionsPhato Candle ProjectionsPhato Candle ProjectionsPhato Candle Projections

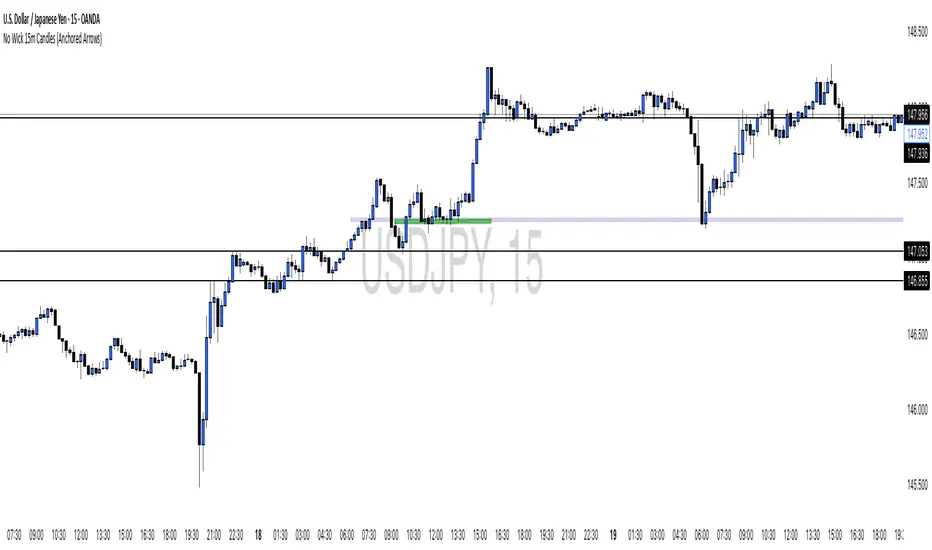
No Wick 15m Candles (Anchored Arrows)defined upArrow and downArrow as series values (high or low when conditions are true, otherwise na).
Passed those to plotshape().
This way the arrows are anchored exactly on the candle high/low.

Custom indictrbuy sell idicator inal output is the EMA Index, which is a smoothed exponential moving average of the Raw Demand Index. This EMA acts as the primary signal line, providing a clearer, less noisy reading that is easier to interpret.
DTrend & Volume Strong BUY Signal: Look for a green WMA, combined with a green circle and a blue triangle.

FU + SMI Validator (Proper FU, 30m)Overview
The FU + SMI Validator is a sophisticated technical analysis indicator designed to detect Proper FU (Fakeouts or Liquidity Sweeps) on the 30-minute timeframe. This tool aims to help traders identify high-probability reversal setups that occur when price briefly breaks key levels (sweeping liquidity), then reverses with momentum confirmation.
Fakeouts are common market events where price action “hunts stops” before reversing direction. Correctly identifying these events can offer excellent entry points with defined risk. This indicator combines price action logic with momentum and volatility filters to provide reliable signals.
Core Concepts
Proper FU (Fakeout) Detection
At its core, the script identifies proper fakeouts by checking if the current bar’s price:
For bullish fakeouts: dips below the previous bar’s low (sweeping stops) and then closes above the previous bar’s high
For bearish fakeouts: spikes above the previous bar’s high and then closes below the previous bar’s low
This ensures that the breakout is a true sweep rather than just a one-sided close.
Optionally, the script can require one additional confirmation bar after the FU, ensuring that the momentum is sustained and reducing false signals.
SMI-style Momentum Validation
To improve the quality of signals, the indicator uses a proxy for the Stochastic Momentum Index (SMI) by calculating the difference between current and past linear regression slopes of price. This momentum check helps ensure that fakeouts occur alongside actual directional strength.
Key points:
Momentum must be increasing in the direction of the FU signal.
Momentum filters can be enabled or disabled based on user preference.
Squeeze Condition to Avoid Low-Volatility Traps
The script includes a volatility filter based on a squeeze-like condition:
It compares Bollinger Bands (BB) and Keltner Channels (KC).
When BB bands contract inside KC bands, the market is in a squeeze state, signaling low volatility.
Fakeouts during squeeze conditions are often unreliable; the script can filter these out to reduce false alarms.
Killzone Session Timing Filter
Recognizing that liquidity and volatility vary by session, this tool supports optional filtering for:
London Killzone: 09:00 to 10:30 (UK time)
New York Killzone: 13:00 to 14:30 (UK time)
Signals only trigger during these high-activity windows if enabled, helping traders focus on periods with the best liquidity and market participation.
Note: For Killzone filtering to work accurately, your TradingView chart must be set to the UK timezone.
Features & Benefits
Robust FU detection ensures the breakout price action is meaningful, reducing noise.
Momentum filter via linear regression slope captures trend strength in a smooth, mathematically sound way.
Low-volatility squeeze avoidance helps reduce false signals in choppy or range-bound markets.
Killzone timing filter focuses your attention on the most liquid and active market hours.
Optional confirmation bar increases signal reliability.
Raw FU markers allow visualization of all detected fakeouts for pattern recognition and manual analysis.
Alerts built-in for both valid buy and sell FU setups, enabling real-time notification and quicker decision-making.
Customization Options
Killzone usage: Enable or disable the session timing filter.
Sessions: Configure London and New York killzone time ranges.
Momentum alignment: Enable or disable momentum filter based on SMI proxy.
Volatility filter: Avoid signals during squeeze or low-volatility conditions.
FU confirmation: Option to require one additional confirming candle after the initial FU.
Squeeze and momentum parameters: Adjust Bollinger Bands length and multiplier, Keltner Channel length and ATR multiplier.
Raw FU markers: Show or hide all detected fakeouts regardless of filters.
How to Use This Indicator
Apply to 30-minute charts for forex pairs, indices, cryptocurrencies, or other instruments.
Set your chart timezone to UK time if using Killzone filters.
Adjust input parameters based on your preferred sessions and risk tolerance.
Look for green “VALID BUY FU” labels below bars for bullish fakeout entries.
Look for red “VALID SELL FU” labels above bars for bearish fakeout entries.
Use the alert system to receive notifications on setups.
Combine with your existing analysis or risk management strategy for entries, stops, and profit targets.
Why Use FU + SMI Validator?
Fakeouts are some of the most lucrative but tricky setups for many traders. Without proper filters, they can lead to false entries and losses. This script integrates price action, momentum, volatility, and session timing into one package, providing a robust tool to spot high-quality fakeout opportunities and improve trading confidence.
Limitations
Requires chart to be set to UK timezone for session filters.
Designed specifically for 30-minute timeframe — performance on other timeframes may vary.
Momentum is a proxy, not a direct SMI calculation.
Like all indicators, best used in conjunction with sound risk management and other analysis tools.
Potential Enhancements
Conversion into a full strategy script for backtesting entries and exits.
Addition of other momentum indicators (RSI, MACD) or volume filters.
Customizable time zones or auto time zone detection.
Multi-timeframe analysis capabilities.
Visual dashboard for summary of signal stats.

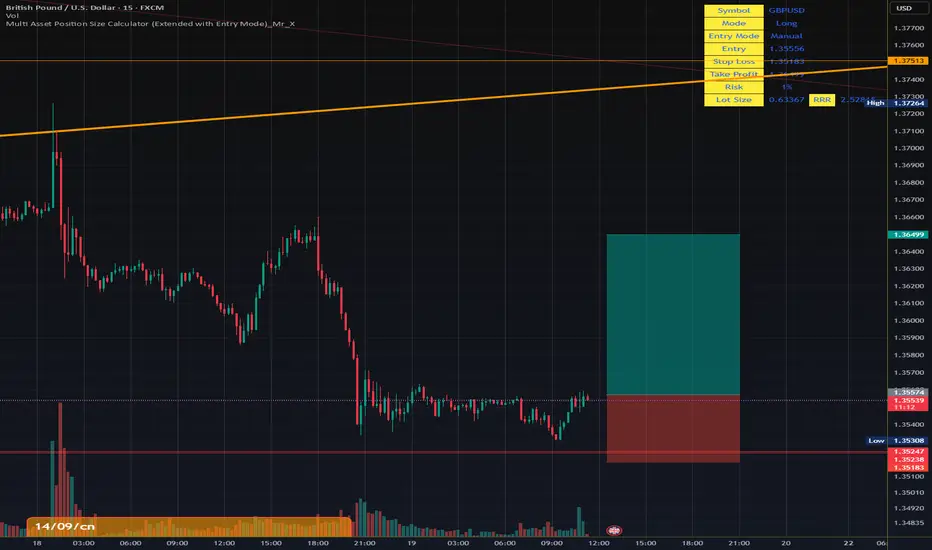
Multi Asset Position Size Calculator Multi Asset Position Size Calculator (Extended with Entry Mode)_Mr_X