Black-Scholes Model and Greeks for European OptionsThe Black-Scholes model is a mathematical model used for pricing options. From this model you can derive the theoretical fair value of a European option (an option where you have to wait until expiry to exercise). Additionally, you can derive various risk parameters called Greeks. This indicator includes three types of data: Theoretical Option Price (blue), the Greeks (green), and implied volatility (red); their values are presented in that order.
1) Theoretical Option Price:
This first value gives only the theoretical fair value of an option with a given strike based on the Black-Scholes framework. Remember this is a model and does not reflect actual option prices, just the theoretical price based on the Black-Scholes model and its parameters and assumptions.
2)Greeks (all of the Greeks included in this indicator are listed below):
a)Delta is the rate of change of the theoretical option price with respect to the change in the underlying's price. This can also be used to approximate the probability of your option expiring in the money. For example, if you have an option with a delta of 0.62, then it has about a 62% chance of expiring in-the-money. This number runs from 0 to 1 for Calls, and 0 to -1 for Puts.
b)Gamma is the rate of change of delta with respect to the change in the underlying's price.
c)Theta, aka "time decay", is the rate of change in the theoretical option price with respect to the change in time. Theta tells you how much an option will lose its value day by day.
d)Vega is the rate of change in the theoretical option price with respect to change in implied volatility.
e)Rho is the rate of change in the theoretical option price with respect to change in the risk-free rate. Rho is rarely used because it is the parameter that options are least effected by, it is more useful for longer term options, like LEAPs.
f)Vanna is the sensitivity of delta to changes in implied volatility. Vanna is useful for checking the effectiveness of delta-hedged and vega-hedged portfolios.
g)Charm, aka "delta decay", is the instantaneous rate of change of delta over time. Charm is useful for monitoring delta-hedged positions.
h)Vomma measures the sensitivity of vega to changes in implied volatility.
i)Veta measures the rate of change in vega with respect to time.
j)Vera measures the rate of change of rho with respect to implied volatility.
k)Speed measures the rate of change in gamma with respect to changes in the underlying's price. Speed can be used when evaluating delta-hedged and gamma hedged portfolios.
l)Zomma measures the rate of change in gamma with respect to changes in implied volatility. Zomma can be used to evaluate the effectiveness of a gamma-hedged portfolio.
m)Color, aka "gamma decay", measures the rate of change of gamma over time. This can also be used to evaluate the effectiveness of a gamma-hedged portfolio.
n)Ultima measures the rate of change in vomma with respect to implied volatility.
o)Probability of Touch, is not a Greek, but a metric that I included, which tells you the probability of price touching your strike price before expiry.
3) Implied Volatility:
This is the market's forecast of future volatility. Implied volatility is directionless, it cannot be used to forecast future direction. All it tells you is the forecast for future volatility.
How to use this indicator:
1st. Input the strike price of your option. If you input a strike that is more than 3 standard deviations away from the current price, the model will return a value of n/a.
2nd. Input the current risk-free rate.(Including this is optional, because the risk-free rate is so small, you can just leave this number at zero.)
3rd. Input the time until expiry. You can enter this in terms of days, hours, and minutes.
4th.Input the chart time frame you are using in terms of minutes. For example if you're using the 1min time frame input 1, 4 hr time frame input 480, daily time frame input 1440, etc.
5th. Pick what type of option you want data for, Long Call or Long Put.
6th. Finally, pick which Greek you want displayed from the drop-down list.
*Remember the Option price presented, and the Greeks presented, are theoretical in nature, and not based upon actual option prices. Also, remember the Black-Scholes model is just a model based upon various parameters, it is not an actual representation of reality, only a theoretical one.
Binaryoptions

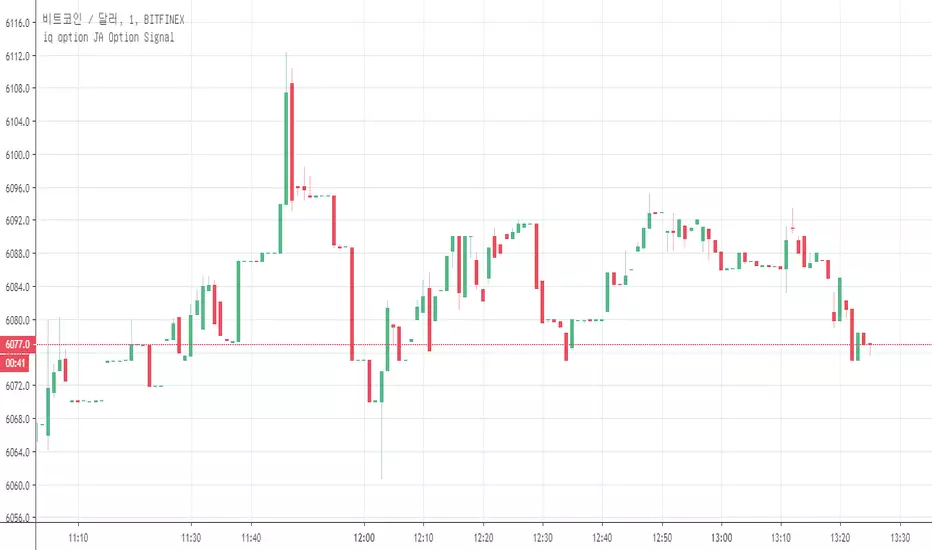
yutas_BOindicator_β1_simpleVer.1.0
・High-low sign indicator for binary option only. (β_simple version)
・Signs are displayed where repulsion is likely to occur on special oscillators.
・You can expect a rebound in the next candle after you sign.
・The filter can be in a certain numerical range.
・We recommend cross-yen for currency pairs.
・バイナリーオプション専用ハイローサインインジケーター。 (ベータシンプルバージョン)
・特殊なオシレーターでの反発しやすい所にサインを表示します。
・サインが出た次のローソクでの反発が期待できます。
・フィルターとして一定数値範囲内という条件も可能。
・通貨ペアはクロス円がオススメです。

L&S PROFIT SCALP Indicator for scalp trades for TF 1-15 minutes. 1-4 signals per day depending on the currency pair. Suitable for all crypto exchanges, Forex, binary options. Signals+ take profit Levels.

10X Trading System10X Trading System (Non Repaint)
TradingView Account Needed: Free
Not satisfied with your trading results so far? This may help:
The 10X Trading System helps you identify tops, bottoms and market direction — quickly and accurately.
The strategy behind its accuracy is the fact that it combines price action and multiple market timing algorithms to determine these significant turning points in the markets.
That way, you can be sure you have the best chance to get the best entry and exit points with perfect timing, and hopefully extract more profits from the markets than anybody else.
Once the 10X Trading system has spotted a possible top or bottom, it clearly displays these Buy or Sell alerts on your charts… showing you exactly where this may occur.
You can activate alerts to never miss a signal.
How to use the signals and alerts:
10X Trading System automatically analyze price action and multiple market timing algorithms to give you a signal when there's a good trade.
Works on all markets on all time frames so it's suitable for binary, scalping, day and swing trading.
10X Trading System allow you to get the best entry and exit points with perfect timing.
If you want more details, the link is in the signature.
Disclaimer:
Past performance is not indicative of future performance. No representation is being made that any results discussed within the service and its related media content will be achieved. All opinions, news, research, analyses, prices or other information is provided as general market commentary and not as investment advice. TradingWalk, their members, shareholders, employees, agents, representatives and resellers do not warrant the completeness, accuracy or timeliness of the information supplied, and they shall not be liable for any loss or damages, consequential or otherwise, which may arise from the use or reliance of the TradingWalk service and its content. © 2019 TradingWalk.
TradingWalk indicators are built for TradingView. TradingWalk is on no way a part of TradingView.
Trend Pulse Pro V2Trend Pulse Pro V2 (Non Repaint)
TradingView Account Needed: Free
You don't need to be an expert to use Trend Pulse Pro.
Just follow the signals and that's all and use simple Fibonacci levels to find stop loss and take profit!
You can increase the win rate even more by following some simple technical analysis, for example, when trend breaks (price break signal level) you can use that as support become resistance level (sell) or resistance becomes support (buy):
No complex things. No waste of time.
And although you won't win 100% of the trades (no signals can guarantee that), your trading will surely improve a lot!
Even someone with almost no trading experience can read the simple trading rules given in the included user guide, watch the how-to videos and follow Trend Pulse Pro’s signals to consistently make smarter trades.
With Trend Pulse Pro you will get accurate buy and sell signals every time there is a new trading opportunity so that you never miss any big price movements and makes your trading both easier and more profitable.
How to use the signals and alerts:
Trend Pulse Pro automatically analyze trend and price action to give you a signal when there's a good trade.
These trend signals and alerts are derived from live data but the stability of our code allows it to not repaint.
Trend Pulse Pro allow you to easily determine the trend and will give you buy and sell entry levels.
Works on all markets on all time frames so it's suitable for scalpers, day and swing traders.
If you want more details, the link is in the signature.
Disclaimer:
Past performance is not indicative of future performance. No representation is being made that any results discussed within the service and its related media content will be achieved. All opinions, news, research, analyses, prices or other information is provided as general market commentary and not as investment advice. TradingWalk, their members, shareholders, employees, agents, representatives and resellers do not warrant the completeness, accuracy or timeliness of the information supplied, and they shall not be liable for any loss or damages, consequential or otherwise, which may arise from the use or reliance of the TradingWalk service and its content. © 2019 TradingWalk.
TradingWalk indicators are built for TradingView. TradingWalk is on no way a part of TradingView.

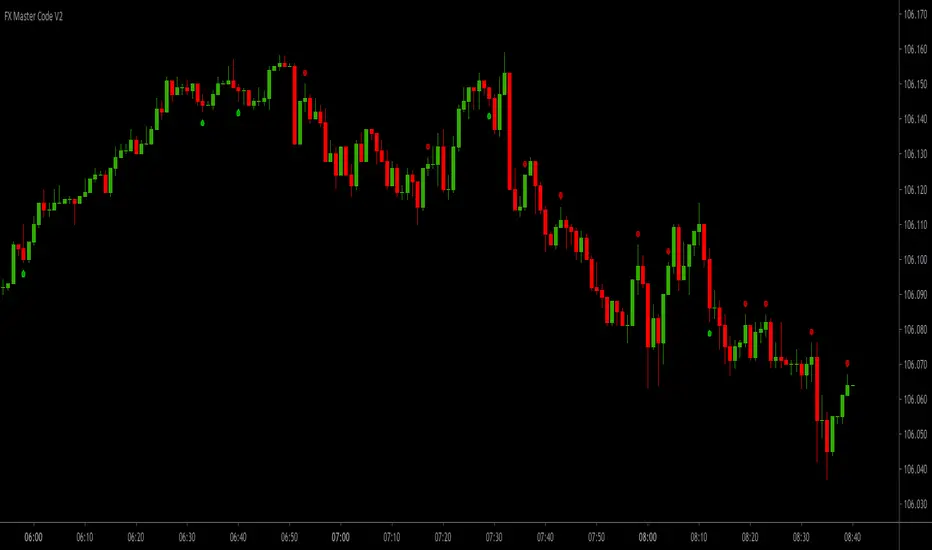
FX Master Code V2FX Master Code V2 (Non Repaint)
TradingView Account Needed: Free
Are you making the making the kind of results you want from trading right now?
Well, if the answer's no, then read this!
Even if you're a complete beginner in trading or an experienced trader, you can use these signals and alerts to start making great results.
The main goal of trading the 1-minute time frame is to make a profit through buying or selling currency pairs by holding a position for a very short period of time, and closing it for a profit.
FX Master Code will give you signals based on my proven and profitable 1-minute trading strategy.
You should be aware that this strategy will demand a certain amount of time and concentration. If you are not able to dedicate at least one hour a day to trade this strategy, then trading the 1-minute chart might not be the best strategy for you.
This is a day trading strategy suitable scalpers and binary options traders, as it involves opening a buy or sell position, gaining a few pips, and then closing the position 3 candlesticks after the signal (3 minute expiration time for binary options).
The exiting aspect of this is quantity. It is not unusual for traders to place more than +10 trades a day (and the more trades you place, the higher returns you can make).
Why not try FX Master Code and see if this system works for you?
The essence of the system will not allow for high losses. We will help you with risk management, use the best-practice risk and trade management for successful trading we give you with FX Master Code.
FX Master Code can be an extremely effective and profitable strategy – even for those who are beginners or use it purely as a supplementary strategy.
What is even better, using this strategy you are rewarded for quantitative work – the more trading you perform, the higher returns you can make.
If you want more details, the link is in the signature.
Disclaimer:
Past performance is not indicative of future performance. No representation is being made that any results discussed within the service and its related media content will be achieved. All opinions, news, research, analyses, prices or other information is provided as general market commentary and not as investment advice. TradingWalk, their members, shareholders, employees, agents, representatives and resellers do not warrant the completeness, accuracy or timeliness of the information supplied, and they shall not be liable for any loss or damages, consequential or otherwise, which may arise from the use or reliance of the TradingWalk service and its content. © 2019 TradingWalk.
TradingWalk indicators are built for TradingView. TradingWalk is on no way a part of TradingView.
Binary Options Arrows (example)An example of Binary Option Arrows (BOA) for candlestick patterns bearish and bullish harami.
With results as coloured background and an option to choose your expiration (one candle by default).
It's just an example for those who has their own strategy and wants to make nice arrows in their chart.
All you need to do is rewrite piece of script in lines 9:13 - feel free to ask me for any help.
Disclaimer: It's just an example how to script arrows for binary option trading, Poshtrader is not responsible for any loss of money by using this particular strategy.
Happy Trading

TradingView's Technical AnalysisAll indicators used on the Technical Analysis Summary from TradingView, composed with oscillators and moving averages. Sell and strong sell will represent more indicators showing sell signals. Buy and strong buy will represent more indicators showing buy signals. A white bar will show neutral signal (don't trade). This can be good for binary options or scalping on small time frames, but also very good on higher times for forex. The signal will appear on the candle before, so wait for the new candle to appear to see what direction the signal will indicate.

Acmillions88 Binary Prediction 1For those who followed me, I have good news for you.
I went into binary options.
The key to binary options is to predict the next candle,
here's a script with high success rate.
Tested on EURUSD 1min.
When the green or red line didn't touch any candle body for a period of time,
then it touches a candle's body.
If the candle is green, a red one is coming soon,
most likely is the next one.
If the candle is red, a green one is coming soon,
most likely is the next one.
Important to note that when the line crosses the body of the candle, it has to be slanted,
meaning the line has to be going up or down.
Please don't ask me why and how it works. Its a secret.
Cheers.

Implied Volatility Rank & Model-Free IVRThis is an update to my previous IV Rank & IV Percentile Script.
I originally made this script for binary/digital options, but this also can be used for vanilla options too.
There are two lines on this script, one plotting Model-Based IV rank and Model-Free IV Rank.
How it works:
Model-Based IV Rank:
1. Take whatever timeframe you're using and multiply it by 252. This is done because typically IV is calculated over a year, which has 252 days. But this can be used for any timeframe, so just multiply you're timeframe by 252. In the picture above I'm using a 30 min chart, so I multiplied 30 min by 252 and got 7 days, 14 hrs , and 30 min.
2. Next input the result you got from step 1 into the corresponding input boxes.
3. Then input the timeframe you are using into the input box labeled timeframe. I'm using 30 min so I put 30.
4.Finally choose the delta that you want to use and input its standard deviation into the input box. There is a list of common deltas and their corresponding standard deviations in the menu so you don't have to go looking them up. Typically 16D or 1 standard deviation is used when calculating IV, but you can choose whichever one you want.
*FYI. For people trading binary/digital options, the delta of a vanilla option is the same as the price of a binary/digital option. This is because the delta is the first-order mathematical derivative of the vanilla option's price, and a binary/digital option is a mathematical derivative of a vanilla option. So when you see the list of deltas and their corresponding standard deviations values, just know that 40D=$40 binary, 30D=$30 binary, 20D=$20 binary, and so on. But again typically the 16D or $16 binary's standard deviation value would be used*
This calculation of IV rank is useful for vanilla option traders who use Tradingview and don't have access to this metric.
This calculation of IV rank is useful for binary/digital option traders using Tradingview because the only two regulated binary options exchanges: the CBOE and Nadex, do not offer advanced options data, such as IV rank. On the CBOE and Nadex only the market-makers have this data, which they get from their own in-house pricing models. So at least now any binary option traders can have the same data as the market makers that they are trading against. Also if your wondering how accurate my pricing model is; just know that I have have compared the prices given by the pricing model to realtime prices on Nadex (live account) and the prices that my model shows for differing strike prices matches the prices that the market-makers set. So the pricing model, upon which this IV rank is based, is accurate.*
Model-Free IV Rank:
This IV Rank is based off the VixFix and just ranks the VixFix's values over the past 252 periods. In the menu you can see the recommended periods for calculating the VixFix, with 22 being the one most people use. This is the exact same methodology used in my original IV Rank script.
Which should you use?
This is up to you and each have their own pros and cons.
The main pro of using the model-free version is that because it does not rely on a pricing model, it does not take as many steps to calculate IV and therefore can update its IV projections much quicker than the model based approach. This is why if you zoom out the model-free version will have a more choppy appearance than the model based.
The main pro of using the model based version is that this is what the overwhelming majority of options traders use, and can be applied to any option delta you want, while the model-free version only calculates IV rank on the 16D aka $16 binary aka 1 standard deviation strike.


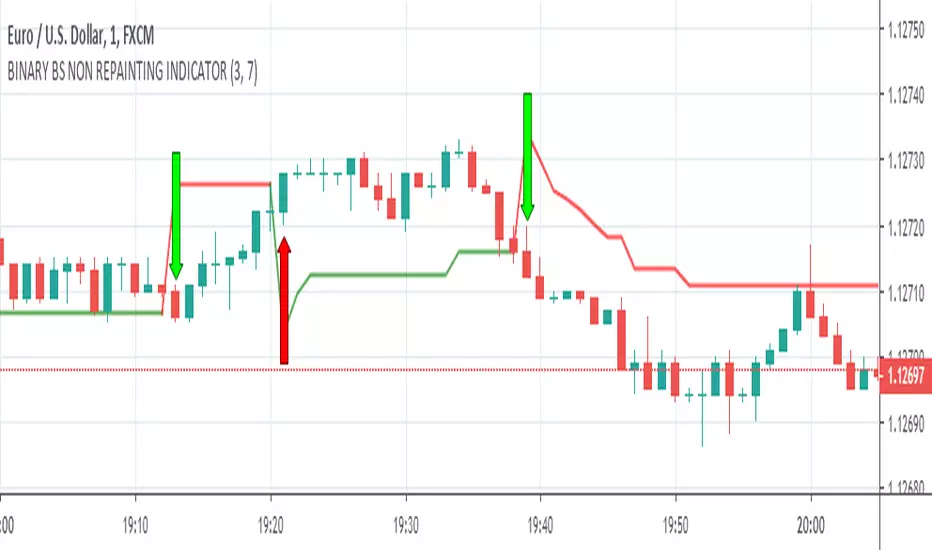
BINARY BS NON REPAINTING INDICATOR
Hello Binary Options traders, do you worry about loss in binary, now no need to worry, search my page in Fb, named "IQ Option Traders PK " ,like my page and send me a message, i will send you details of my strategy free of cost.
or comment below i will respond you.
thanks
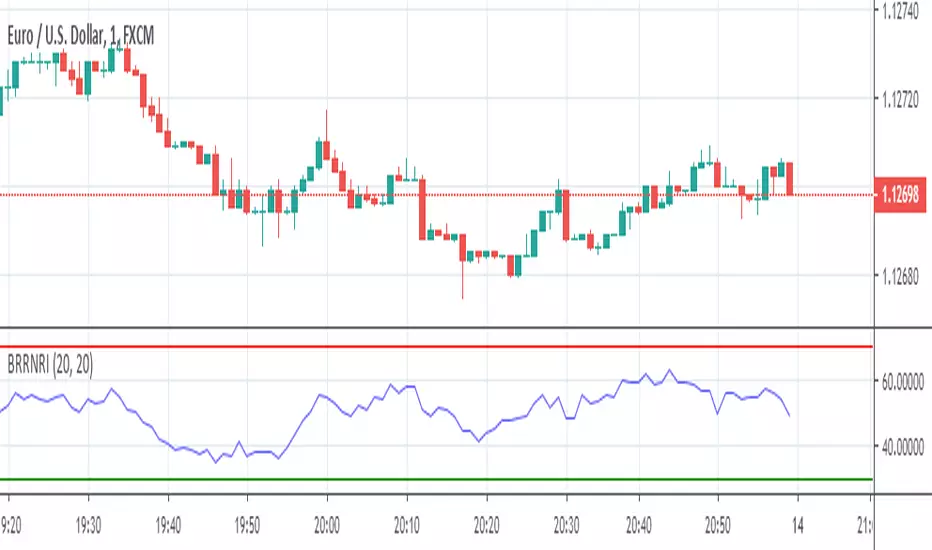
BINARY RR NON REPAINTING INDICATOR
Hello Binary Options traders, do you worry about loss in binary? now no need to worry, search my page in Fb, named "IQ Option Traders PK " ,like my page and send me a message, i will send you details of my strategy free of cost.
or comment below i will respond you.
thanks
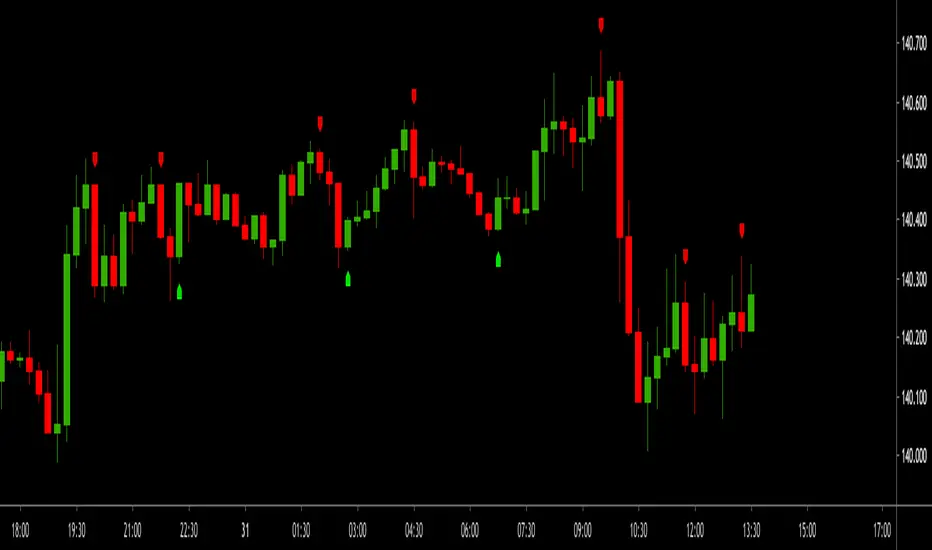
yutas_BOindicator2βVer1.0
High-low sign indicator for binary option only. (β version)
バイナリーオプション専用ハイローサインインジケーター。 (ベータバージョン)

BOSS Bullish/Bearish Quantitative Qualitative Estimation (QQE)THE BEST FOREX, BINARY OPTIONS, AND CRYPTO INDICATORS FOR TRADINGVIEW.COM
This indicator is comprised by a smoothed Relative Strength Index and two trailing levels, based on volatility – Fast Trailing Level (Fast TL – the maroon line on the chart above) and Slow Trailing Level (Slow TL – the blue line on the chart above).
The two are determined by calculating the Average True Range (ATR) of the smoothed RSI during a specified number of periods, after which a further ATR smoothing is applied with the use of an additional n-periods Wilders smoothing function.
Ultimately, the RSI’s smoothed ATR is multiplied by the Fast and Slow ATR Multipliers in order to determine the final Fast and Slow Trailing Levels.
Trading the QQE buy and sell signals:
Buy Signal
Bullish crossover happens when Fast ATR TL crosses above Slow ATR TL. When this occurs a blue circle & blue candle will appear and a alert signal to buy is generated.
Sell Signal
Bearish crossover happens when Slow ATR TL crosses above Fast ATR TL. When this occurs a maroon circle & maroon candle will appear and a alert signal to sell is generated.
Bullish/Bearish Divergence Background
Green background indicates Bullish Divergence
Red background indicates Bearish Divergence
Overbought and Oversold Conditions
An overbought condition occurs, when the QQE is at or above its 0.10 level.
An oversold condition occurs, when the QQE is at or below its -.10 level.

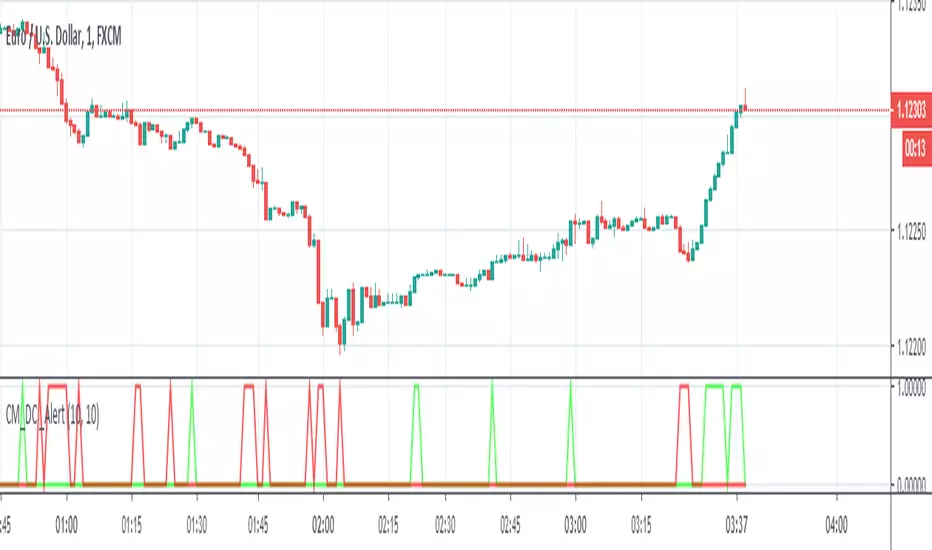
BOSS Zero-Lag Dynamic MACDTHE BEST FOREX, BINARY OPTIONS, AND CRYPTO INDICATORS FOR TRADINGVIEW.COM
Our MACD is a Zero-Lag (well near zero-lag) We make this claim because MACD utilizes Moving Averages and as you know moving averages are lagging indicators.
For our MACD we utilize The McGinley Dynamic which looks like a moving average line yet it is a smoothing mechanism for prices that turns out to track far better than any moving average.
The McGinley Dynamic minimizes price separation, price whipsaws and hugs prices much more closely.
The McGinley Dynamic does this automatically as this is a factor of the formula.
Because of the calculation, the Dynamic Line speeds up in down markets as it follows prices yet moves more slowly in up markets.
As traders we want to be quick to sell in a down market, yet ride an up market as long as possible.
Source: Investopedia.com
Chart Image shows conventional MACD on Bottom and BOSS Zero-Lag Dynamic MACD on top
Available at: bosscripts.com

BOSS EMA Trend MeterTHE BEST FOREX, BINARY OPTIONS, AND CRYPTO INDICATORS FOR TRADINGVIEW.COM
Bullish Uptrend
To determine bullish uptrend there must beat least 2 green squares on all three trend meters. This is a great predictor that a uptrend is imminent.
Bearish Downtrend
To determine bearish downtrend there must beat least 2 red squares on all three trend meters. This is a great predictor that a downtrend is imminent.
For best results use with Boss Bull/Bear Stochastic RSI
If you get a buy signal on Boss Bull/Bear Stochastic RSI and trend meter has a minimum of 2 green squares then this is a great buy/long entry.
If you get a sell signal on Boss Bull/Bear Stochastic RSI and trend meter has a minimum of 2 red squares then this is a great sell/short entry
Available at bosscripts.com
Website bosscripts.com

BOSS Smooth Stochastic Bull/Bear Oscillator With Alerts THE BEST FOREX, BINARY OPTIONS, AND CRYPTO INDICATORS FOR TRADINGVIEW.COM
Short Entry
During a price downtrend and you get a sell signal (red dot) enter short when the "K" line (green line) drops below 65 (mid upper band).
Long Entry
During an uptrend, buy when you get a long signal (green dot) and "D" line (red line) rises above 35 (mid lower band) .
Bull/Bear
Green background indicates bullish price action (uptrend)
Red background indicates bearish price action (downtrend)
Available At bosscripts.com
Website bosscripts.com

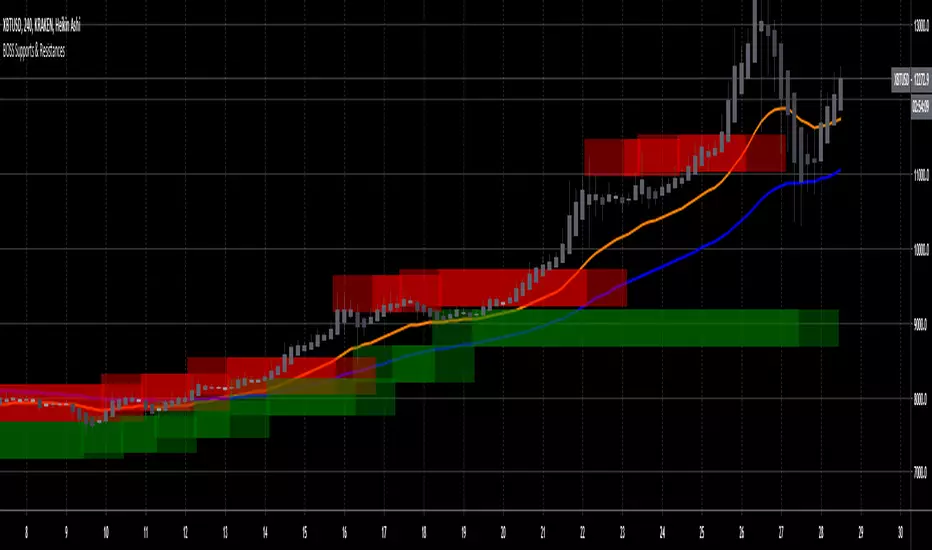
Boss Support and Resistance zonesTHE BEST FOREX, BINARY OPTIONS, AND CRYPTO INDICATORS FOR TRADINGVIEW.COM
Green = Support Zones
Red = Resistance Zones
The basic trading method for using support and resistance is to buy/long near support in uptrends, and to sell/short near resistance in downtrends.
Also included in this indicator are a Higher High, Lower High, Higher Low, and Lower Low indicator as well as Fast and Slow EMA'S
Available at bosscripts.com
Website bosscripts.com
BOSS Automatic TrendlinesTHE BEST FOREX, BINARY OPTIONS, AND CRYPTO INDICATORS FOR TRADINGVIEW.COM
Trendlines when drawn properly make an excellent tool for traders. Used improperly though, they become ineffective and even counterproductive, resulting in a belief that prices have made a reversal when they really haven't, or that a trend has strength when price action suggests it doesn't.
The Boss Auto Trendline Indicator draws the trendlines automatically, and now you can effectively use trendlines as part of your trading strategy.
Trendlines highlight a trend or range (sideways movement). A trendline connects swing lows, where the low is lower than the surrounding prices, and swing highs in price. When the price rises, the swing lows rise.
Red Lines & Dots.
Connecting these lows with a line results in an ascending trendline, showing you that the trend is up. A trendline can also be drawn along the swing highs. This shows the angle of ascent, and the strength of the price move, whether strongly higher or not.
Green Lines & Dots
When the price falls, the swing highs fall. Connecting these highs with a line results in a descending trendline, illustrating the downward trend. A trendline can also be drawn along the swing lows. This shows the angle of descent and the strength of the downward price movement.
Available at bosscripts.com
Website bosscripts.com