Basic Cryptocurrency TerminalHello,
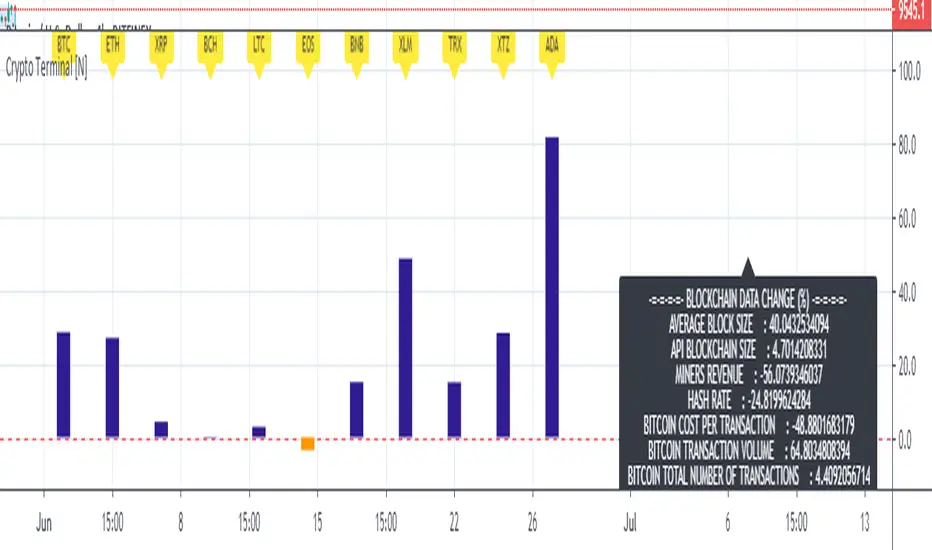
This script is a simple Cryptocurrency Terminal.
It serves the same purpose as Heatmaps.
You can also set the period to look back manually in the menu.
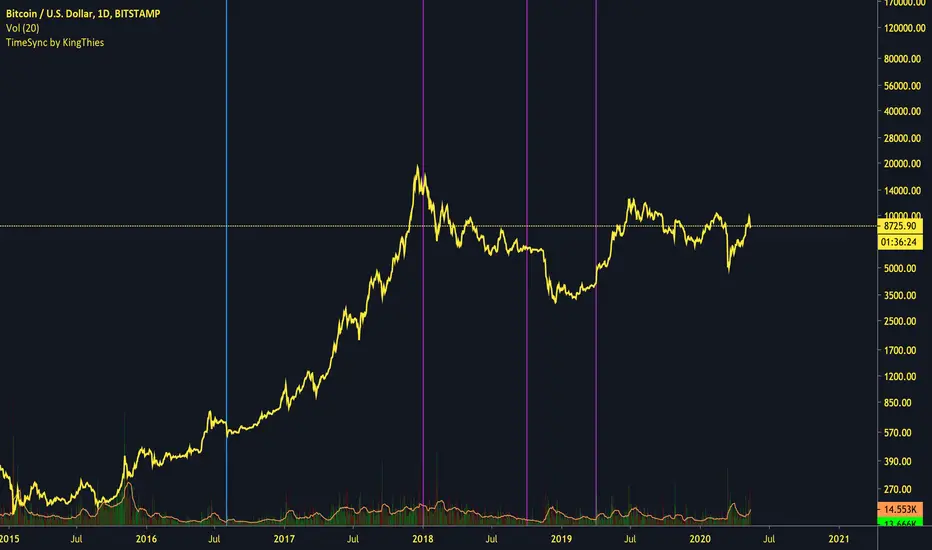
Major Cryptocurrencies are taken into account.
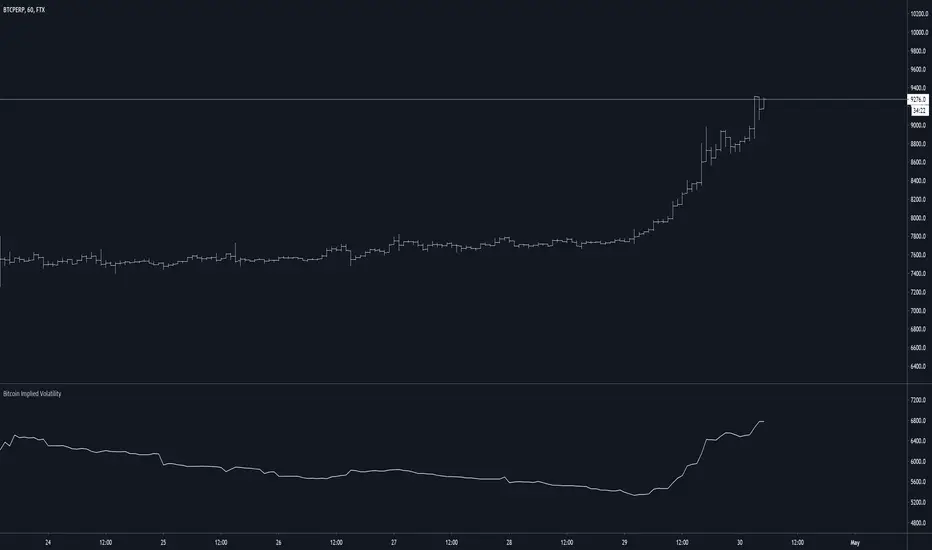
And various Blockchain data are shown in the information panel.
In this way, an idea can be obtained about Cryptocurrency Market.
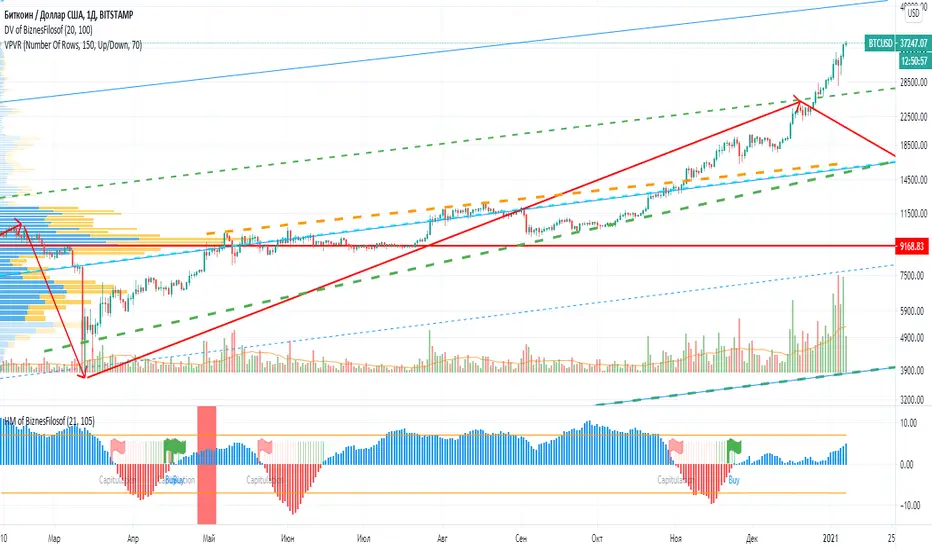
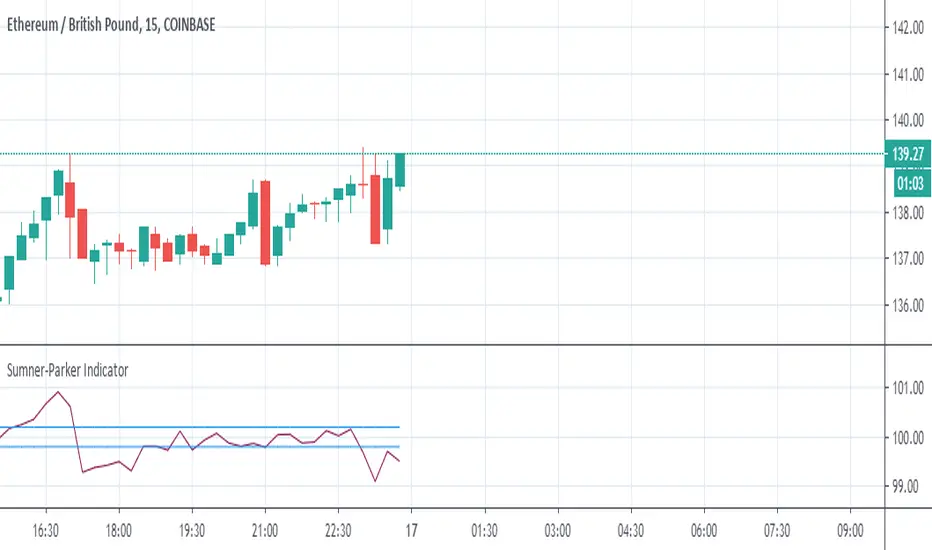
It is visually more convenient and clear to use in an indicator window under the chart, not on the chart, as follows:
Regards.
אינדיקטור Pine Script®