LeoA451: BBW Double Confirmation v.03 (Signal BBW=black(5/5))This script displays BBW from two periods: a signal period (for which I like to use 5 minutes) and the current period of selected time frame.
- Black BBW - BBW for signal period (5 min/ 5 length/ std_dev 2)
- Blue BBW - for current period (current/ 20 length/ std_dev 2)
You can customise periods and length in the settings option.
Enjoy!
Leave any comments and/or press like button (if you do).
רצועות בולינג'ר (BB)

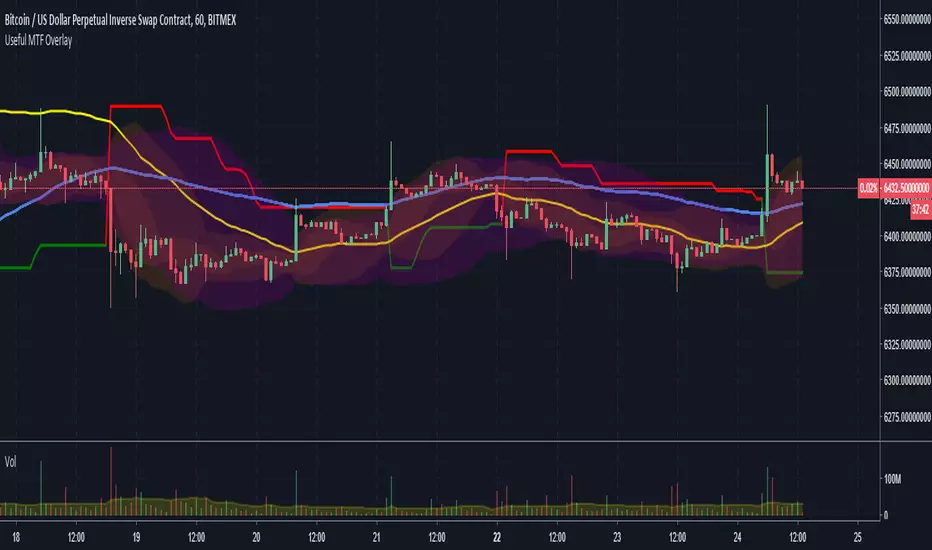
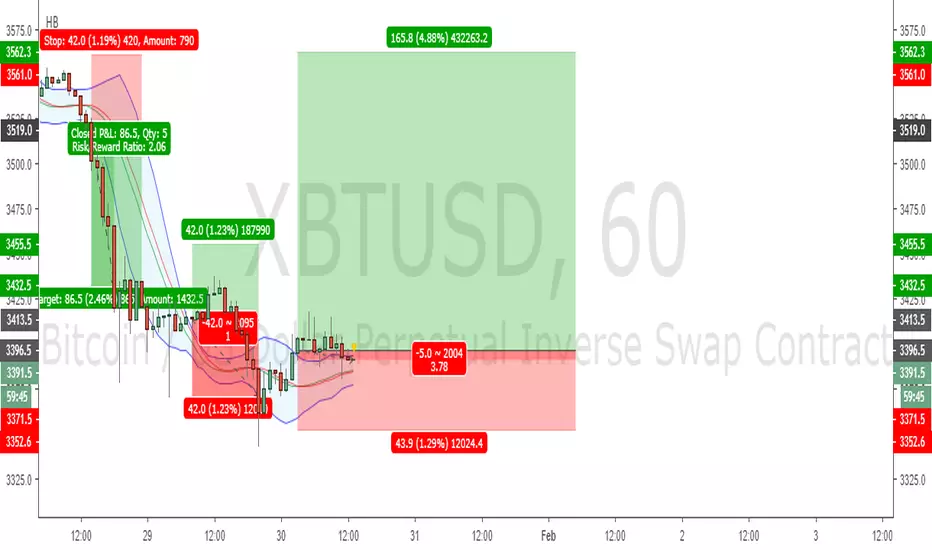
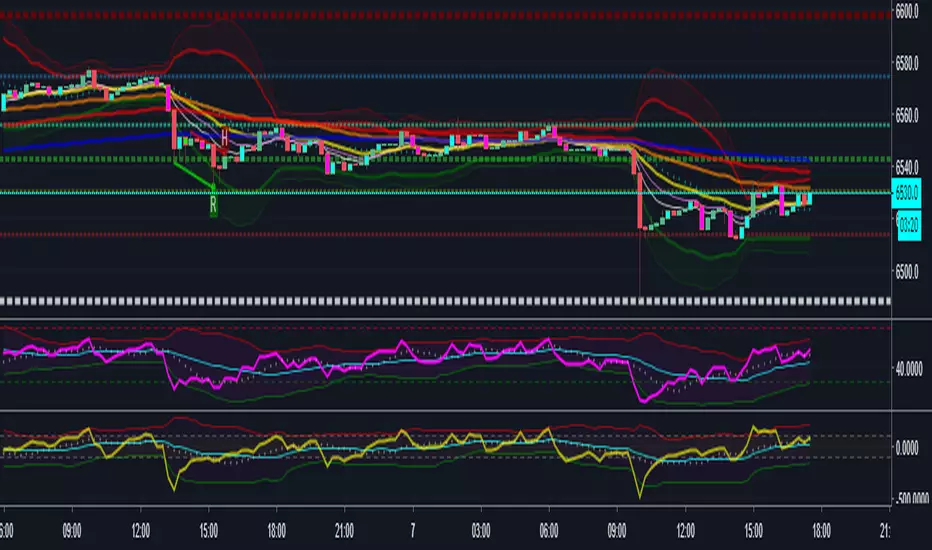
MTF Bollinger Bands, SuperTrend, TEMA Wave and ATR Stop LossThis script is a combination of useful overlay indicators that can be used for day trading or swing trading. You can use it for long term positions as well, but some tweaking may be required. I also added the multi time frame possibility for the majority of settings. This indicator gives you a lot of opportunities and trade setups. Default settings are made for day trading, using intraday time frames.
This script can display the following:
4 independent Bollinger Bands (MTF)
4 independent SuperTrends (MTF)
6 independent TEMAs (MTF)
ATR Stop loss for longs / shorts
Default settings display 3 Bollinger Bands, 2 TEMAs(I have found these two TEMAs particullarly useful, see screenshots below) and a signle SuperTrend.
Do not forget to always use a proper stop loss and risk management.
Here you can see the script in action in different markets:
BTC - BitMex - Setup before the drop from 7400 USD
BTC - BitMex - Setup before the drop from 8400 USD
BTC - BitMex - Setup before the pump to 7800 USD
BTC - BitMex - Setup before the pump to 6800 USD
AutoEnvelopeA channel that contains approximately 95% of all price data for the past 100 bars, about five months on a daily chart. It automatically plots correct channels for any trading vehicle in any timeframe.
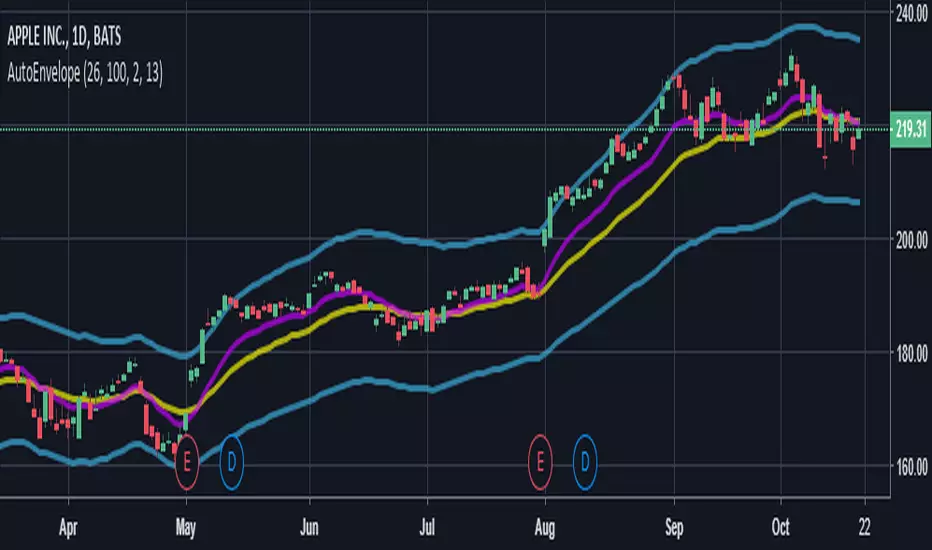
AutoEnvelopeA channel that contains approximately 95% of all price data for the past 100 bars, about five months on a daily chart. It automatically plots correct channels for any trading vehicle in any timeframe.

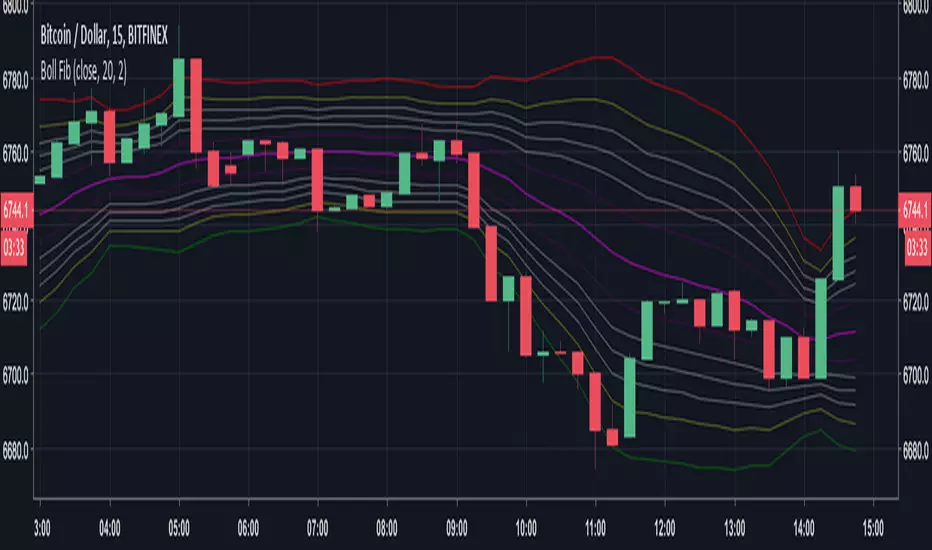
Librehash MV BandThis indicator does not need much of a description, although its utility is very obvious from first glance.
What this indicator is, is essentially a recreation of the Bollinger Bands (w a diff standard deviation calculation for the band formation) that also comes integrated with its own buy and sell signal as well.
This is one of the more valuable indicators out there for any and all traders that are looking to perform a Bollinger's like analysis in a more helpful, compact, and informative manner.
If you are looking to access this indicator, please shoot me a private message on here. This is an invite-only script, so there is a cost associated with the use of this indicator. Price and payment information will be relayed through our chat conversation.
Again, please reach out to me directly through a private message (not via comment to this post) if you have any questions about accessing this indicator.
Thank you.
Ichimoku & 3 BB & Multi MA by Theo Park V1.1.00Ichimoku Cloud
3 Bollinger Bands
Multi Moving Averages
4 Bollinger Bands and 2 Exponential Moving Averages This script contains multiple indicators of 3 types for better visibility and without having to select multiple indicators one by one and hence saving your time and energy. Also, minimum number of variables are being used in the script for better calculation speed and implementation .
This script is best suited for beginners who are not using pro version and finding it difficult to implement more than 3 indicators on a single chart layout :)
Indicators used :
1. Hybrid of Simple Moving Average and Bollinger Bands .
In this Indicator user can use total of 4 Moving Averages or 4 Bolinger Bands or both (eg: 3 Bolinger bands and 1 Simple Moving Average).
> How to use :
If you want to use Bollinger Bands simply check the boxes of all the 'Upper' and 'Lower' Bands under indicator format/settings.
Else if you want to use Simple Moving Average simply uncheck the boxes of all the 'Upper' and 'Lower' Bands under indicator format/settings.
Tip : You are free to experiment with the format/settings to use both Simple Moving Average and Bollinger Bands using 'MA Length' and 'StdDev'
(standard deviation).
2. Exponential Moving Average
In this indicator user can use 2 Exponential Moving Averages .
> How to use :
If you want to use 2 Exponential Moving Averages simply check 'Enable 2nd EMA' under format/setting inputs.
Else if you want to use only 1 Exponential Moving Average simply uncheck 'Enable 2nd EMA' under format/setting inputs.
Tip : You are free to experiment with both 'EMA_Length1' and 'EMA_Length2' and change it as per your requirments.
//Feel free to ping/DM me for any explaination on how to use this script as your ultimate trading strategy.

Bollinger Band Oscillator Filtered Long/Short Entries This script calculates entries using Bollinger Bands paired with a series of oscillators. Simply set the Bollinger Band length, as well as the length of the oscillators, and you're good to go. Filtered entries as well as unfiltered entries are plotted by default. Excellent results on longer timeframes (1 hour and higher), although scalping can be done on lower timeframes as well. Filtered entries give safer long/short entries, but plenty of good signals are generated by the unfiltered data as well. Has been tested and found to be effective on several stocks and cryptocurrencies.
Message me to try this script out, thanks!

TDI Signals [by: Bijan Ajdary]This indicator, along with the TDI indicator: , can offer trusted signals to enter and exit.
and just can be used as a complete trading system.
You can send your feedback and comments to my email address: bj.ajdary@gmail.com
@The_Last_Savior

TDI [by: Bijan Ajdary]TDI (Traders Dynamic Index) is based on a standard RSI indicator, determining the strength of the current trend and the speed of price changes. To smooth the lines, an algorithm of moving averages is applied and Bollinger Bands are used to estimate the amplitude of oscillations.
just TDI (Traders Dynamic Index) alone can be used as a complete trading system.
Traders Dynamic Index (TDI), giving simple and high probability entry signals.
For better signal efficiency, you can use this indicator with TDI Signals indicator.
You can send your feedback and comments to my email address: bj.ajdary@gmail.com
@The_Last_Savior

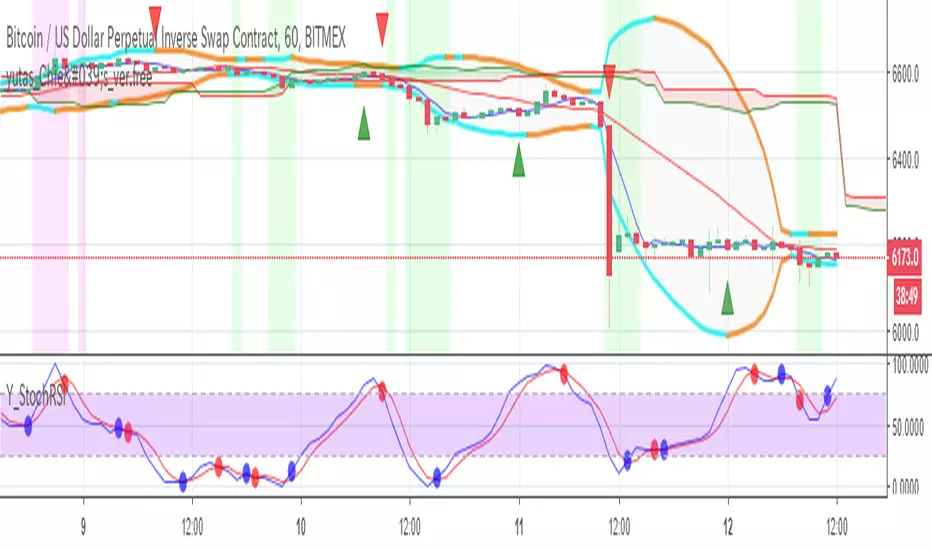
yutas_Chie's Indicator_ver.free
It is a free distribution version of Chie's Indicator.
ちえさんインジケーターの無料配布バージョンです。
Ichimoku & 2 BB & Multi MA (Ribbon) by Theo ParkThis indicator contains :
Ichimoku
2 Bollinger Bands
6 Moving Averages
and multiple Ribbon MAs.


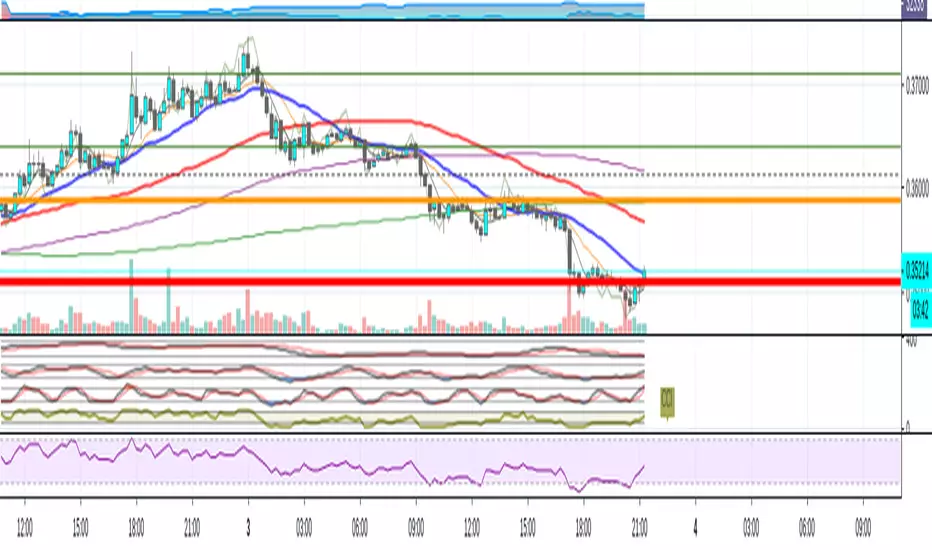
[ProfitTrailer] Bollinger Bands HIGHBB/LOWBB StudyBollinger Bands study for ProfitTrailer.
Supports buy/sell parameters configuration for both LOWBB/HIGHBB strategies.
Highlights regions where trailing is most likely to be fulfilled and buy/sell order placed.

bollingerATR system i mix some codes and made this (some are mine, some i collected in trading view while ago)
I hope you like it
two buy point (big and small green arrow)
3 exit (big and small red and orange arrow
bolinger band and ATR plus bolinger resistance and support level
have fun

Crypto Day/Swing Trade ComboI've been having some (educational) fun with Pine lately, and wanted to improve the Trading Combo script, so here is my Crypto Day/Swing Trade script.
It's a combination of several indicators, included are:
Bollinger Bands (with 3 bands/StdDev, 2 enabled by default)
(Enhanced) Ichimoku Cloud
Automatic Fibonacci S/R levels
6 Moving Averages
3 Hull Moving Averages
Price Action Bars
Price Divergence Detector
Since Pine is limited to 64 plots, this is all i could get in.
Shout out goes to ChrisMoody, Albert Callisto, 100kiwi, LazyBear, RicardoSantos & JustUncleL for their ideas and (part of) the source code
The script is fully configurable. Use the Inputs tab to enable or disable indicators and use the Styles tab to enable/disable (or configure) specific parts of each indicator.
Happy Trading!
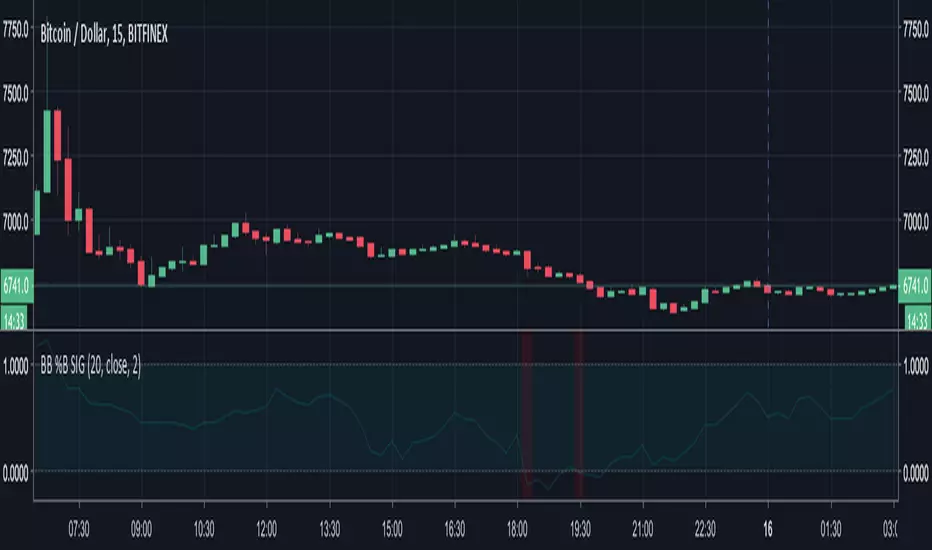
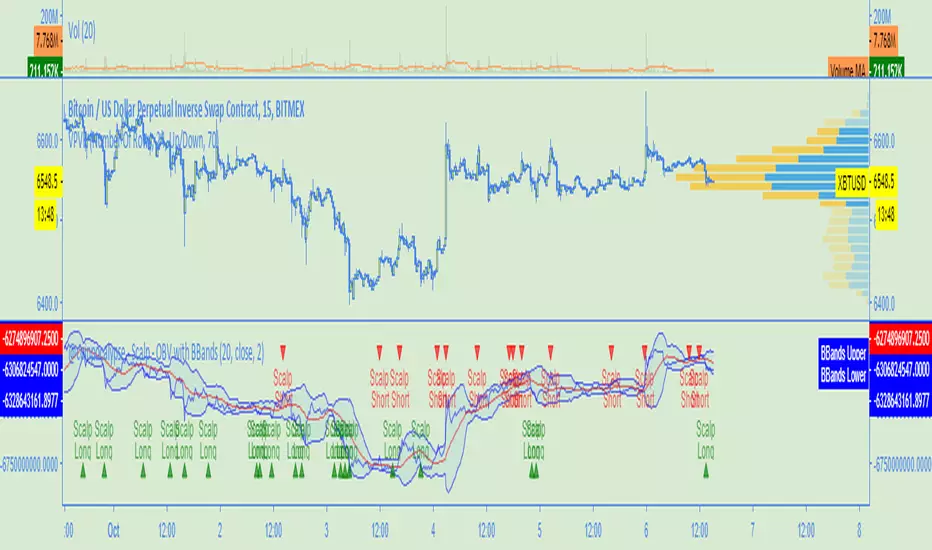
@coinpocalypse - Scalp Script - OBV with BBandsThis is a scalp script for the M15, tested on XBTUSD with good results.
Still some work to do, but easy to use.
My Script with stoch and bb
I created a script to buy / sell when stoch oversold, overbought and BB when the price is above the upper BB and falls below it.
I want to combine with rsi but I do not know how to do it
and I want to put SL to avoid the trap of market.
Do you have any way to help me optimize the scirpt?

