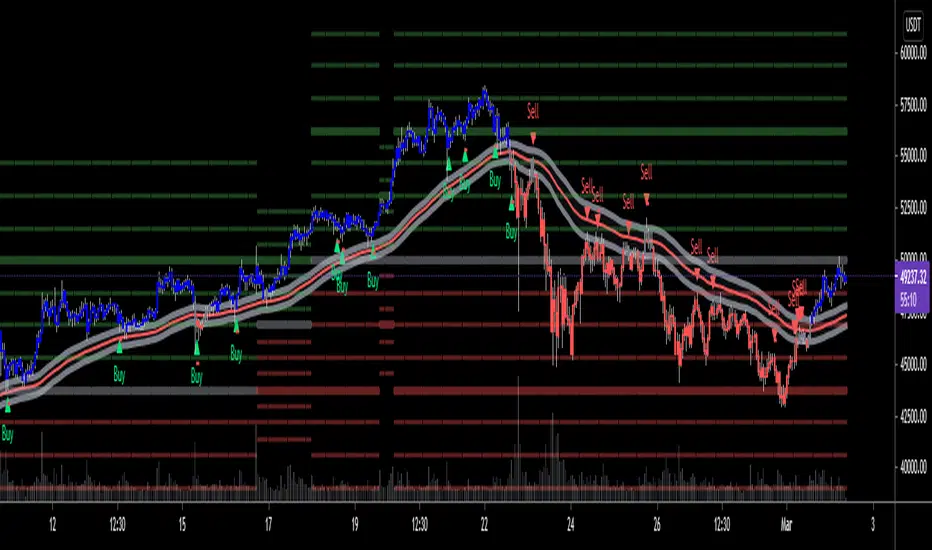
MTF SwingSwiss - Premium@panthair9, a SwingSwiss user, asked me to develop this script based on the two SwingSwiss crosses.
The indicator shows in real-time how the other timeframes are trading the asset.
It's pretty useful to know that the higher timeframes are also trading your way as it limits your risk (because you are trading the right trend)
You can choose up to five timeframes and style the lines and colored blocks 😃
There is one line per timeframe and whenever the green cross appears on the timeframe, it will get updated into the line as well !! I love the thing, thanks again @panthair9 ❤️
PS:
Dear SwingSwiss community, I am really trying to build the best indicator out there!
If you feel like I could improve the indicator in any way, just ask!
I'll do my best to make your dream indicator come true 🙌
Have A Great Day
Dan
BTCUSD

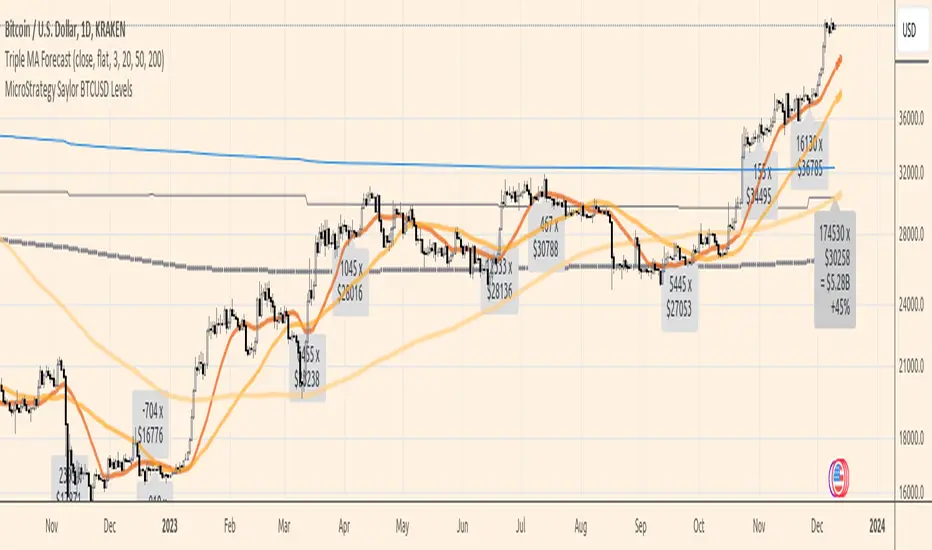
MicroStrategy Saylor BTCUSD LevelsDisplays the price levels of MicroStrategy's Bitcoin acquisitions according to their 8-K filings, total accumulated BTC, average USD price, and current gain.
BTC Multi Exchange Perpetual PremiumThis script tracks the premium/discount of Bitcoin perpetual contracts at various exchanges.
The premium/discount is calculated against an index price. The index price is calculated from spot exchange prices and are weighted as follows:
Bitstamp:28,81%
Bittrex:5,5%
Coinbase: 38,07%
Gemini: 7,34%
Kraken: 20,28
The difference between this script and other available scripts, is that exciting script seems to only focus on one exchange. This script is also open source.

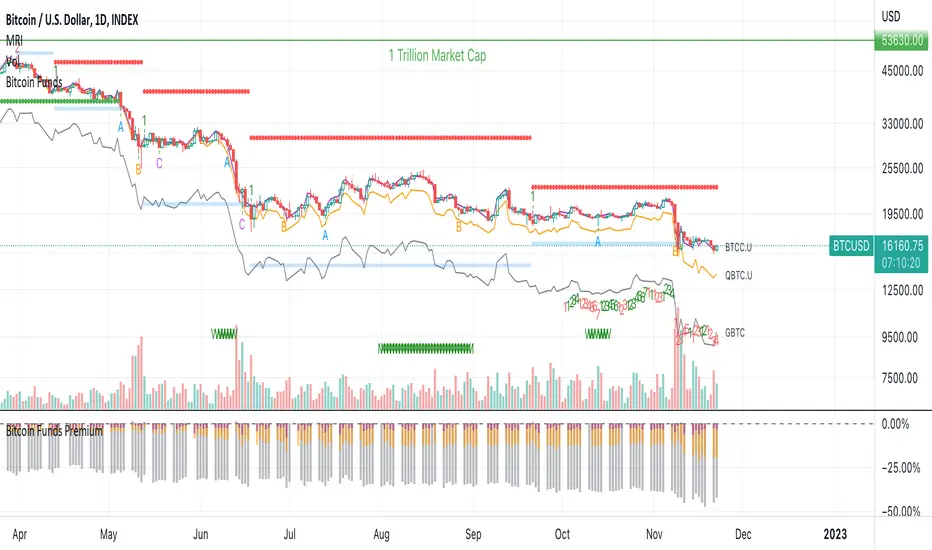
Bitcoin Funds OverlayOverlay the Net Asset Value per Unit (NAVPU) of 4 different Bitcoin Funds on your Bitcoin chart.
BTCC ETF
QBTC Fund
GBTC Trust
VBTC ETN
This indicator uses the metrics from the fund management websites to calculate the "Net Asset Value per Unit (NAVPU)" to display the true underlying value of the fund.
Note that the metrics can change and therefore the graph is not accurate for long past timeframes.
You can update the metrics for each fund in the settings dialogue.
The script will autodetect the currency pairs of your current graph and only display compatible funds:
BTC / USD will show BTCC.U, QBTC.U and GBTC
BTC / CAD will show BTCC and QBTC
BTC / EUR will show VBTC
The script should not show in other currency pairs so it will not mess up other charts you might switch to.
If you find bugs with this logic, please comment below so I can fix them.
Due to TradingViews "no-links in description" policy, you need to google each funds website yourself to find the current metrics. These search terms should help:
BTCC search "Purpose Bitcoin ETF"
QBTC search "3iq The Bitcoin Fund (QBTC)"
GBTC search "Grayscale® Bitcoin Trust"
VBTC search "VanEck Vectors Bitcoin ETN"
MicroStrategy Software Business Share PriceSimilar to the MicroStrategy Premium script. This indicator derives MSTR's core software business value by calculating its Bitcoin holdings as a percentage of market cap. Thus you can do, (1 - Bitcoin holdings as a % of market cap) * current share price = Core business share price

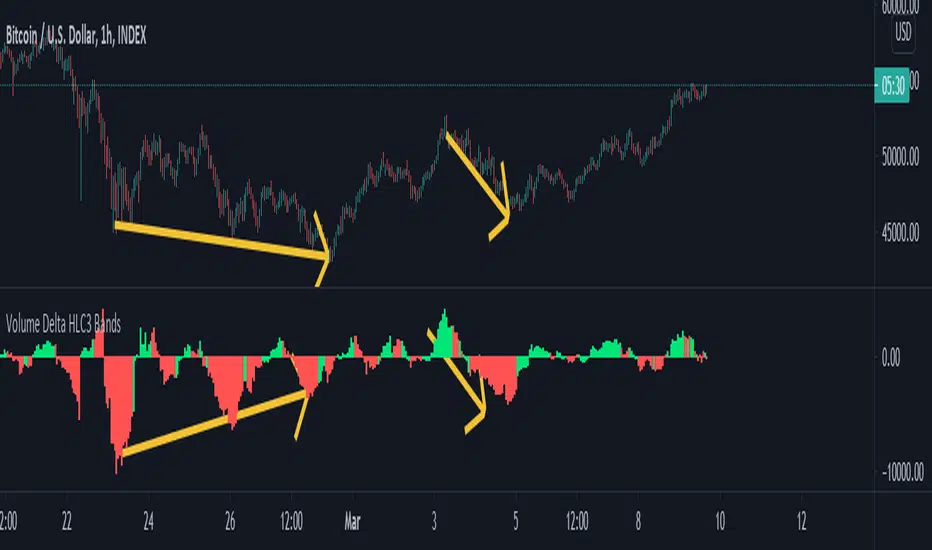
Volume Delta Histogram and BandsThis study takes the lower timeframe volume from the specified "Volume Data Time Period", and calculates the sum of volume over the user specified "Volume Signal period", doing its best to take an approximation of delta.
This is displayed via a histogram, and can be used to trade divergences, see trends strengthen and weaken as illustrated on the chart below.
You can also display reversal areas, which will show when the "Volume Signal Period" exceeds one half of the average volume plus two standard deviations over the "Volume Comparison Period."
Think of this like bollinger bands for volume trends, when the bands are tight crossing outside them can signal strength, but when they are moderate or contracting it can show an area for a likely reversal.
MAC Trader V2.0 [VK]This script is based on a very simple and affective strategy. Usable for scalp, Trend, Swing, positional Trading. Works on all types of markets(Crypto, Stocks, Commodity, Forex, etc) and symbols.
About The Indicator :
The three lines(Grey upper, Red Mid, Grey Lower) moving with the price direction is Moving average channel (MAC) Which is used to determine the Market Direction. Buy/Sell signals are plotted on RSI Oversold/overbought Which is used For Entries. Small Red Line plotted below the Buy/Sell Signals is Stop loss and The Dotted lines in Green, Grey and Red are the take profit lines.
How to use :
Buy When Buy Signal, Sell When Sell Signal (Entry only After Candle Close). Use The red line below/above signals for Stop Loss. Green Red dotted lines to take profit targets, move your stops above/below as targets hits.
Functions :
Moving Average Channel (MAC) For Direction
RSI for entries
ATR for stops
Support/Resistance Lines to Take Profits
Color candles When Price Above/Below MAC
Additional Feature :
Chop Signals for Scalping/continuation/Mid Entries - This feature can be turned on in the indicator settings Which will plot B/S signals for entries.
TIP : Use MAC input 34,48 for low volatile markets (Indices, Gold , etc)
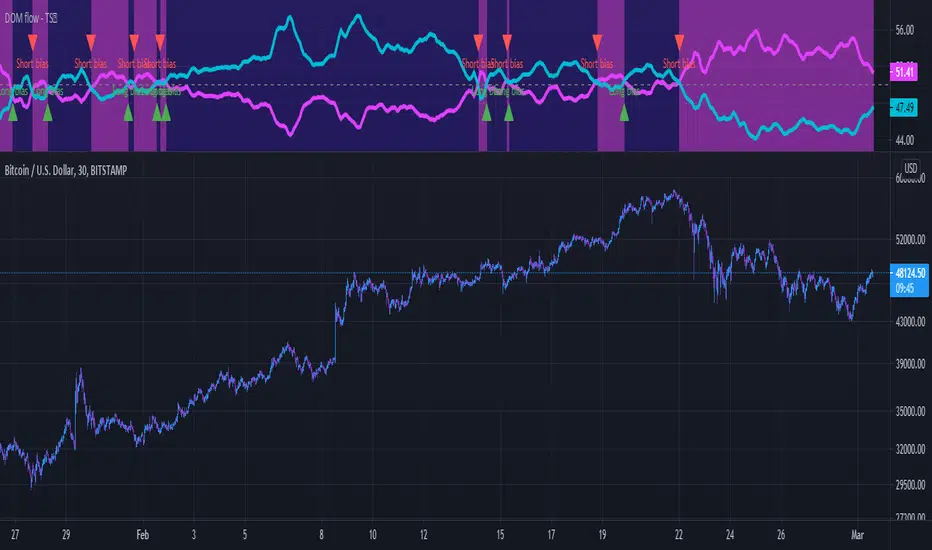
dominance flow RatioThis indicator is great for crypto
comparing the current pair (blue) to the USDT (tether pair in fuchsia), this is purely a visual aid and should not be used alone for entries and exits, but more so to help determine the bias direction for that pair.
MRC Trend Trader [VK]MRC Trend Trader one of the best indicator by VK. Usable for Trend, Swing, positional Trading. Works on all types of markets and symbols, Best To use in Time Frame Higher Than 30m
About The Indicator :
This indicator uses MACD to scan the Trend Based on Higher TF and RSI+CCI for entries . It also has the ability to plot MACD crossing signal line in higher TF, plotted on the bottom of the chart and ATR is used for Stop Loss, plotted below Signals. One of the best function of this indicator is support/resistance levels, dot lines plotted on the chart, Which can be used to Take Profit as targets.
How To Use :
The main strategy behind this indicator is to only Long When Background Trend is green and only Short when Background trend is red . Enter on B/S Signal close.
Functions :
- MACD to scan Trend and MACD cross on Multi Time Frame.
- RSI to find lower Buy entry and Higher Sell entry (MTF - Only use current TF or Lower).
- CCI to find continuation entries (More Signals).
- Stop Loss.
- Support and Resistance Levels (Take Profit Targets).
This indicator is set up keeping Money management as one of the main priority, Keep taking profits on targets and always move Stop Loss to Breakeven Once in Profit.
PM for access.

MRM+R2 [VK] V4.0MRM VK Alert
This is the alert version of MRM strategy.
MACD and RSI can be used multi time frame to filter trend.
It is a very simple strategy which goes long/short when MACD , RSI and MA Trend Changes in higher Time Frame.
Additional Features :
RSI 2 signals to Re-enter
ATR stops plotted below signals

Binance Z VolumeBTC perpetual volume on Binance is about 4x spot volume.
Comparing spot and perpetual volumes could provide useful insights into market sentiment.
Abnormal increases in the spot market could be associated with accumulation. Abnormal increases in the perpetual market, on the other hand, could predict volatility as well lows and highs.
This script represents a Z-score of the volume of perpetual and 4xspot on Binance.
High values above 0 mean that the volume is skewed towards perpetual contracts. Values below 0 mean that the volume is skewed towards spot contracts.
Feel free to suggest changes and improvements of this script.
Translated with www.DeepL.com (free version)
BIO

BTC Price to Hash scoreGrowing btc hashrate are associated with increasing btc price.
During speculative phase price growth is disproportionate to the hashrate.
On the opposite when the price fall to much in comparison to the hashrate, bitcoin could be undervalued.
This indicator identified 3 of 4 major tops and a lot of optimal buy opportunities.
Value under 0 signal overbought situations, value above 5.6 signal extremely oversold situations.
BIO

DeLorean-V4 Long/ShortThis study aims to follow the trend of the asset, in longer times it is quite correct, but it can also be used in shorter time to be able to follow the trend of the asset.
Using the Bollinger Bands indicator, to get a better idea of volatility .
This indicator shows me the best trend in the cryptocurrency scenario, but it was very positive, also showing the trend in the "traditional" market.
Configured alerts for Long / Short.
Enjoy!
----------------PT-BR-----------
Este estudo visa acompanhar a tendência do ativo, em tempos maiores é bem assertivo, mas podendo também ser usado em menores tempo para poder acompanhar a tendência do ativo.
Usando o indicador Bollinger Bands , para ter uma ideia melhor da volatilidade.
Este indicador me mostra a tendência melhor no cenário de criptomoedas, mas foi bem assertivo também mostrando a tendência no mercado "tradicional".
Configurado alertas para Long/Short.
Enjoy!

Fibonacci EMAs / Trend and Chopzone identifier Implementation from the highly recommended course "Pinescript Indicator Development" on Udemy
www.udemy.com
This indicator is mostly to show some techniques in Pinescript rather than be useful for trading, however it does nicely identify trend and chop zones (sideways) on the 1-hour or 4-hour chart.
What it does:
- Has three EMAs at varying length and plots these on the chart
- Computes when the EMAs are in bullish configuration (EMA short > Medium > long)
- Computes when EMAs are in bearish configuration (EMA short < Medium < long)
- When the EMAs are crossed there is a chop zone (sideways)
- Colours the background of the chart as Green (bullish), Red (bearish) or Orange (sideways chop zone)
- Also predicts the value of the three EMA's three points into the future using linear regression (showed as dots on the chart)

Bitcoin Bulls and Bears by @dbtrBitcoin 🔥 Bulls & Bears 🔥
v1.0
This free-of-charge BTC market analysis indicator helps you better understand what's going with Bitcoin from a high-level perspective. At a glance, it will give you an immediate understanding of Bitcoin’s historic price channel dating back to 2011, past and current market cycles, as well as current key support levels.
Usage
Use this indicator with any BTCUSD pairs , ideally with a long price history (such as BNC:BLX )
We recommend to use this indicator in log mode, combined with Weekly or Monthly timeframe.
Features
🕵🏻♂️ Historic price channel curve since 2011
🚨 Bull & bear market cycles (dynamic)
🔥 All-time highs (dynamic)
🌟 Weekly support (dynamic, based on 20 SMA )
💪 Long-term support (channel bottom)
🔝 Potential future price targets (dynamic)
❎ Overbought RSI coloring
📏 Log/non-log support
🌚 Dark mode support
Remarks
With exception of the price channel curve, anything in this indicator is calculated dynamically , including bull/bear market cycles (based on a tweaked 20SMA), ATHs, and so on. As a result, historic market cycles may not be 100% accurately reflected and may also differ slightly in between various time-frames (closest result: Monthly). The indicator may even consider periods of heavy ups/downs as their own market cycles, even though they weren’t. Due to its dynamic nature, this indicator can however adapt to the future and helps you quickly identify potential changes in market structure, even if the indicator is no longer updated.
On top of that bullmarket cycles (colored in green) feature an ingrained RSI: the darker the green color, the more the RSI is overbought and close to a correction (darkest color in the chart = 90 Weekly RSI). In comparison with past bull cycles, it helps you easily spot potential reversal zones.
Thanks
Thanks to @quantadelic and @mabonyi which both have worked on the BTC "growth zones" indicator including the price channel, of which I have used parts of the code as well as the actual price channel data.
Follow me
Follow me here on TradingView to be notified as soon as new free and premium indicators and trading strategies are published. Inquire me for any other requests.
Enjoy & happy trading!

Bitcoin Bulls & Bears @dbtr
Bitcoin Bulls & Bears
The "Bitcoin Bulls & Bears" indicator helps you better understand Bitcoin with a high-level view on Bitcoin’s historic price channel, past and current market cycles, as well as current key support levels.
Usage
Use this indicator with any BTCUSD pairs , ideally with a long price history (such as BNC:BLX )
We recommend to use this indicator in log mode, combined with Weekly or Monthly timeframe.
Features
🕵🏻♂️ Historic price channel curve since 2011
🚨 Bull & bear market cycles (dynamic)
🔥 All-time highs (dynamic)
🌟 Weekly support (dynamic, based on 20 SMA)
💪 Long-term support (channel bottom)
🔝 Potential future price targets (dynamic)
📏 Log/non-log support
🌚 Dark mode support
Remarks
Except for the historic price channel curve, all of this indicator is calculated dynamically , including bull/bear market cycles (based on a tweaked 20SMA). Due to this, the historic market cycles may not be 100% accurate and may also differ slightly between time-frames. It may also consider short times of ups/downs to be their own market cycles, even though they weren’t. This dynamic nature allows this indicator to adapt to the future and quickly help you identify changes in market structure.
On top of the that, the bullmarket cycles (green background) feature an ingrained RSI information: the darker the green, the more the RSI is overbought and close to a correction. In combination with past bull cycles, it is easier to spot potential reversal zones.
Thanks
Thanks to @quantadelic and @mabonyi for their pre-work on the price channel information, which I have taken over here

Total Volume BTC - Dollar [Sobhm]
Do you want an indicator that shows the total volume in Bitcoin vs Dollar?!
The BTCUSD - BTCUSDT - BTCUSDC total volume is covered by the "Total Volume BTC - Dollar " indicator.
You can see the differences between simple volume and the collected volume using "Total Volume BTC - Dollar ".
The volume of the following pairs are collected:
'BITMEX:XBTUSD'
'BINANCE:BTCUSDT'
'BINANCE:BTCUSDTPERP'
'BITSTAMP:BTCUSD'
'COINBASE:BTCUSD'
'BITFINEX:BTCUSD'
'BYBIT:BTCUSD'
'GEMINI:BTCUSD'
'OANDA:BTCUSD'
'FTX:BTCUSD'
'FX:BTCUSD'
'HUOBI:BTCUSDT'
'BYBIT:BTCUSDT'
'COINBASE:BTCUSDC'
'BITSTAMP:BTCUSDC'
'POLONIEX:BTCUSDC'
'KUCOIN:BTCUSDC'
'HITBTC:BTCUSDC'
The timeframe is adjustable based on minutes.

trendOne [Alerts]BITSTAMP:BTCUSD
trendOne
(alerts)
This script combines all our previous trend-based scripts (Bows, Autopilot, Trend Indicator, Price Deviation, etc) in only one script .
To calculate the trend we use:
Volume Weight
Average True Range
Bows calculations
Trends smoothed with alma() function.
For more accuracy on the signals and to filter unwanted signals we layered slower time-frames in the background and added breaking support & resistance rules.
Inputs
Sensitivity
Integer input. Sets the sensitivity for signals generated up and down. Higher values will generate less signals on chart, and vice-versa.
Enjoy!
To get access to this and other scripts check links below.

© 2021 - SwingSwiss - BUY/SELL© 2021 - Dan Chetrit - BUY/SELL"
Product Description:
The Indicator combines the Relative Strength Index, Moving Average Convergence Divergence as well as Volume and Stochastic.
The idea is to cross multiple data and signals from these indicators in order to trigger buy when crossing above and sell when crossing below the signal line.
The idea was also to find a mathematical function that will trade the convergence of these lines trying to predict the market.
This indicator works better on a daily chart.
The indicator works long and short but is better for long positions.
The script also includes an EMA 50 line as well as an overbought/oversold RSI background.
The indicator can be used on every type of market: indices, stocks, cryptocurrencies, currencies, and others but, according to backtesting, it works better for the US stock market.
This study is not a guaranteed profit. You should backtest or trade virtual money before using this study on your real portfolio, as it is intended to be a tool. Do your research and learn about the company you are investing in.
Disclaimer:
Trading and investing in the financial markets involves substantial risk of loss and is not suitable for every investor.
All trading strategies are used at your own risk.
Please send me a private message or comment on TradingView to gain access to the script.

Crypto USD(T) Premium Rate RTA-V3.0
Crypto USD(T) premium rate RTA-V3.0 comes from RTA Academy, author Ruomise Lin, public indicators.
Effect:
This indicator specifically analyzes the premium of BTC, ETH spot and futures.
When the exchange BTCUSD perpetual contract> BTCUSD spot, the display is green, otherwise it is red.
When the exchange BTCUSDT perpetual contract> BTCUSDT spot, the display is green, otherwise it is red.
Features:
Select the underlying BTC or ETH
Custom Numerator Spot USD Spot USDT Futures USD Futures USDT
Custom denominator spot USD spot USDT futures USD futures USDT
The custom unit defaults to 1/10000‱
Custom MA length
BTCUSD spot index including,
Coinbase
Bitstamp
Karken
Gemini
Bittrex
BTCUSDT spot index including,
Binance
OKEX
Huobi
Bittrex
If you have any questions, please contact the author, please see the signature.
-----------------------------------------------------------------------------------------------------
Crypto USD(T) Premium Rate RTA-V3.0 来自RTA学院,作者Ruomise Lin,公开指标。
Crypto USD(T) Premium Rate RTA-V3.0 中文名 数字货币市场USD(T)溢价值指标。
作用:
该指标专门分析交易所 BTC、ETH 现货与期货的溢价情况。
当交易所 BTCUSD 永续合约>BTCUSD 现货时候,显示为绿色,反之为红色。
当交易所 BTCUSDT 永续合约>BTCUSDT 现货时候,显示为绿色,反之为红色。
功能:
选择标的 BTC ETH
自定义分子 现货USD 现货USDT 期货USD 期货USDT
自定义分母 现货USD 现货USDT 期货USD 期货USDT
自定义单位 默认为万分之一 ‱
自定义MA长度
其他:
该指标需要结合RTA课程使用,及B站《USDT为什么一跌再跌》视频使用。

BTC Longs & Shorts Profile WHAT DOES THIS INDICATOR DO?
I started with the idea of creating another premium indicator with a bunch of features and add it to the bundle. However, the more complex the code was becoming, the less helpful the indicator actually was. So I started from scratch and made BTC Longs & Shorts Profile super simple (as you can see in the code).
The advantage over other similar indicators is that this one has a drop-down menu and allows you to select whether you want to see Longs, Shorts, Ratio, or Difference. Having Longs and Shorts at the same time is a bit confusing because Longs pretty much dwarf the Shorts and the ups and downs are not clearly visible. Also, you can configure the colors for each visible line.
My suggestion is to add this indicator to your BTC chart, save it as a template from the top menu on TradingView and stop switching between BTC, Bitfinex Longs and Shorts. You have everything in one simple window (that's especially the case if you are not a pro or premium member and can't have more than 2 screens simultaneously).
ANYTHING ELSE ?
On a side note, if you are planning on working on a similar indicator, let me tell you what I've tried so far and it didn't work for me:
- RSI calculations including Longs and Shorts as a base
- Longs and Shorts in relation to BTC itself and a relationship with the volume
- Directional Movement Index, where Longs are DM+ and Shorts are DM-
- Smoothing both Longs and Shorts and trying to find a relationship (including some pseudo MACD lookalikes)
Anyway, if you have any ideas or suggestions on improving this indicator, please let me know. Thanks!

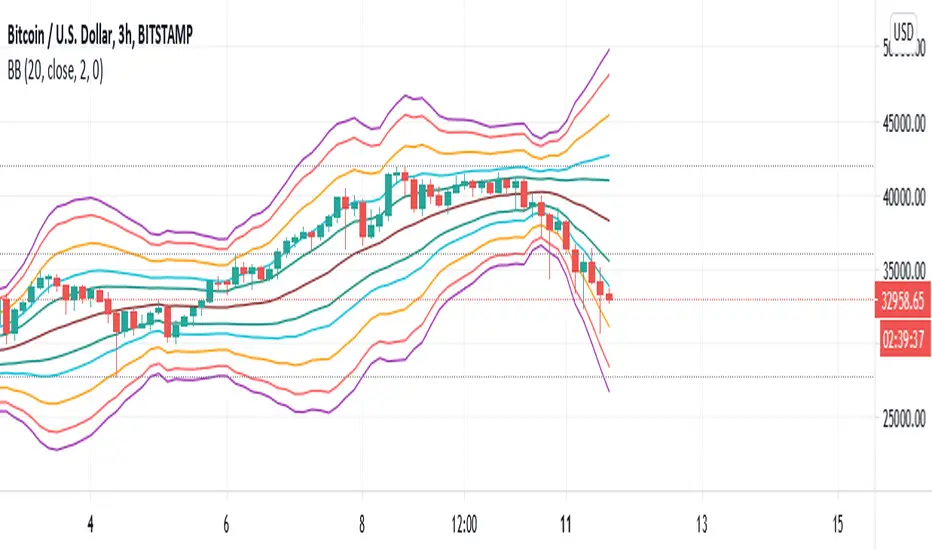
Bollinger Bands Fibonacci Ratio Standard Deviation LINESHello Traders.
in this script, Bollinger bands are made based on a standard deviation with respect to Fibonacci ratios. I hope you can be satisfied. If you are satisfied with this script, please like and feel free to share your comments with me.
Teal Upper and Lower B-Bands = 1.0 Standard Deviation
Aqua Upper and Lower B-Bands = 1.618 Standard Deviation
Orange Upper and Lower B-Bands = 2.618 Standard Deviation
Red Upper and Lower B-Bands = 3.618 Standard Deviation
Purple Upper and Lower B-Bands = 4.236 Standard Deviation
you can use this indicator by clicking the button (Add to Favorite Scripts) and then add it to your chart from (Fx) section.