That One Indicator (Free) - [Backtester]This Backtester comes with the following indicators:
Bollinger Bands
ADX
Moving Average Trend Confirmation Filter ( EMA , SMA , DEMA , TEMA , WMA , VWMA , SMMA , HullMA, LSMA , ALMA , SSMA, TMA, ZLEMA )
And a few more indicators in the back-end to increase accuracy
This strategy works really well as a scalper on lower Time Frames as well as on higher Time Frames. Besides that you can also trade it on pretty much any coin or asset.
The alerts script is not repainting. We advise to use alerts on “Once Per Bar Close”.
If you’d like to automate this strategy you can do that by using our alerts script with AutoView, ProfitView, ProfitTrailer, CryptoHopper etc.
Alerts are set very clearly as Long and Short to avoid confusion.
Feel free to leave a comment and share it with your friends.
BTCUSD

Strategy based on the principles of Price ActionIt is considered the percentage of candles with low and high closure for a certain period. Then, a moving average is built from these values. When the moving average of the ratio of tall candles to low candles is greater than the ratio of low candles to high, then long (that is, when the green line crosses the red). And vice versa - a condition for short. It also works on crypto with other settings. Idea for improvement: you can make partial exit by taking, at certain profit levels, the chart will be more stable. Result with a commission of 0.004% You can create an optimizer, and use this strategy on any liquid asset. (Sorry for google translator)

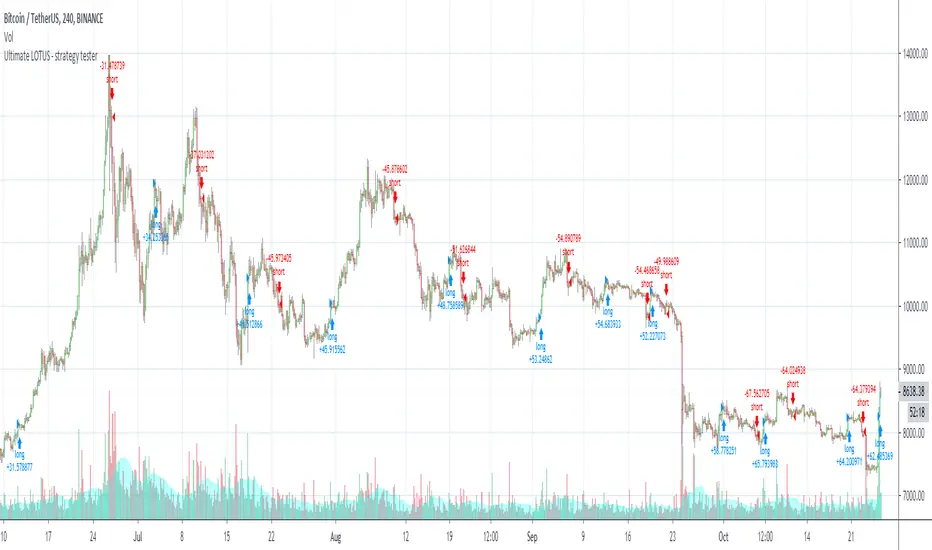
Ultimate LOTUS - strategy tester
Welcome to the Ultimate LOTUS - Strategy Tester.
This indicator is used for back-testing. Once you have found settings that you like, you can use my other published indicator "Ultimate LOTUS" to set alerts.
How to use: Apply to any chart, on any time frame. You will see LONG and SHORT signals on the chart. A LONG signal represents an entry/buy in, and a SHORT signal represents an exit/sell.
You can use the Express - Strategy Tester to scalp on low time frames such as the 5m, 15m, 30m etc. Or use it on higher time frames such as the 1hr, 2hr, 4hr.
You can use regular candles but Heikin Ashi are recommended for better accuracy.
You cannot set alerts with this indicator!
BITCOINDICATOR StrategyStrategy for BITCOINDICATOR for your own backtesting purposes.
The trade locations mirror the price label values generated by BITCOINDICATOR (You can check by clicking on Strategy Tester > List of Trades). Just like BITCOINDICATOR, this strategy works with all time frames, although higher time frames will result in better average profit per trade.
Inputs:
- Click the gear icon to adjust the backtesting date range inputs.
Properties (gear icon then click properties tab):
- The default initial capital is 0, and the default order size is 1 Contract (1 BTC ) per trade (this gives more weight to the most recent data).
* We recommend keeping the order size in contracts because if you use fiat, the time periods of lower-priced Bitcoin will have a greater impact on the strategy (since those trades would transact more BTC ).
- Pyramiding is the number of trades allowed to be taken in the same direction. The default value is set to 5, although it is rare to see more than 2 trades in the same direction.
* Additional trades in the same direction can be useful for adding on to your position or just for trend confirmation. If you prefer to see every SHORT followed by a LONG and vice-versa, you can change pyramiding to 1.
Side Notes:
- BITCOINDICATOR strategy can also be used for any Altcoin/Stable coin pair (such as ETH/USD). However, you will want to increase the order size from 1 Contract, to suit your Altcoin (For example, at the time of writing: 1 BTC = 47 ETH, so I would trade ETH/USD with an order size of 47 contracts). Of course, you can adjust the order size to the amount that you are actually trading.
- You will notice that the lower the selected time frame, the date range for backtesting becomes more limited. This is because there is a historical bar data limit of 5,000 - 10,000 bars depending on the tier of your TradingView account.
*Bitcoindicator Strategy is part of the Bitcoindicator package.
For detailed information on Bitcoindicator and how to add it to your charts, please visit:
www.bitcoindicator.com
Strategy tested on BTC/USD(Day) from 1/1/2017 - 10/1/2019 :

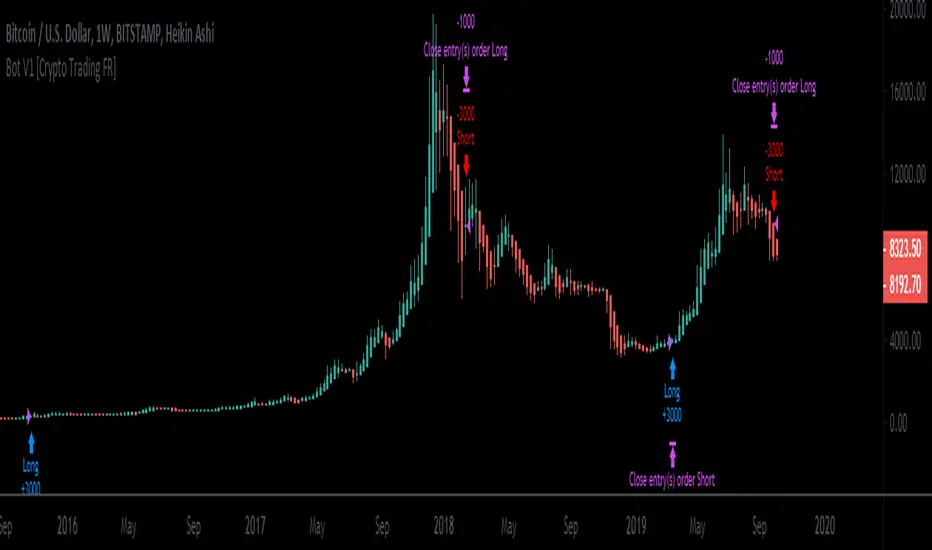
Crypto Trading France algo indicator V1This is an experimental study which calculates WMA and MA channel crossover over a specified period or interval using custom lengh for its calculations.
Some valuable tips:
- MUST USED Heikin-Ashi candles
- BTCUSD Bitstamp chart for longer backtest results
- Longer timeframe (2h, 4h, 1D, W) are better
- Moove the "Lengh - Speed" setting to adapt the strategy regarding the asset and timeframe used.
For example on BTCUSD ( Bitstamp ) my favorites "Lengh - Speed" values are:
4H > 4, 6, 31
1D > 6, 16
W > 12
Tested with both Crypto & Forex, results are extremly accurate and entry are most of the time predicted in the right way.
I don't necessarily recommend using this tool as a standalone, but rather as a supplement to your analysis systems.
This indicator DO NOT REPAINT
Hope you'll enjoy it :)
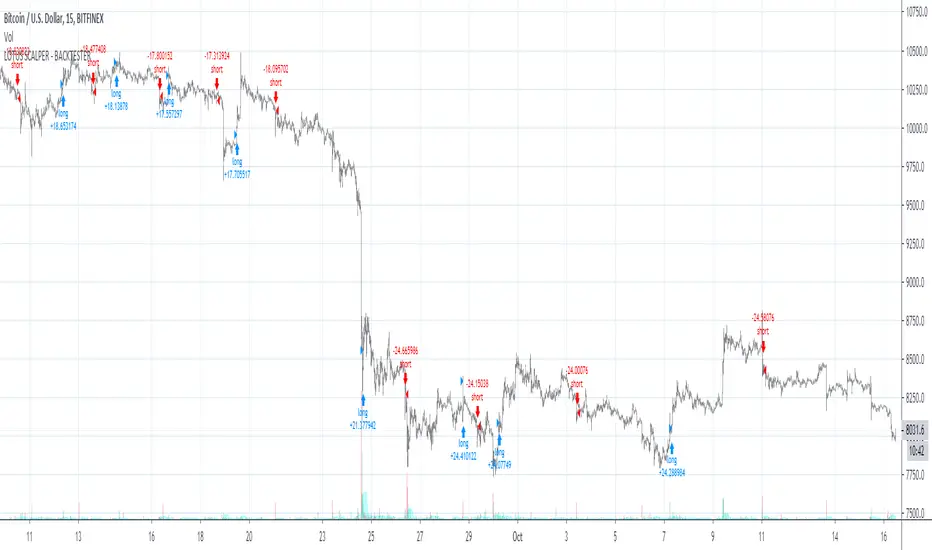
ZomyzoX Scalp 1 MinuteEnglish
XBTBTC, BTCUSD , BTCUSDT is a strategy made to parity for 1 minute. Scalp is a very successful strategy for trading. It is free to use. Optionally, other strategies can be written.
Contact
Twitter: @zomyzox
Mail: oguzhan.yilmaz@hotmail.com.tr
Türkçe
XBTBTC, BTCUSD , BTCUSDT paritesi için 1 DK'da scalp trade için yazılmıştır. Scalp trade için başarılı buluyorum. Kullanımı ücretsizdir. İsteğe göre başka stratejilerde yazabilirim.
İletişim
Twitter: @zomyzox
Mail: oguzhan.yilmaz@hotmail.com.tr

Lancelot vstop intraday trending strategyDear all,
Free strategy again.
I found using 3 volatility stop with different settings could be very helpful when trading an intraday trending market.
With the ATR setting or 5, 10, 15, we can weed out many false break.
Vstop setting is OHLC4.
On the other hand, this strategy also utilize Renko as part of the strategy, so you could say this strategy is mainly an intraday break out trend following strategy.
Works well on BTCUSD XBTUSD, as well as other major liquid alt Pairs.
And lastly,
Save Hong Kong, the revolution of our times.

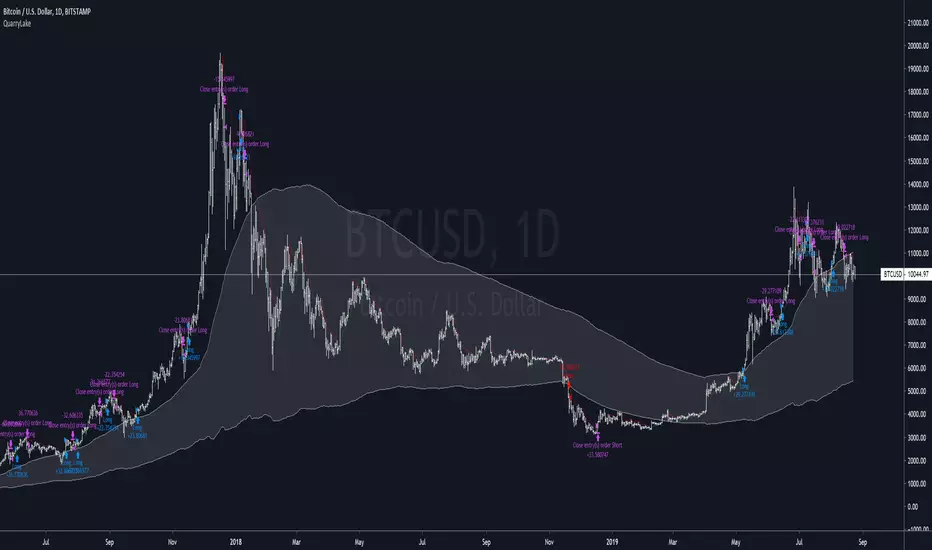
QuarryLake v4As some of you requested, I will make the code for QuarryLake Open for you all.
I have also updated the script in version 4.
This strategy consists of 3 indicators that I found works quite well together.
Keltner Channel, Waddah Attah Explosion, and Volatility Stop .
KC Period = 200
KCATR = 5
Vstop Period = 3
Vstop Mult = 1.5
Long when close > KC, close > Vstop, WAE trendUp
Short when close < KC, close < Vstop, WAE trendDown
Works well on BTCUSD XBTUSD , as well as other major liquid Pair.
This strategy utilized a modified Kelly position sizing for BTCUSD Bitstamp , feel free to modify it to your needs.
And lastly,
Save Hong Kong, the revolution of our times.

inwCoin CDC ATR Trailing Stop Risk% StrategyATR Strategy base on CDC ATR Trailing stop นะครับ
ตัวนี้มี option ให้เลือกว่าจะใช้ stop ตาม ATR หรืออยากจะ stop แบบแท่งเทียนย้อนหลัง
ลองเล่นๆ ดูครับ

RSI Fibonacci Levels StrategyRSI with Fibonacci Levels
Visually can be used as:
- Countertrend indicator at extreme green/red lines
- Follow trend indicator
- Fibonacci supports and resistantes zones
The strategy works as a follow trend
How to trade:
The indicator is more reliable in longer time frames, at least 4H
Choose a fibonacci level as reference
Buy when the RSI line turns green
Sell when the RSI line turns red

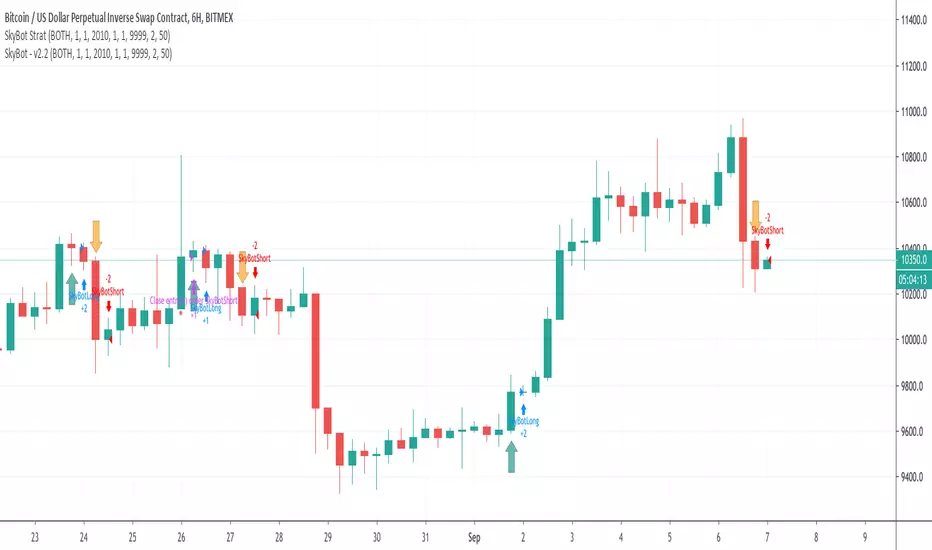
SkyBot Strategy - BTC and XBTUSD Trading Bot for CryptoThe SkyBot is written to provide a good balance between long-term trading and short-term for more action. It has been running for over a year before it was decided to share with the public.
SkyBot uses moving price action data from multiple time frames to determine when to go long or short. It also provides the user with the ability to use stop loss and take profit values to match whatever risk management rules you use in your trading.
SkyBot has simple to use alerts making it simple to use with many auto-trading offers.
SkyBot has been coded in the latest version of Pine (v4) and will be updated as new features, functionality, and support is released with Pine.
To get access to SkyBot, please signup here: cryptoscriptking.com
This is the indicator script that is intended to be used to get alerts for the purposes of automation. The strategy script is also included allowing you to do your own backtesting.
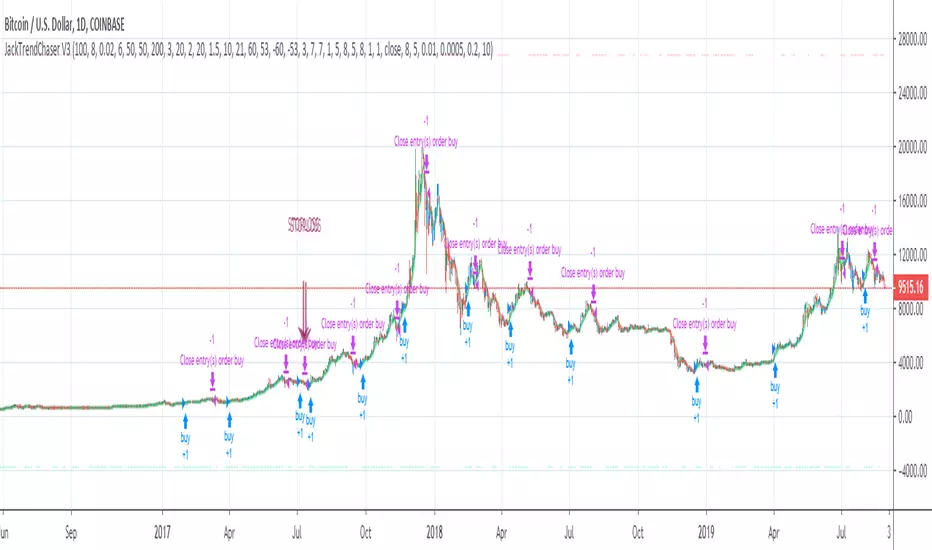
JackTrendChaser V4This is like V3 but with minor improvements - and this script is only protected which means that you are free to try it out!
I would love to know your thoughts on this so please try it out and get back to me :)
Link to V3:
BullRider [JackTz] (strategy)Taking a new approach - I have noticed how all scripts have the same pattern (or issue) when it comes to a bear trend. The majority of scripts works just fine when in a bull trend but once the bears starts to overtake the shit hits the fan and the trades will mostly become negative.
To prevent this I tried to create a script that only trades during a bull run. This strategy is initially created for coins with a big marketcap and for daily timeframe. It works well on 4H timeframes for some coins as well though.
I have tested this through Bar Replay on daily and 4H BTC and it holds out! No repaint!
I will be adding a version for alerts soon.
Please try it out and let me know your thoughts and findings!
//Jack

BTC strategy for margin tradingAlmost identical to the one I published before, but this one includes short orders as well.
I didn't spend much time backtesting, so there may be a different set of parameters that gives better results. Please let me know if you find something!

Express - Strategy TesterWelcome to the Express - Strategy Tester.
This indicator is used for back-testing. Once you have found settings that you like, you can use my other published indicator "Express" to set alerts.
How to use: Apply to any chart, on any time frame. You will see LONG and SHORT signals on the chart. A LONG signal represents an entry/buy in, and a SHORT signal represents an exit/sell.
You can use the Express - Strategy Tester to scalp on low time frames such as the 5m, 15m, 30m etc. Or use it on higher time frames such as the 1hr, 2hr, 4hr.
You can use regular candles but Heikin Ashi are recommended for better accuracy.
When using Heikin Ashi, I have included a real price line which shows the actual price of the asset/chart at the close of each candle.
You cannot set alerts with this indicator!

QuarryLake - An ATR base strategyThis strategy consists of 3 indicators that I found works quite well together.
Keltner Channel, Waddah Attah Explosion, and Volatility Stop.
You can find WAE here
KC Period = 200
KCATR = 5
Vstop Period = 3
Vstop Mult = 1.5
Long when close > KC, close > Vstop, WAE trendUp
Short when close < KC, close < Vstop, WAE trendDown
Works well on BTCUSD XBTUSD, as well as other major liquid Pair.
This strategy utilized a modified Kelly position sizing for BTCUSD Bitstamp, feel free to modify it to your needs.
More information can be found here dqydj.com
Feel free to follow me on Twitter @Lancelot_Auger for more free Alpha.
Dompeet Pompeet (Breakout bot)Dompeet Pompeet is my first attempt at a viable swingtrading algo.
It uses volatility and some trend analysis to enter trade when the market is about to breakout or break down. Having a trailing stop locks in profits and prevents runaway losses for low drawdown and 2:1 profit factor.
Settings to use:
BTCUSD or XBTUSD
4hr Timeframe or 2hr or 1hr (not shorter)
Bars window: 13, 16 or 20 bars
Moving average settings: 100/10 EMA to confirm trend
Trade the Trend - check on to only take trades long in a confirmed uptrend (vice versa short), otherwise it will attempt to buy and sell counter trend, which increases profits but also increases loss rate.
Trailing stop, values from 2-5% give the best results.
Take with a pinch of salt, there are some bugs in pine script which are difficult to track down but overall I'm pleased with the idea.


MA-MTF-STRAT// Strategy based on SMA
// Time frame 5M, 10M, 15M
// Created and based on Binance chart
// Working with comission
// No repaints

JackTrendChaser V3Hi everyone! I am so thrilled to announce this!
>> LIMITED TIME OFFER, read below! <<
My name is Jack and I have been trading trends using TA on Forex for 10 years now and have within the past two years been trading Bitcoin and other cryptocurrencies.
I am a part time trader and developer. On a daily basis I work as a software developer creating various algorythms for big data usage - such as machine learning etc. and I have found a passion in creating scripts to predict major trend moves. Which is why I would like to share this script (strategy) with you all!
Looking at the stats it looks amazing! 100% profitability - who doesn't want that?! But that doesn't mean it cannot be improved - I am daily looking into how I can improve this to become even more profitable.
Currently the script have been tested with BTC and ETH:
BTC = 100% profitability and 9 trades since 2016
ETH = 83% profitability and 6 trades since 2016 with a drawdown of $5.
Now - 9 and 6 trades since 2016 isn't many trades but it suites my way of trading perfectly! I aim for the major trends and try to hit the pullbacks as soon as possible.
You can use this script alone or with other complimenting indicators. I like to draw some support and resistance levels for even further verification.
TRIAL OFFER:
Everyone is offered a 15 days trail.
Let me know in the comments if you would like a trail. Please do not PM me for trails.
>> LIMITED TIME OFFER <<
Since this is my first script to publish on TradingView I am offering the FIRST 10 traders a LIFETIME access to the script for a very small price! After that everyone else will be able to buy acces for 1m, 6m, 1y or lifetime (but at a higher price).
So how do you become one of the first 10?! Simpel - just PM me for the details.
I will update this post when the first 10 has been chosen.
>> OBS: I might be away from TradingView up to 24hours at a time because of my job - but don't panic! I will keep track of every message and get back to everyone as soon as possible!
Best regards
Jack

Maverick - Strategy TesterWelcome to the Maverick - Strategy Tester.
This indicator is used for back-testing. Once you have found settings that you like, you can use my other published indicator "Maverick" to set alerts.
How to use: Apply to any chart, on any time frame. You will see LONG and SHORT signals on the chart. A LONG signal represents an entry/buy in, and a SHORT signal represents an exit/sell.
You can use the Maverick - Strategy Tester to scalp on low time frames such as the 5m, 15m, 30m etc. Or use it on higher time frames such as the 1hr, 2hr, 4hr.
You can use regular candles but Heikin Ashi are recommended for better accuracy.
When using Heikin Ashi, I have included a real price line which shows the actual price of the asset/chart at the close of each candle.
You cannot set alerts with this indicator!
Double RSI Strategy(ALMA RSI + Hull RSI)We're back at it with a brand new strategy centered around an Arnaud Legoux RSI and Hull RSI. This one took a lot longer to make than usual, which is the reason there hasn't been any new posts the last week.
The first component of the strategy is the Hull RSI. The Hull RSI is shown in light blue and its upper and lower bounds are plotted as the dark pink and teal horizontal lines. Applying a Hull Moving Average to the RSI results in higher smoothness and less false signals. The lengths of the RSI and the HMA of the RSI can both be adjusted by the user.
We then used a similar process to calculate an Arnaud Legoux Moving Average(ALMA) of the RSI. The ALMA RSI is shown as the solid white line, while its upper and lower thresholds are the green and red horizontal lines. The ALMA RSI is a great tool since it is adaptable for multiple different uses - users can adjust the offset, sigma, and length values to modify the RSI's responsiveness and smoothness.
Input Options for ALMA RSI:
-Offset : Value in range {0,1} that adjusts the curve of the Gaussian Distribution. A higher value will result in higher responsiveness but lower smoothness. A lower value will mean higher smoothness but less responsiveness.
-Length : The lookback for each ALMA calculation.
-Sigma : Defines the sharpe of the curve coefficients.
The entry and exit signals generated by the Hull RSI are represented by the small green(buy) and red(sell) circles, while the green and red vertical highlights are the ALMA RSI's buy and sell signals. By default, we set the pyramiding to 3, with 50% equity used in each trade to allow the ALMA to make the longer-term swing trades and higher frequency trades made with the Hull RSI.
The strategy will be posted on our website, ProfitProgrammers.com, soon. As always, we will be offering 3 day trials for this strategy so feel free to send a quick message to start the trial period!
