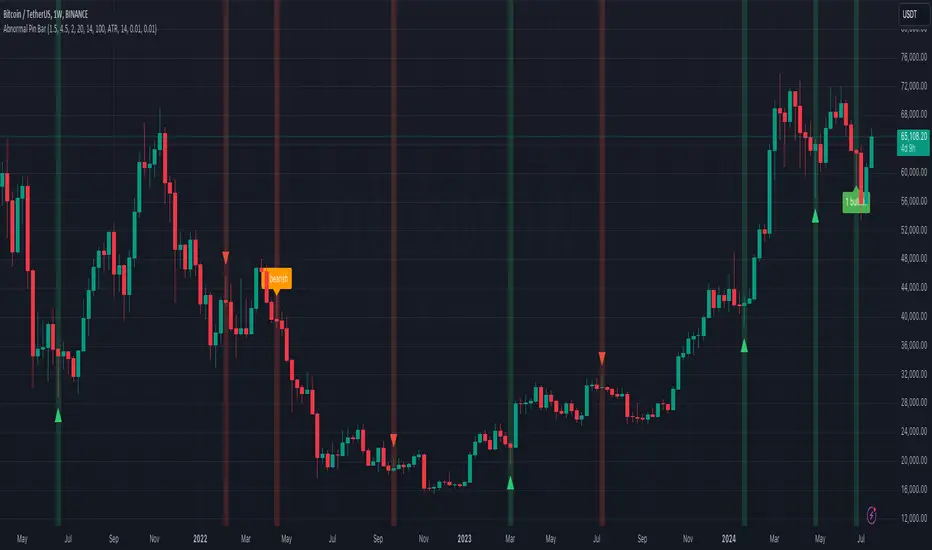
Abnormal Pin BarPin Bar is one of the most important candlestick patterns. Almost every time you see a pin bar, you can expect the price to turn in the opposite direction.
You should pay more attention to the abnormal ones among the pin bars. What I mean by abnormal pin bar is that the long leg is at least 3 times larger than the body.
With this indicator, you can set your own abnormal pin bar settings. The indicator will highlight abnormal pin bars according to the settings you specified.
The indicator uses the following three factors to indicate abnormal pin bar:
- Minimum body ratio in the pattern in percent
- Minimum ratio of the long shadow to the body
- Minimum ratio of the long shadow to the short shadow
Also, there is a volume strength check to confirm the pin bar. If the volume where the pin bar is formed is greater than the 20 volume average, it indicates that the pin bar is more important. Of course, confirming the pin bar with the volume is optional and you can disable it in settings if you wish.
You can use the highlights of this indicator as an entry signal if the pin bar appears at the trend key levels or in support or resistance zones.
ניתוח נרות
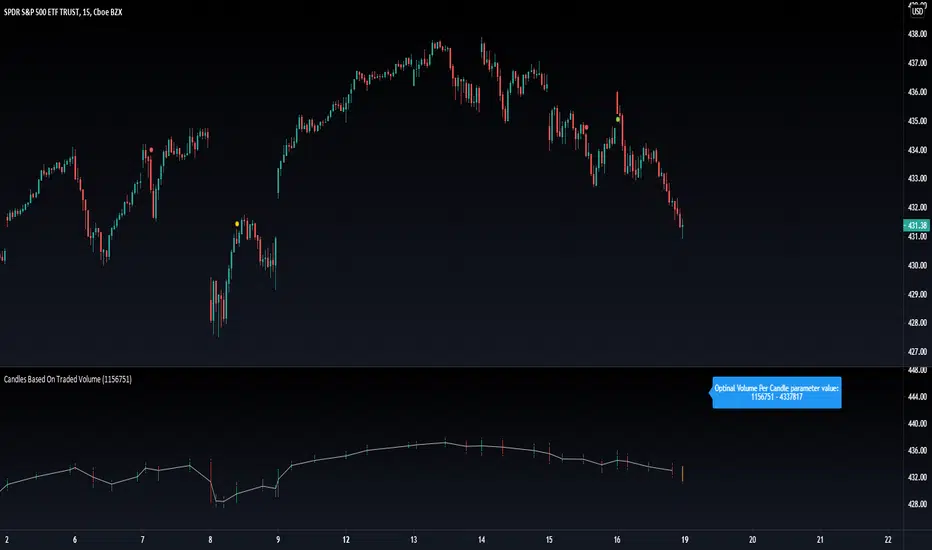
Candles Based On Traded VolumeCBTV - Candlesticks Based on Traded Volume
This is the first robust implementation of volume based candlesticks (bars) on TradingView. This type of bar was describe in the book "Advances in Financial Machine Learning," written by Lopez de Prado, a well-known quant who has managed billions of dollars over the course of his career.
Volume Candlesticks (Bars) are bars that are indexed by total volume, with each set of N shares exchanged forming a separate bar.
This means that on CBTV chart a candle forms not after a specific time interval defined by the time frame of the chart, but when a determined volume was traded.
This approach to price sampling is much better than the time based one, because it does not oversample periods where nothing happens. Traditional candlestick charts show a lot of low volume bars without meaningful price changes in them.
The efficient price sampling results in better results when using volume based bars in machine learning forecasting models. They are also useful for technical analysis. Candlestick patterns on CBTV chart are more pronounced and have more predictive power.
Volume based bars can be constructed only for instruments where volume data is available. These are stocks, futures and crypto currencies.
When you run CBTV it appears in a separate window below the traditional time based chart.
CBTV will be used in pair with a helper indicator which is called Optimal Volume per Candle (OVPC).
When applied to a chart OVPC shows the optimal range for volume per candle to construct volume based candlesticks from this timeframe data. It appears in the blue box above the most recent candle of a standard time based chart.
When you set a Volume Per Candle parameter in CBTV make sure it is within the range that shows OVPC. In this case volume based chart will be easy to read and all the calculations will be performed with the high level of precision.
The most recent unfinished candle is marked with the different set of colors than historical candles. Unfinished candle is colored in orange if it is a falling candle, blue it it is a rising one.
If you leave the CBTV chart opened for a long time you can have multiple blue or orange candles on it. In this case press the “hide” icon with the eye sign twice (it’s on the left side of the indicator panel next to its input parameters). This will refresh the CBTV and remove the artifacts.
While everything comes Real-time you will see the orange or blue bars form but never update. All you need to do is REFRESH THE CHART. Hoping soon to update this with a version you wont have to refresh the chart.
Please drop a like and comment what you guys think and once again thank you Tradingview for such a great platform :)
3B-Play Finder1 - Objective
2 - How to use (Theory)
3 - How to use (Grade System)
4 - Inputs
5 - Extras and Alerts
6 - Notes
Objective
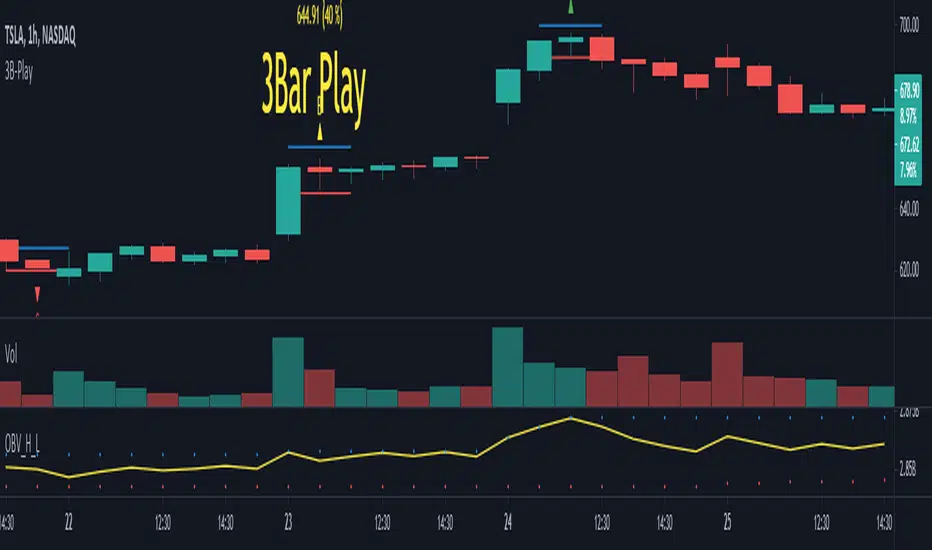
This script aims to mark 3 Bar play patterns (both short and long) by identifying them on the chart, with an arrow pointing up from long and down for short. Aswell, setting alerts based on grade.
Following the base concept, this script comes with a "grade" system (A, B, C), which aims to classify 3B-Play according to input parameters.
2 - How to use (Theory)
The pattern is described by a wide range Ignite bar followed by a narrow resting bar.
Long
Given a 3 Bar play pattern, with a wide range green bar, the entry point should be above the ignite and narrow bar wicks (high) with stop loss set below the resting bar wick low but within ignite wide range bar.
The exit depends on the chart analysis, and there is no set rule for it.
Short
Similar to long but is with a wide range red bar and entry is defined on wick low and stop-loss at wick high.
3 - How to use (Grade System)
Since 3B-play come in all sort of shapes, some are "textbook" perfect, others a bit more "loose". I set a grading system, to differentiate each one.
The way the 3 Bar play quality is determined is based on the percentage size of the resting bar in relation to igniting bar size, starting from de close. An example of how this works is the following. Note: enabling the extra draws lines helps visually to adjust the grades to your preference.
4 - Inputs
3B Quality section
Enable/disable each grade.
CONTROL LONG / SHORT
Set the percentage values for each grade.
Extras
Enable/Disable extra plots.
5 - Extras and Alerts
This script comes with an extra section, enabling it, draws lines on the max and min values, as well, showing the values in text and the set percentage.
Also, you can set alerts based on the grade and short/long, note you should set the alert to bar close to avoid pre-trigger warnings.
6 - Notes
The script can be shorted a lot, by only looking for a single 3 bar play, to less than 30 lines.
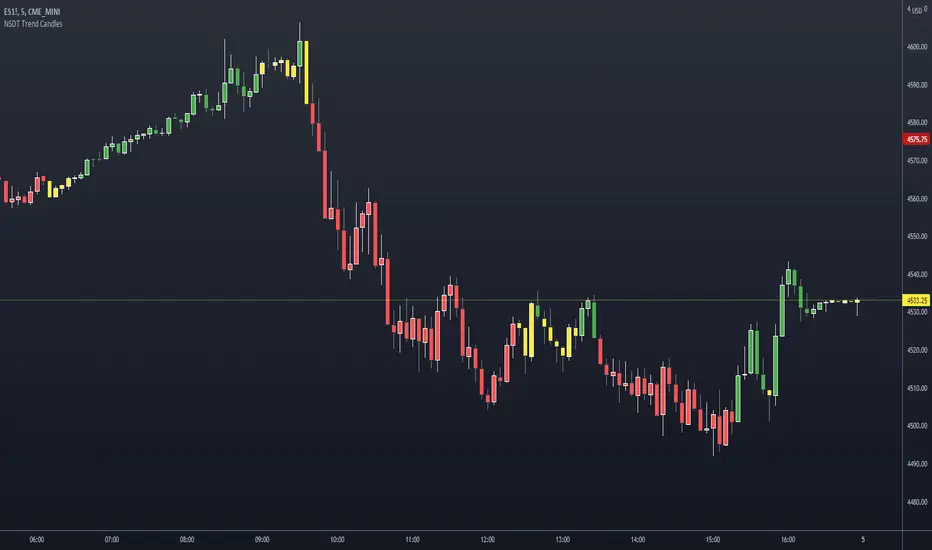
NSDT Trend CandlesThis script changes the color of the candles based on uptrend (green), downtrend (red), neutral/chop (yellow). It uses an ATR and Pivots to determine the direction, or lack of. Since all markets move differently and market volatility changes, you will need to adjust the settings to find a potential match for the day. It's pretty simple to use. Just enter in the direction of the trend and exit (or reverse) when the candle color changes.
Common Candlestick PatternsCommon Candlestick Patters Highlighter.
- TLS: Three Line Strike (Bearish and Bullish)
- AB: Advance Block
- IB: Inside Bar

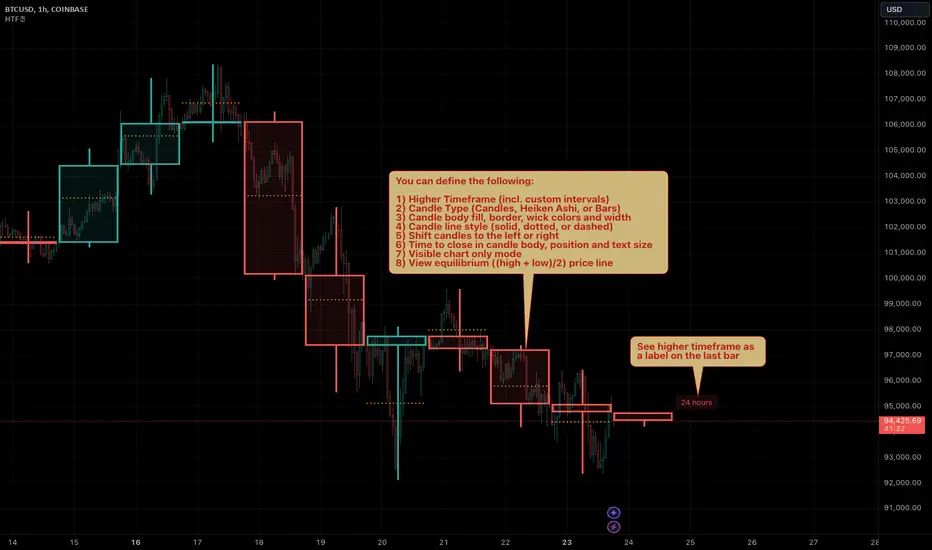
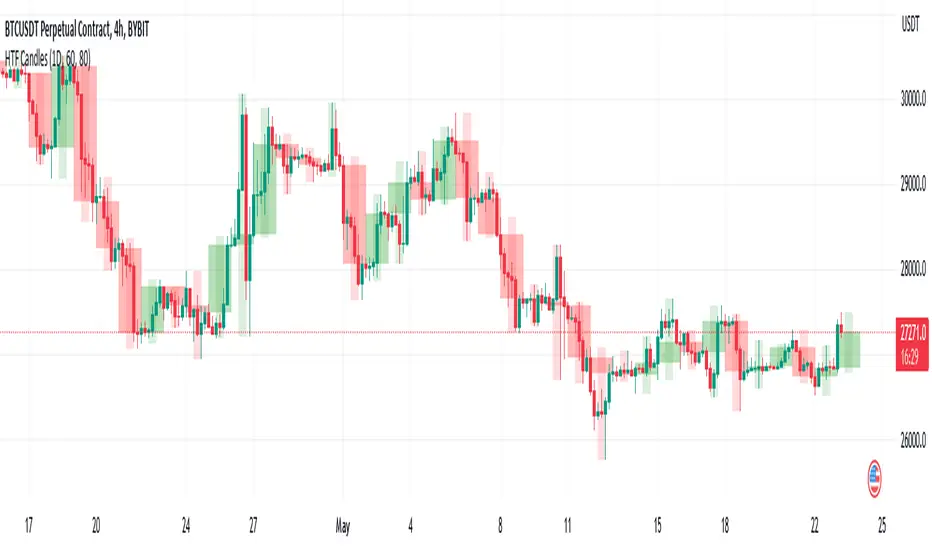
HTF Candles by Prosum SolutionsOverview of Features
This indicator was inspired by the work of "informanerd" in the script called "HTF Candles" as well as the built-in script called "Multi-Time Period Charts" by TradingView. The script will provide a highly customizable interface to specify the higher timeframe resolution for the candlesticks, the type of candle, as well as various styling options for the body, borders and wicks.
Usage Information
The indicator can be applied to any chart at any time frame, but resolutions less than 1 minute may demonstrate gaps between bars and the candles may not render properly.
When the "Same as chart" option is chosen for the "Resolution" field, the indicator will attempt to find a higher timeframe resolution to ensure the candlesticks are drawn.
Enjoy! 👍
Fair Value Gap / FVG - HTF Orderflow bias / trendCalculates Fair Value Gap (FVG) as a counter and plots it below price.
FVG Counter value resets to +ve or -ve once the FVG counter reverses direction.
Use this script to find a bias to trade with.
Best used on HTF (like 1W, 1D), so the bias can be transferred to LTF (like 4H, 1H).
If you end up using this script, please leave a comment below on how you used it. I can try to incorporate those ideas in an update.
Cheers!

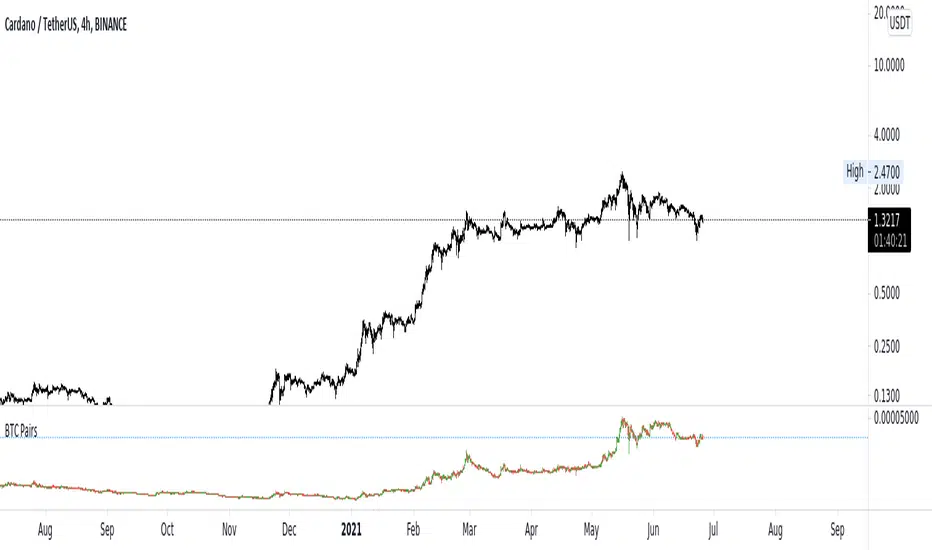
BTC PairsHi Crypto traders,
As many of you, while trading in altcoins, it is important to look at their BTC pairs also. That is why I created a script like this.
It works under these conditions:
1- The coin you are looking for must have BTC pair in the exchange of the chart. ( If an exchange does not have ADABTC while it has ADAUSDT, the script wont work )
2- The pair in that exchange must be concatenated as follows "PAIR_NAME" + "BTC" in tradingview. Ex: "ADA" + BTC" = "ADABTC"
If you have any questions or suggestion, I would be glad to hear and answer them.
Stay Safe.
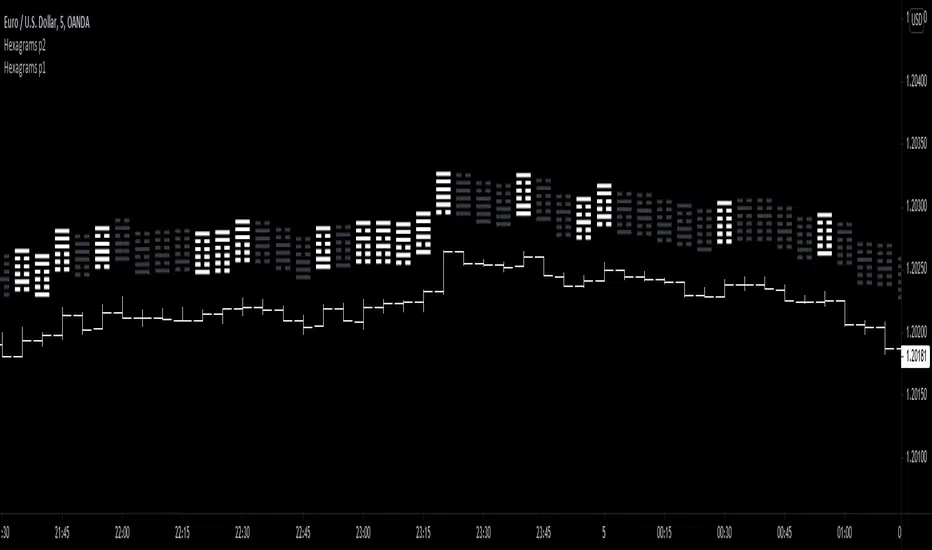
I Ching Hexagrams Part 2IMPORTANT!
Get the other indicator I Ching Hexagrams Part 1 for the full set!
Here is the first half of the I Ching's hexagrams.
Each candle generates a hexagram at close, based on that candle and the previous 5.
A green candle is yang and a red candle is yin.
In this way, price action generates a hexagram.
Use this to generate a hexagram for the day or even to find interesting patterns to trade.
Have fun!
I Ching Hexagrams Part 1IMPORTANT!
Get the other indicator I Ching Hexagrams Part 2 for the full set!
Here is the first half of the I Ching's hexagrams.
Each candle generates a hexagram at close, based on that candle and the previous 5.
A green candle is yang and a red candle is yin.
In this way, price action generates a hexagram.
Use this to generate a hexagram for the day or even to find interesting patterns to trade.
Have fun!

SL Hunter Tracker SL Hunter Tracker
coded by Bogdan Vaida
SL Hunter Tracker is a meticulous hunter that tracks SL hunters.
First it plots the fractals on the chart, then it draws lines from them
to the last wick that touched that height. You can add sweep alerts, once
per bar close, so that you get notified when a wick was touched.
Tested on: EURUSD 30'
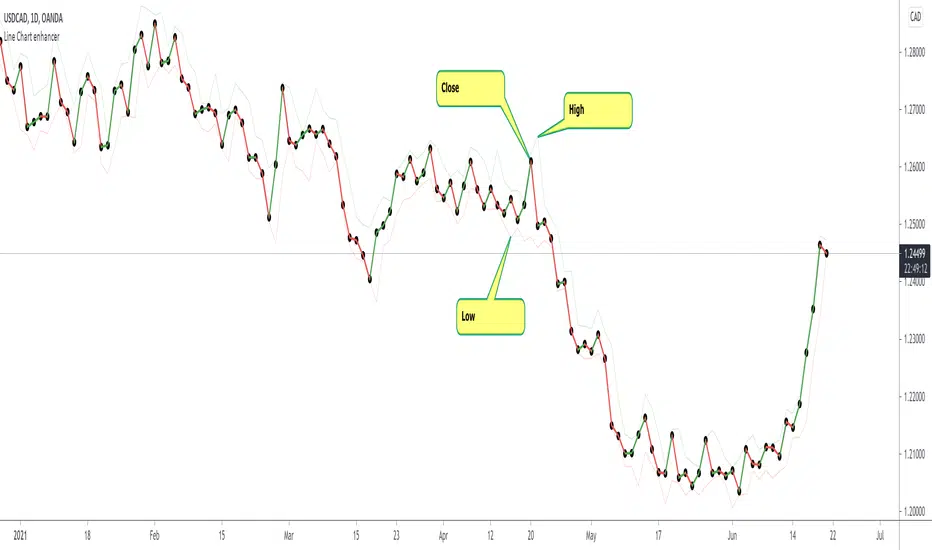
Line Chart Enhancer by makuchakuTradingview has a good line chart, but I wanted to make it even more awesome.
Some shortcomings which this line chart enhancer script fixes
Colors up move as green, down move as red (you can change them as you like)
Plots high and low - so that one can be aware about what the price is doing
To achieve the look with markers as shown above
Goto Symbol settings > Type > Select "With Markers"
Feedback welcome!
Wide BarsSimple scripts show the wide range bars within in the look back period, visualizing the bigger momentum.
Added four exponential moving averages which define the trend of the instrument.
Wide range candles in the direction of overall trend on higher timeframes; give confluence of higher participation in the same direction.
Note : Decent volume above the average volume with wide range candle adds more value.

RSI Signals by HBRELATIVE STRENGTH INDEX (RSI)
This is a tool that is widely used
Especially for Overbought and Oversold systems, but I have made some changes in this indicator,
How to use it...!
I have set it as the default setting
- RSI Length: 7
- Overbought: 70
- Oversold: 30
What is unique about this tool?
we can see 3 conditions:
1) RSI Overbought / Oversold with Bullish Engulfing / Bearish Engulfing
2) RSI Overbought / Oversold with Hammer and Shooting Star
3) RSI Overbought / Oversold with 2 Bullish Bars / 2 Bearish Bars
4) RSI Overbought / Oversold with All Patterns at the same time
When the RSI reaches its Oversold line, the code will wait for Bullish Engulfing pattren , when oversold and Bullish engulfing matched, This indicator will generate a buy signal when the condition is met,
and same as for Bear market, When the RSI reaches its Overbought line, the code will wait for Bearish Engulfing pattren , This indicator will generate a sell/exit signal when the condition is met,
2nd condition is that a Hammer candle will be waited for when RSI touches the Overbought line, for Bullish Move
and Shooting Star candle will be waited for when RSI touches the Overbought line, for Bullish Move, for Bearish Move
3rd Condition is also the same as Condition 1 and Condition 2,
When the RSI reaches its Oversold line, the code will wait for 2 Bullish Bars , when oversold and 2 Bullish Bars matched then this indicator will generate a buy signal, and same as for Bear market,
When the RSI reaches its Overbought line, the code will wait for 2 Bearish Bars , when overbought and 2 Bearish Bars matched then this indicator will generate a Sell signal,
4th Condition is that we can use All Conditions at the same time,
- Bullish Engulfing / Bearish Engulfing
- Hammer and Shooting Star
- 2 Bullish Bars / 2 Bearish Bars

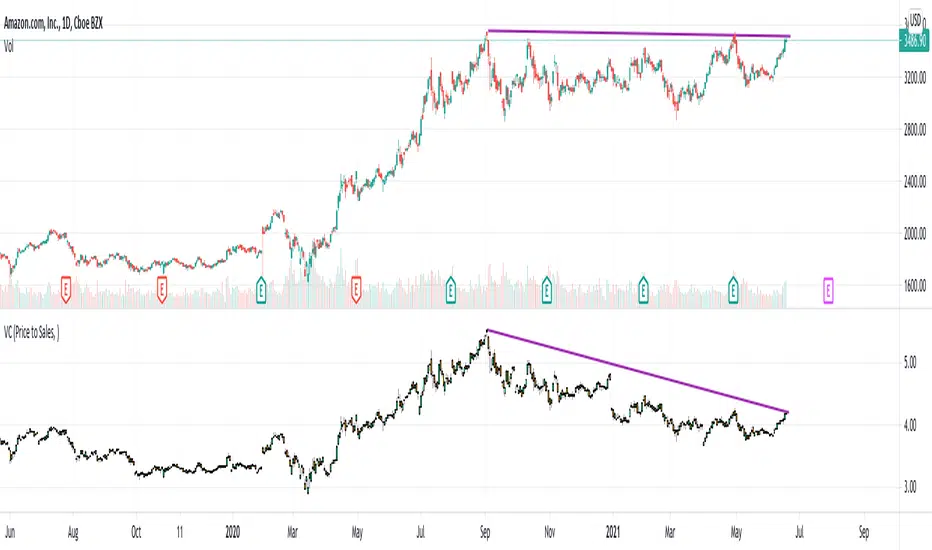
Value CandlesCreating candles from value stats as an experiment. These candles will almost always follow price candles except when there is a deviation.
Strategies based on buying the dips can be applied better on value candles. This is because, drop in value candles imply real bargain whereas drop in price candles can also be due to some other factors.
We can clearly see in the Amazon chart that value candles have come down even though price candles are at same level from September. This signifies AMZN stock is having more value now (due to increased sales from September to now) than back in September even though the price is same.
Another simple thing we can do is move Value candles into same overlay as that of price candles. This will look something like this:
Key thing to remember : Lower the value candle higher the relative value of stock.
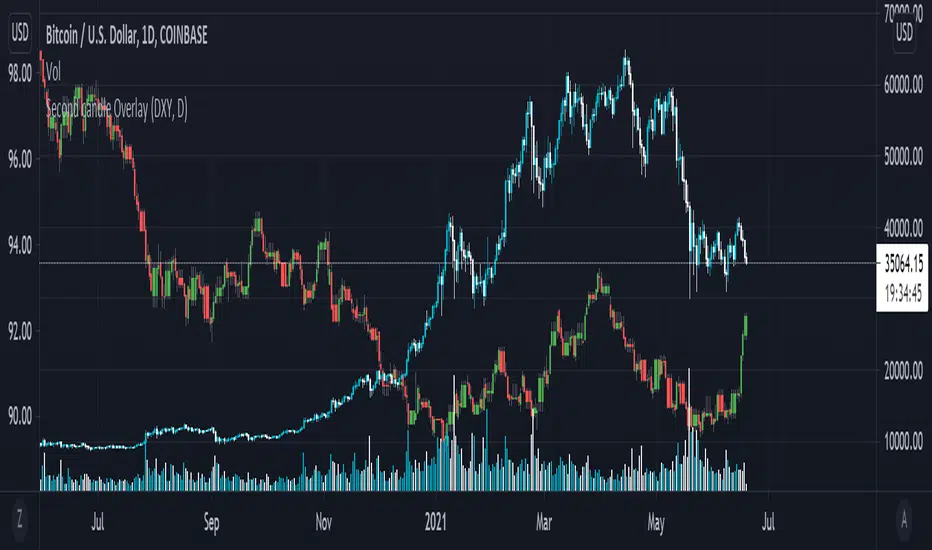
Secondary Candle OverlayThis simple script is meant to allow the user to select another symbol to add onto their chart and plot the candlesticks for that symbol at the selected resolution requested.
Please see the tooltip provided by the 'Secondary Symbol' input for more details with regards to properly using this script on symbols that have vastly different valuations, it will help with getting the symbol requested to scale properly with the primary symbol on the chart.
The user may also input which colors are used for bullish/bearish candles as well as the symbol itself and its resolution.
IMPORTANT NOTE: THIS SCRIPT DOES NOT ACCOUNT FOR SYMBOLS THAT ARE NOT CONTINUOUS (The defval for the symbol is TVC:DXY which closes on weekends whereas a cryptocurrency like Bitcoin does not stop trading ever; candles on these kinds of markets will be repeated when overlaid onto markets that do not have this property.)
Trigram (I Ching)This script generates a Trigram for the current candle at its close.
The idea is simple. It takes the current candle close and the two previous to generate the lines of the Trigram.
In traditional I Ching practices, these are built bottom up. So in this case, the Candle in 2 bars back is the base, 1 bar back is the central line and the current close is the top.
Up candles are yang lines, down candles yin.
Anyways, not sure what use it is yet, but if there is anyone else out there interested in I Ching, Yin/Yang theory and trading, this is for you.

Vertical line by bar_indexThis indicator helps in letting the trader focus on a particular date/candle across many symbols.
Tradingview currently has a bug in Bar Replay - when we switch symbols, the bar replay resets.
Hence if you are backtesting & running through a bunch of symbols, it is nearly impossible to focus on a particular historical candle across all symbols.
This indicator plots a vertical line on a given bar_index which remains as it is while you are switching symbols.
Feel free to copy, modify and use as you like!

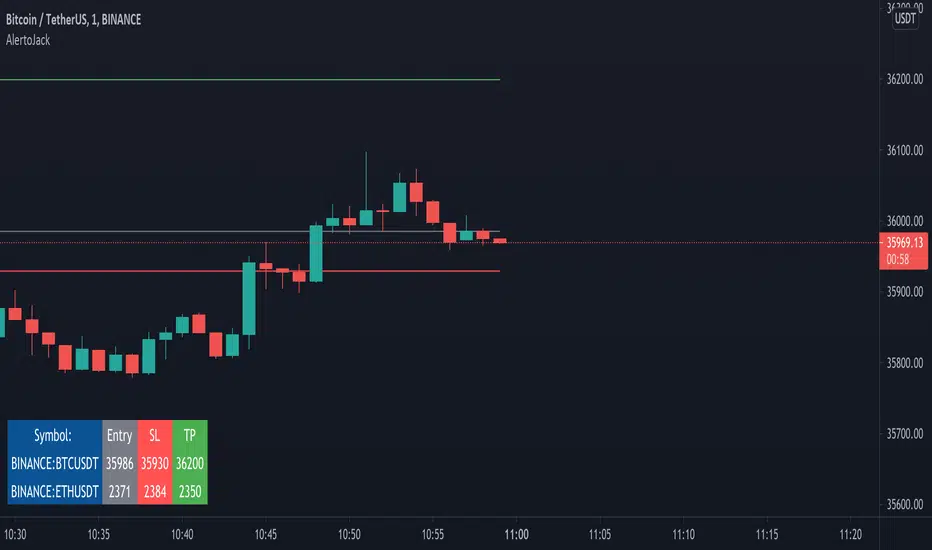
AlertoJack AlertoJack
v0.1a
coded by Bogdan Vaida
This indicator was created to provide easily defined alerts on multiple symbols.
It's still POC code.
Usage:
- Add it on any coin,
- The chart timeframe will be the timeframe for the alerts;
- Configure it with the symbols you want to be alerted on,
- Add the prices to be alerted for,
- Use Add Alert -> condition AlertoJack -> "Any alert() function call"
- Check the Alerts log.
Notes:
- Alert happens when candle crosses the price.
- Because of how Trading View functions, if you modify the indicator settings
you'll need to add the alerts again (because an alert uses the code version
it was created from).
- The alert runs once per current bar's timeframe (e.g. once per minute
if you're on the 1m).
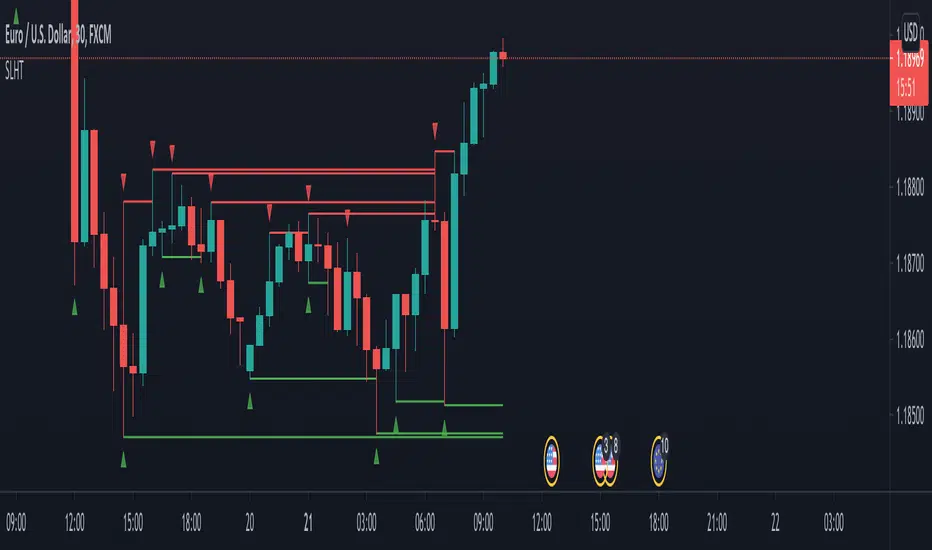
Swing Failure Pattern Inquisitor SFP Inquisitor
v0.2a
coded by Bogdan Vaida
Code for Swing High, Swing Low and Swing Failure Pattern.
Note that we're still in the alpha version, bugs may appear.
Note that the number you set in your Swing History variable
will also be the minimum delay you see until the apples appear.
This is because we're checking the forward "history" too.
The SFP will only check for these conditions:
- high above Swing History high and close below it
- low below Swing History high and close above it
In some cases you may see an apple before the SFP that "doesn't fit"
with the SFP conditions. That's because that apple was drawn later and
the SFP actually appeared because of the previous apple .
20 candles later.
Legend:
🍏 - swing high
🍎 - swing low
🧺 - candle where the last swing was driven from
🍌 - swing failure pattern
🍎🍌 - hungry scenario: swing low but also a SFP compared to the last swing

Indecision indicatorIndecision is calculated based on ratio of wicks-body to full candle.
Similarly price rejection is calculated based on ratio of upper wicks to candle and lower wicks to candle.
In both cases sum of stats from last N candels are used to get smoother output. Coloring of indecision candle is based on two bollinger bands with different standard deviations. It can be set in input settings.

HTF CandlesThis draws candlesticks from higher time frames on the current chart. I tried to keep the script simple using some newly introduced Pine capabilities.
To change the options like the higher time frame and candle colors, check the indicator settings.
Looking forward to your opinions!
Awesome Heikin Ashi [Morty]This indicator uses Heikin Ashi candles and two EMAs to help you follow the trend and enter the trade. Heikin Ashi candles help to smooth the price and EMAs are used to detect trend. The default parameter of EMA is EMA10 and EMA20. You can use it at any timeframe. You should always adjust the EMA length according to different timeframes.
Features:
- Highlight background based on two EMAs
- Adjustable EMA length
- Adjustable Label size
- Show entry and exit signal labels
- Show stoploss price
- You can choose Long only or Short only or both signals
- Alert functions for notification
NOTE: If you use this signal to enter a trade, make sure the candle is close and enter in the next candle.
