Unfilled Gap DetectorThis indicator displays gaps on a chart within a specified range which have not been filled. It offers the ability to set the minimum gap size to detect as a multiple of the average true range (ATR), as well as the allowed distance from a gap fill for the gap to be considered filled. The use of ATR allows the gap threshold to dynamically change as the stock price and volatility change over time. Lastly, it offers the ability to show gaps which have been filled in addition to unfilled gaps.
The following describes each input's effect on the indicator.
Bars to Search Back: specifies how many bars back in the chart to search for gaps and gap fills (maximum 5000).
ATR Length: specifies the length of the ATR() function used for thresholding
Minimum ATR Multiple For Gap Detection: The minimum gap size as a multiple of the ATR
Minimum ATR Multiple For Gap Fill: The minimum distance between a bar high/low and a gap for it to be considered "filled" as a multiple of ATR
ניתוח נרות

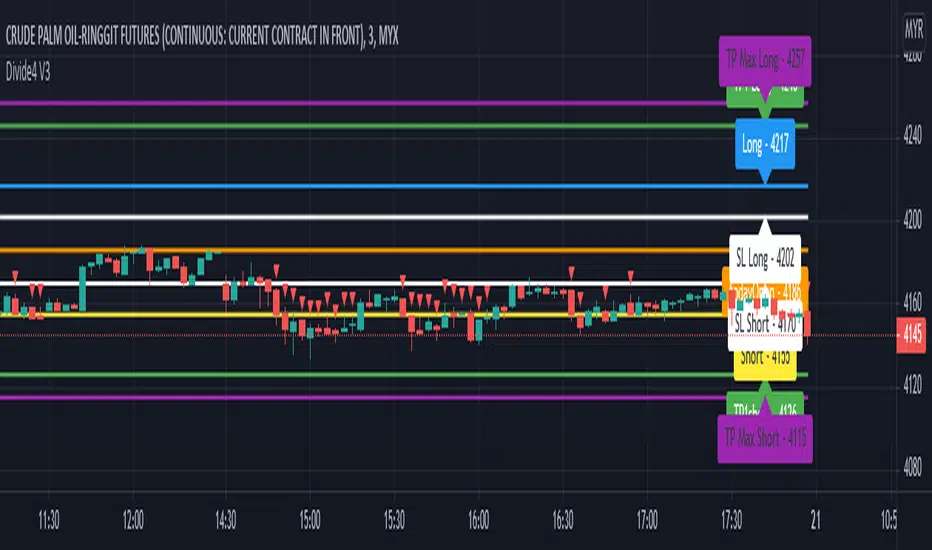
Divide4 V3This script is specially developed for the reference of Crude Palm Oil Futures (CPO) market traders.
Before using this script, traders need to know a few important things, namely:
1. Use of this script is limited to the Crude Palm Oil Futures (CPO) market only;
2. The appropriate time-frame for the purpose of using this script is a small time-frame, i.e. 1 minute to 5 minutes;
Procedures for using indicators.
1. Once the market opens, change the time-frame to 1 minute;
2. The line on the trading day will only be known after the first candle is completed, i.e. at 10.31 am;
3. Then, you can key in order if you want;
4. Let the 1 minute time-frame remain until 11 a.m. Then, you can change a larger time-frame such as 3 minutes or 5 minutes if desired.
Entry.
1. The recommended Max Entry is once Long and once Short only on the same day;
2. If the first Entry reaches Profit Target, it is not recommended to make an Entry for the second time;
3. If the first Entry is about Stop Loss, the second Entry is recommended as opposed to the first Entry.
For example, if the first Entry is Long, but does not reach Profit Target, otherwise it is about Stop Loss, then the recommended second Entry is Short, even though the price is about Entry for Long.
Long.
1. Traders can only make a purchase when the market price hits the blue line;
2. If traders hold a long position, traders can make a sale to close the long position when the price hits the green or purple line closest to the blue line;
3. On the other hand, if the price goes down again after a buy is made, traders need to make a sale to close the buy position when the price goes down to hit the white line closest to the blue line.
Short.
1. Traders can only make a sale when the market price hits the yellow line;
2. If traders hold a short position, traders can make a purchase to close the short position when the price hits the green or purple line closest to the yellow line;
3. On the other hand, if the price rises again after the sale is made, then traders need to make a purchase to close the selling position when the rising price hits the white line closest to the yellow line.
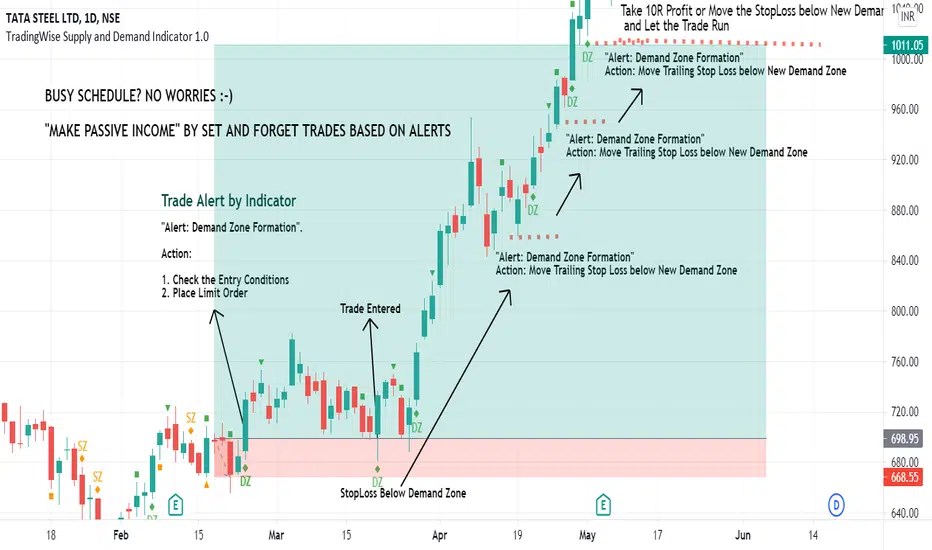
TradingWise Supply and Demand Indicator 1.0TradingWise Supply and Demand Indicator 1.0 is based on the Price Action candlestick patterns to identify the Supply and Demand zones in the charts (Areas of liquidity). It works on all Timeframes and Asset Classes. This Script helps the traders to identify the demand and supply zones with identifications on the candle stick patterns indicating the origin of the Strong move. Also it generates Alerts automatically once the supply or demand area is formed thus by reducing the hours spent on the charts and reducing the missed trade Opportunities as well. This Indicator is extremely helpful for those on Full time Jobs/ Busy Schedule.
Buy/Sell Alerts by Indicator:
Green Diamond + DZ Sign ---> Indicates the Demand Zone Formation. Place Buy Trade upon Entry Criteria Met
Orange Diamond + SZ Sign ---> Indicates the Supply Zone Formation. Place Sell Trade upon Entry Criteria Met
DAYOFWEEK performance1 -Objective
"What is the ''best'' day to trade .. Monday, Tuesday...."
This script aims to determine if there are different results depending on the day of the week.
The way it works is by dividing data by day of the week (Monday, Tuesday, Wednesday ... ) and perform calculations for each day of the week.
1 - Objective
2 - Features
3 - How to use (Examples)
4 - Inputs
5 - Limitations
6 - Notes
7 - Final Tooughs
2 - Features
AVG OPEN-CLOSE
Calculate de Percentage change from day open to close
Green % (O-C)
Percentage of days green (open to close)
Average Change
Absolute day change (O-C)
AVG PrevD. Close-Close
Percentage change from the previous day close to the day of the week close
(Example: Monday (C-C) = Friday Close to Monday close
Tuesday (C-C) = Monday C. to Tuesday C.
Green % (C1-C)
Percentage of days green (open to close)
AVG Volume
Day of the week Average Volume
Notes:
*Mon(Nº) - Nº = Number days is currently calculated
Example: Monday (12) calculation based on the last 12 Mondays. Note: Discrepancies in numbers example Monday (12) - Friday (11) depend on the initial/end date or the market was closed (Holidays).
3 - How to use (Examples)
For the following example, NASDAQ:AAPL from 1 Jan 21 to 1 Jul 21 the results are following.
The highest probability of a Close being higher than the Open is Monday with 52.17 % and the Lowest Tuesday with 38.46 %. Meaning that there's a higher chance (for NASDAQ:AAPL ) of closing at a higher value on Monday while the highest chance of closing is lower is Tuesday. With an average gain on Tuesday of 0.21%
Long - The best day to buy (long) at open (on average) is Monday with a 52.2% probability of closing higher
Short - The best day to sell (short) at open (on average) is Tuesday with a 38.5% probability of closing higher (better chance of closing lower)
Since the values change from ticker to ticker, there is a substantial change in the percentages and days of the week. For example let's compare the previous example ( NASDAQ:AAPL ) to NYSE:GM (same settings)
For the same period, there is a substantial difference where there is a 62.5% probability Friday to close higher than the open, while Tuesday there is only a 28% probability.
With an average gain of 0.59% on Friday and an average loss of -0.34%
Also, the size of the table (number of days ) depends if the ticker is traded or not on that day as an example COINBASE:BTCUSD
4 - Inputs
DATE RANGE
Initial Date - Date from which the script will start the calculation.
End Date - Date to which the script will calculate.
TABLE SETTINGS
Text Color - Color of the displayed text
Cell Color - Background color of table cells
Header Color - Color of the column and row names
Table Location - Change the position where the table is located.
Table Size - Changes text size and by consequence the size of the table
5 - LIMITATIONS
The code determines average values based on the stored data, therefore, the range (Initial data) is limited to the first bar time.
As a consequence the lower the timeframe the shorter the initial date can be and fewer weeks can be calculated. To warn about this limitation there's a warning text that appears in case the initial date exceeds the bar limit.
Example with initial date 1 Jan 2021 and end date 18 Jul 2021 in 5m and 10 m timeframe:
6 - Notes and Disclosers
The script can be moved around to a new pane if need. -> Object Tree > Right Click Script > Move To > New pane
The code has not been tested in higher subscriptions tiers that allow for more bars and as a consequence more data, but as far I can tell, it should work without problems and should be in fact better at lower timeframes since it allows more weeks.
The values displayed represent previous data and at no point is guaranteed future values
7 - Final Tooughs
This script was quite fun to work on since it analysis behavioral patterns (since from an abstract point a Tuesday is no different than a Thursday), but after analyzing multiple tickers there are some days that tend to close higher than the open.
PS: If you find any mistake ex: code/misspelling please comment.

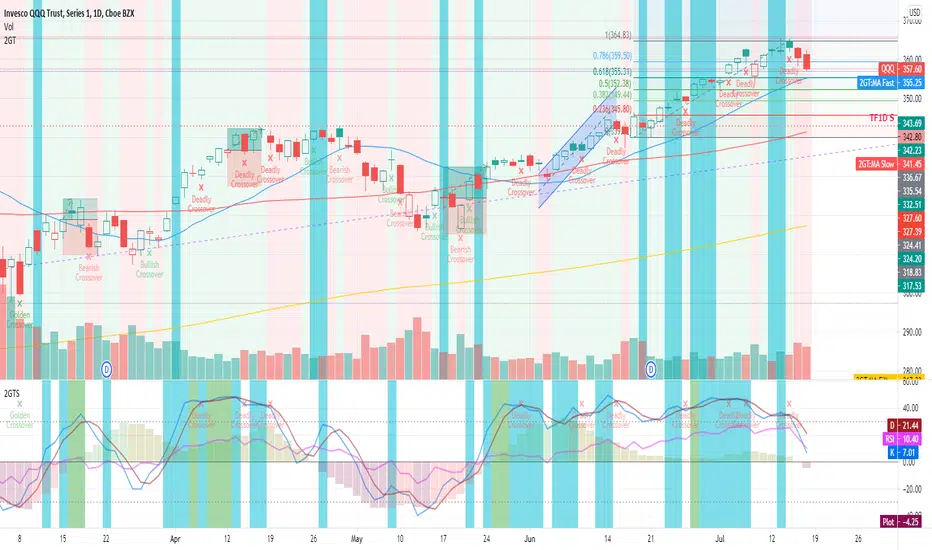
2nd Grade TechniqueThis is comprises of multiple popularly used indicators to help decide on whether to go long or short. This indicator will overlay the MA lines and background colours on your chart.
The heikin-ashi colour will be shown as the background colour. This will help you identify a trend more easily while using bars, candles, hollow candles, etc. When the background is green, it means that it is a green HA and vice versa.
The blue MA line is for showing the short-term trend. The red MA line is for showing the medium-term trend. You can select the moving average flavour of your choice in the settings.
The yellow MA line is the long-term trend that is mainly used as a filter to indicate bullish/bearish trend. The MA type for this filter can be different from the short/mid term MA.
This indicator will also show Stochastic crossovers (GC, DC, BC) on the chart. This will help to always keep your eye on the chart candles.
In the settings, you can also turn on/off bullish/bearish signals.
Rules for bullish signals on this indicator:-
1. MA: Blue > Red > Yellow (FastMA > SlowMA > FilterMA)
2. Stochastic: K > D and both are heading upwards
3. 2nd Green HA
When 2 out of the 3 rules are met, the candle background will be Aqua in colour. When all 3 rules are met, the candle background will be Green .
Rules for bearish signals on this indicator:-
1. MA: Yellow > Red > Blue (FilterMA > SlowMA > FastMA)
2. Stochastic: D > K and both are heading downwards
3. 2nd Red HA
When 2 out of the 3 rules are met, the candle background will be Orange in colour. When all 3 rules are met, the candle background will be Red .
Do note that you can show/hide any of these elements via the settings.
If you find this useful, do smash the LIKE and FOLLOW button.
WSLM
Narrow Range (NR) IndicatorNarrow Range (NR) trading strategy is a breakout-based method that assumes that the price of security trends up or down after a brief consolidation in a narrow range. This indicator can plot:
1. Narrow Range (NR) 4, 7, and 21
2. Narrow Range (NR) 4, 7, and 21 + Inside Bars (IB)
NR 4/NR 7/NR 21 day acts as a confirming factor on where the price will move further. Breakout of NR 4/NR 7/NR 21 candle with high volumes indicates bullishness, while the breakdown candle indicates bearishness.

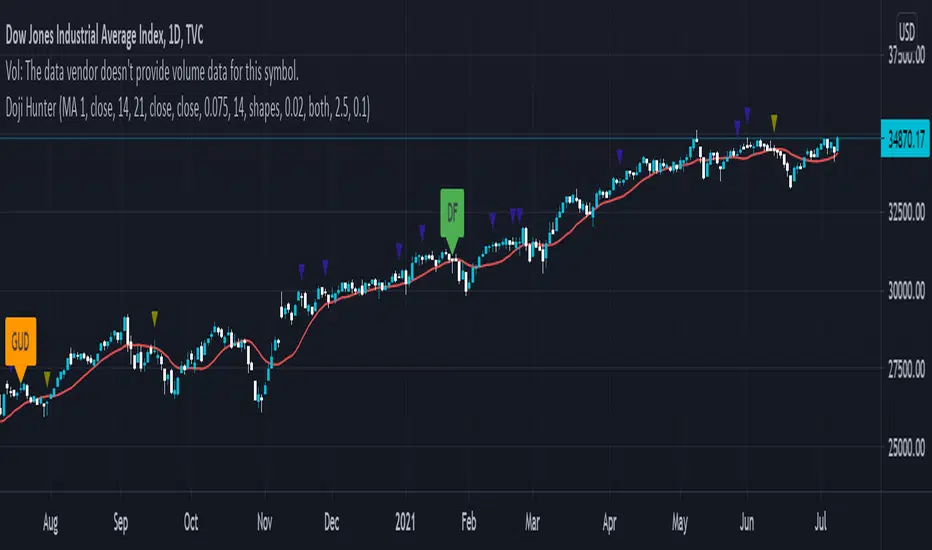
Doji Hunter█ OVERVIEW
This script is built to search for 8 different Doji candlestick patterns in markets and makes them appear on screen with bar coloring and creating color-coded labels/shapes. It will identify the following variants based upon user input for various rules to abide by:
Gapping Up
Gapping Down
Gravestone
Dragonfly
Long-Legged
Rickshaw Man
Northern (Doji in uptrend)
Southern (Doji in downtrend)
Note: for the remainder of this description, the types for inputs will be marked by italic text.
█ OPTIONS
This script features a wide range of options available to the user to modify how it functions. The first set of inputs dictate how the trend analysis is done with moving averages. The second and third sets of inputs dictate specific rules for how Doji candles are analyzed and the colors used for when they appear.
█ INPUTS (short)
1 — Moving Average Rules:
The Northern and Southern Doji variants require some trend analysis which will be done by Moving Averages. The inputs in this section change various things about the moving average(s) to be used. In the second section of inputs, there is one boolean option that will nullify the need for trend detection and consolidates the Northern and Southern Doji variants into one.
2/3 — Doji Rules and Colors:
The next two sections of inputs correspond to the various rules that dictate how various doji variants will be analyzed, as well as the colors that correspond to each variant. The colors will also apply to each of the labels/shapes used.
4 — Diagnostics:
The last boolean will allow the user to see extra detail with regards to how and when dojis are detected. Note: This is not a part of any prior section and is simply included as a last functional item to the list of all inputs.
An example of multiple labels being shown on screen for various types of Dojis (DJI 1D chart):
█ INPUTS (extended)
1 — Moving Average Rules:
This section consists of 10 different inputs specific to the rules on how the moving average functions for trend analysis.
"Trend Rule" ( string list) determines which Moving Average will be used for trend detection. It has 3 options: "MA 1", "MA 2", or "BOTH". The second input "Trend Source" determines which OHLC (or combination) value to use in comparison to either MA 1 or MA 2 (EX: Trend Rule -> "MA 1" and Trend Source -> "close": if close > MA 1 -> uptrend, downtrend otherwise). If "BOTH" is selected then "Trend Source" is ignored and added nuance in the script ensures that the shorter MA being above the longer MA yields an uptrend (downtrend otherwise).
The next 8 inputs focus on 4 different parts of both MA 1 and 2.
Length ( integer(s) )
Color
Switch between SMA/EMA ( boolean(s) )
Source for MA
Note: Additional attention to detail has been made here as trend direction is ignored if "BOTH" is selected for the MA Rules and the lengths of both Moving Averages are set to be the same.
2/3 — Doji Rules and Colors:
The next two sections include 19 inputs that are related to how this script will analyze and identify the different variants of Doji candles.
"Identify Pattern On Close" ( boolean ) modifies which candles are to be used for determining when Doji candles are recognized. This changes an offset used for historical reference on some global variables which will force the script to only identify patterns after the current candle has closed.
"Doji Body Tolerance" ( float ) tells the script the maximum % the candle body may be of the high-low range to be considered a Doji candle.
"Doji Wick Sample" ( integer ) defines how many prior candles to sample from in calculating the current average upper and lower wick sizes.
"Simplify Northern/Southern Dojis" ( boolean ) makes this script ignore trend direction for Doji detection and consolidates Northern and Southern Dojis into being recognized as the same. This has an added effect of removing the plotted moving averages from the screen.
"Northern/Southern Display" ( string list ) that has multiple options for how Northern and Southern Dojis will be displayed on screen. Because of how labels may be extremely taxing on TradingView's servers to display, the default setting is "shapes" where Northern and Southern (N/S) Dojis will be marked with a colored triangle at the top of the candle. If "Simplify Northern/Southern Dojis" is true, all N/S Dojis will be marked with an x-cross instead. Other options include "labels" which enables the use of labels accompanied by their respective tooltip and color, or "none" where N/S Dojis will be only noticeable by their changed barcolor.
"Allow Gravestone/Dragonfly Shadows" ( boolean ) allows a bit of additional nuance to the definition of Gravestone or Dragonfly Dojis with small shadows.
"Gravestone/Dragonfly Shadow Tolerance" ( float ) defines the maximum % that the lower wick/upper wick (respectively) may be relative to the high-low range for Gravestone or Dragonfly Dojis to still be considered valid.
"Doji Long Wick Setting" ( string list) is a list of settings for three different ways of confirming if a Doji is Long-Legged. The settings are "one", "two", and "average". These define how many wick lengths of a candle need to exceed the calculated average wick lengths (EX: "both" -> upper wick length > upper wick average and lower wick length > lower wick average). The "average" setting will combine the lengths of both wicks and both prior wick averages, divide both of these sums by 2 and compare them instead.
"Doji Long Wick Tolerance" ( float ) defines how large compared to the averages that wick lengths need to be in order for them to be considered "Long-Legged" (EX: 1.50 -> upper/lower wick needs to exceed 150% the average of previous upper/lower wicks).
"Rickshaw Man Body Placement Tolerance" ( float ) defines how close to the high-low range's midpoint the candle body's midpoint needs to be in order for it to be considered a Rickshaw Man Doji candle instead.
The remaining 9 inputs define the colors to use for differentiating between all Doji variants this script will recognize.
█ USAGE
My hope for this script is that users find this easy to use/understand and will tinker with the input values to better identify Doji candlesticks across a wide range of markets.
Suggestions for changes in the future are welcome.
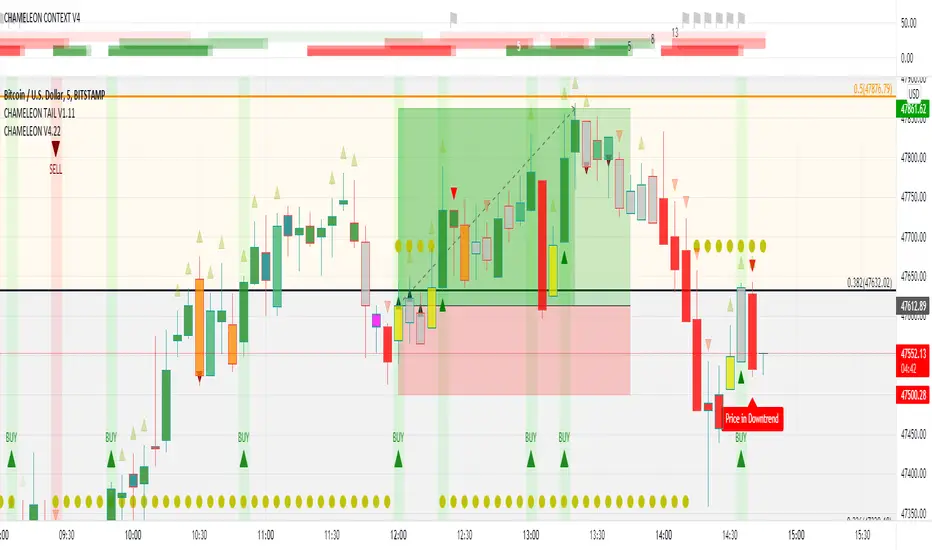
CHAMELEON V3=================
CHAMELEON:
V3 update contains more accurate conditional logic filtering
=================
A price action candle color changing indicator which adds valuable chart information on all timeframes and currency pairs AFAIK.
CHAMELEON changes the colors of the bars based on mathematical sequencing in order to identify trends and relationships between price action. This indicator suggests trade setup ideas with an acceptable probability of success especially if another filter is used such as the time resistant principles of Supply and Demand.
=================
COLOR LEGEND:
=================
MAROON candles can be excellent signals for a SHORT entry. They often act as range markers before a tradeable move down as shown, but also usually are the local top from which price recedes from quickly
FOREST GREEN candles indicate that the price is in an up trend.
RED candles indicate that the price is in an up trend.
YELLOW bars are a useful trigger to close SHORTS. They are also the first condition needed in order for a confirmed trend reversal up to be detected.
GREEN TRIANGLE UP shapes below the candle confirm the trend reversal up which was highlighted by the yellow candle.
RED TRIANGLE DOWN shapes above the candle suggests that the trend is not so strong and the stop loss should be moved up to a tighter position.
ORANGE candles help establish a local range.
ORANGE candles with a golden cross provide a clue of the direction, but are not strong enough indicators to take a trade on.
OLIVE bars are a useful trigger to close LONGS, in order to get a better entry at a lower price near to local resistance level .
MAGENTA candles help establish a local range. Unlike the ORANGE ones, these usually occur at the bottom of price structure.
TEAL Candles, indicate a High in a sequence of 5 candles. They predict a downside reversal of 1-3 bars. This is not usually an entry candle, but a possible LONG exit until the trend is clear again.
SEA GREEN candles indicate that the UP trend is weak.
GRAY signifies NO trend.
MAROON TRIANGLE DOWN shapes below the center of candle body indicates there is momentum to the downside. Use this as a filter to discourage LONG entries and also for a SHORT entry since this is a strong signal.
GREEN TRIANGLE UP shapes above the center of candle body indicates there is momentum to the upside. Use this as a filter to discourage SHORT entries.
=================
SETTINGS and ALERTS:
=================
There is a BAR 2 BAR Relationship setting which displays whether there is a simple relationship between the current bar and the previous. Bars with no Bar2Bar triangle have no relationship. So the info here would be no trend relationship, which is useful because it's not mathematically possible for a trend to start without there being a BAR 2 BAR in that direction first. Since the measurement is so short term, you wouldn't use a B2B in isolation.
The indicator has alert conditions set for the possible ENTRY candles, so you can wait for the GREEN candles on the timeframe you prefer and leave the charts until it arrives. The indicator has been tested on some FOREX markets and BTC and ETH and stands up well across all the usual timeframes.
NVME Breakout DetectorMain Description:
NVME Breakout Detector is an indicator designed for breakout traders that helps those traders simplify trading through saving their time by automatically finding appropriate high and low zones on the chart for the trader. The indicator also provides the user with alerts of newly printed zones and zones that were broken through giving a trader the confirmation to stay in a trade longer or perhaps to find a new trade position following the trend that is shown.
How To Use It?
This is a beginner and user friendly indicator that is simple to follow, firstly the user should add this script on to their charts, secondly they will see 2 generated zones (the high being in red and the low being in green), once the user identifies those zones, the user should wait for price to close past those zones to get the idea that price may want to continue in that direction.
Settings:
Use Higher Accuracy Method - This will add another condition into the zone detection algorithm causing the indicator to detect less zones but these zones will be better for accuracy.
Use Bar Close - This will add another condition into the breakout calculator and alerts, which will force the indicator to wait for the bar to close before any confirmations can take place.
Show Breakout History - This will print all the previous zones and labels for the asset you are on.
Show Breakout Labels - This will show the breakout labels next to each zone and allow the user to see how many times that zone has been broken through or if it hasn't been broken through.
Supported Assets: All Assets Supported
Will This Come With Other NVME Scripts? Yes

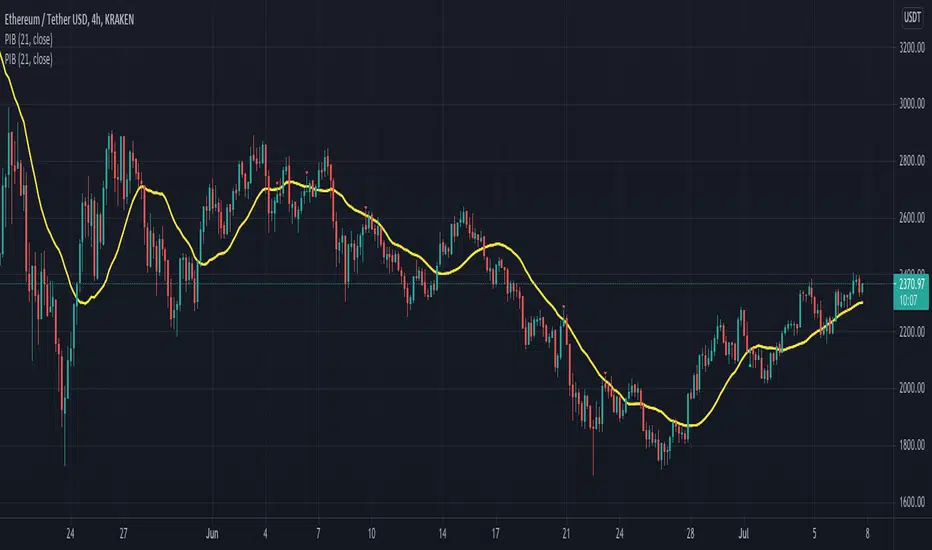
Pinbar-Rejection-IndicatorThis indicator allows you to filter noisy pin bar chart, with pin bars which have been rejected from dynamic support/resistance level also named as 21 Moving Average.
I would consider to work only on higher time frames like 1H and higher, so you really can find only best entries.
Have fun, write your feedback in the comments section:)
P.S This is the first version of the indicator, so be free to contribute, and soon I'm going to improve this indicator.
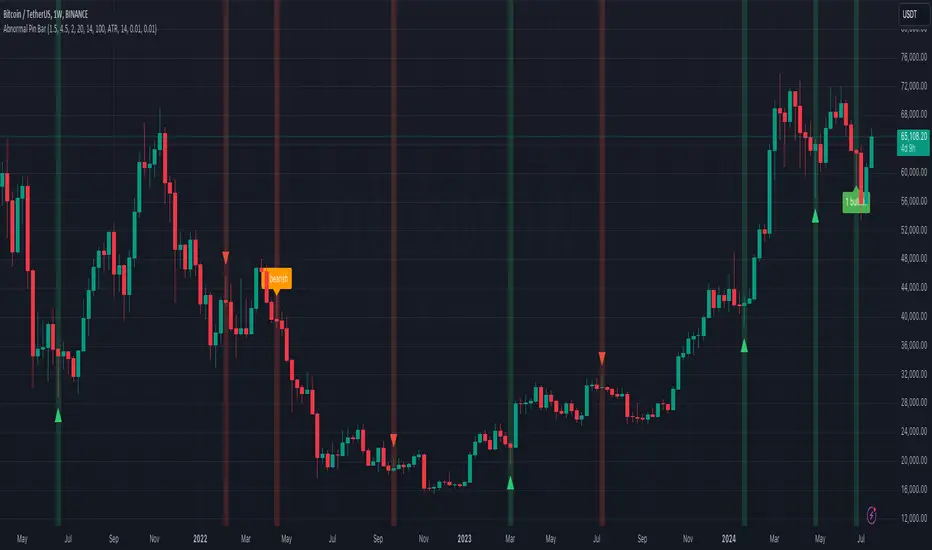
Abnormal Pin BarPin Bar is one of the most important candlestick patterns. Almost every time you see a pin bar, you can expect the price to turn in the opposite direction.
You should pay more attention to the abnormal ones among the pin bars. What I mean by abnormal pin bar is that the long leg is at least 3 times larger than the body.
With this indicator, you can set your own abnormal pin bar settings. The indicator will highlight abnormal pin bars according to the settings you specified.
The indicator uses the following three factors to indicate abnormal pin bar:
- Minimum body ratio in the pattern in percent
- Minimum ratio of the long shadow to the body
- Minimum ratio of the long shadow to the short shadow
Also, there is a volume strength check to confirm the pin bar. If the volume where the pin bar is formed is greater than the 20 volume average, it indicates that the pin bar is more important. Of course, confirming the pin bar with the volume is optional and you can disable it in settings if you wish.
You can use the highlights of this indicator as an entry signal if the pin bar appears at the trend key levels or in support or resistance zones.
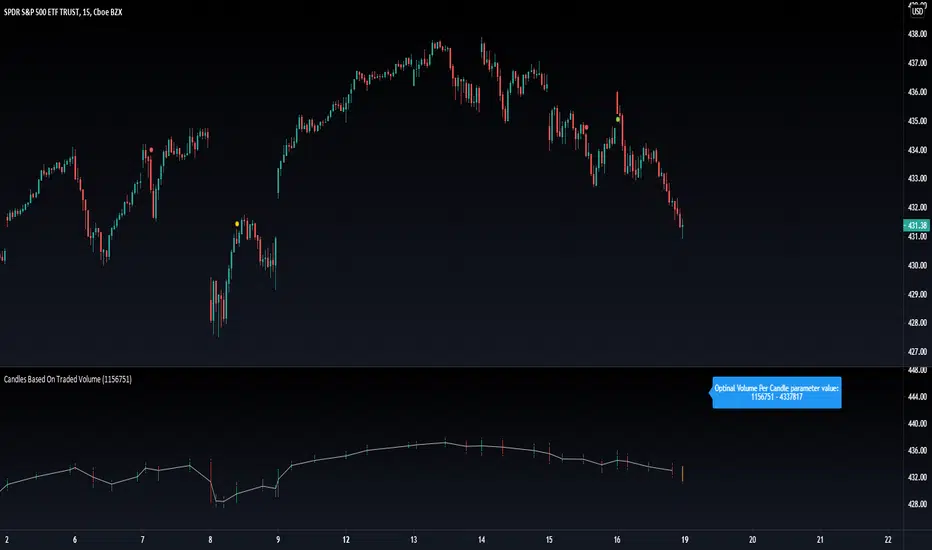
Candles Based On Traded VolumeCBTV - Candlesticks Based on Traded Volume
This is the first robust implementation of volume based candlesticks (bars) on TradingView. This type of bar was describe in the book "Advances in Financial Machine Learning," written by Lopez de Prado, a well-known quant who has managed billions of dollars over the course of his career.
Volume Candlesticks (Bars) are bars that are indexed by total volume, with each set of N shares exchanged forming a separate bar.
This means that on CBTV chart a candle forms not after a specific time interval defined by the time frame of the chart, but when a determined volume was traded.
This approach to price sampling is much better than the time based one, because it does not oversample periods where nothing happens. Traditional candlestick charts show a lot of low volume bars without meaningful price changes in them.
The efficient price sampling results in better results when using volume based bars in machine learning forecasting models. They are also useful for technical analysis. Candlestick patterns on CBTV chart are more pronounced and have more predictive power.
Volume based bars can be constructed only for instruments where volume data is available. These are stocks, futures and crypto currencies.
When you run CBTV it appears in a separate window below the traditional time based chart.
CBTV will be used in pair with a helper indicator which is called Optimal Volume per Candle (OVPC).
When applied to a chart OVPC shows the optimal range for volume per candle to construct volume based candlesticks from this timeframe data. It appears in the blue box above the most recent candle of a standard time based chart.
When you set a Volume Per Candle parameter in CBTV make sure it is within the range that shows OVPC. In this case volume based chart will be easy to read and all the calculations will be performed with the high level of precision.
The most recent unfinished candle is marked with the different set of colors than historical candles. Unfinished candle is colored in orange if it is a falling candle, blue it it is a rising one.
If you leave the CBTV chart opened for a long time you can have multiple blue or orange candles on it. In this case press the “hide” icon with the eye sign twice (it’s on the left side of the indicator panel next to its input parameters). This will refresh the CBTV and remove the artifacts.
While everything comes Real-time you will see the orange or blue bars form but never update. All you need to do is REFRESH THE CHART. Hoping soon to update this with a version you wont have to refresh the chart.
Please drop a like and comment what you guys think and once again thank you Tradingview for such a great platform :)
MTF CandleLevelsIn the spirit of freedom from oppression on this day of July 4th, 2021 in the United States, I hereby release this flagship indicator "MTF CandleLevels" into the wild for any subscribing TV member on the planet to utilize. It's now one my few great gifts to the souls of humankind within the realm of trading on TV. TradingView continues to bless Pine Script by releasing supplemental upgrades, enough for me to develop this indicator beyond it's experimental phase to full potential, as I had always wished to design it from theory. Educationally while using it, you will witness how OHLC/HA candles are actually formed for charts. I like to think of it as a candle formation microscope anyone can learn from.
It is intended for any style of trading or skill level from newcomer to advanced. There are no requirements/prerequisites for you use it. Which means you don't have to wear a mouth muzzle, get multiple doses of the life endangering FrankenJabs, subserviently bow down to authoritarian demands of obedience, or learn the ancient mystical art of deception "Fau Chi" in order to employ it's inherent power. A little sprinkle of satire helps with a dry technical read :). You have the absolute freedom to utilize it any way you see fit! That's right, it's even your choice whether you use it or not. The unshackled empowerment of choice always equates to FREEDOM. I can't program these precious gems without it...
One thing you will have noticed is it's specifically published on a Heikin Ashi(HA) chart, while having immunity to the Heikin Ashi candle charts unique open/close behavior. This has been believed to be an impossibility until now. For members who don't know, HA candle charts have a different `open` and `close` from the `open` and `close` of the other ordinary OHLC candle charts. Regardless of "CandleLevels Mode" chosen in Settings, the indicator will display identical on either bar chart type, excluding Renko, Line Break, Kagi, Point&Figure, and Range candle charts of course. It's abilities supersede the simpler "Multi-Time Period Charts" built-in TV indicator with a completely different architecture. For those of you extremely curious about how I accomplished this indicators level of code complexity, it was immensely difficult taking over a year of effort for this one functional unit, and I will leave it at that...
This novel MTF technology displays OHLC/HA support and resistance levels that mimic the functionality of larger duration candle formations in real time. Basically explained, while charting on a shorter duration timeframe candle chart, you can see open, high, low, and close levels fluctuate in the larger duration timeframe. This reduces the need to jump back and forth to view price action on different chart sampling intervals. You may even use multiple sets of CandleLevels indicators over a wide variety of chosen timeframe options, along with everything else in between.
The CandleLevels behavior is chosen within the indicator "Settings" using a selection mode of either the standard OHLC candlestick formations or Heikin Ashi candlestick formations. Each mode has a multitude of uses depending on the users trading style or timeframe.
Visbility of CandleLevels will ONLY occur when it is set to a larger duration timeframe interval than the current chart sampling rate. For example, you may be using the 5 minute interval sampling rate on the chart, yet you can easily see the open, high, low, close ranges with a chosen 120 minute timeframe setting. The multiple time frame(MTF) settings are highly adjustable having intervals of seconds, minutes, days, a multiple of the chart interval, or the common input(type=input.resolution) function provided by Pine.
CandleLevels come with multiple color schemes to reduce color interference with other indicators in the overlay pane, including the intended use of multiple sets of CandleLevels. My basic color scheme selections can be overridden to choose any imaginable color you desire for your visual acuity. Also, there are additional controls available to fine tune a visually pleasing appearance depending on your preferences and viewable area. One last new hidden fine tune capability, not only for this indicator but all TV indicators, is the agility to use up/down arrow keys on the keyboard when an indicator setting is in focus after mouse selection. For example, when choosing line thickness, you can modify values/options by key stroke. Try it out, I'm sure you will find this useful for any indictor for eternity.
NOTICE: There is only 500 line drawings available, in total to display, at this current release. This equates to 83 sets of CandleLevels maximum.
Features List Includes:
Candle type selection
MTF controls for seconds, minutes, days, multiple-of, and TV input
Multiple color schemes with color overrides
Color opacity selector
Line thickness control
Enable/disable capable MTF interval display with positioning
When available time provides itself, I will consider your inquiries, thoughts, and concepts presented below in the comments section, should you have any questions or comments regarding this indicator. When my indicators achieve more prevalent use by TV members, I may implement more ideas when they present themselves as worthy additions. Have a profitable future everyone!
RISK DISCLAIMER:
My scripts, indicators, and studies are specifically intended for informational and educational use only. These use historical data points to perform calculations to derive real-time calculations. They do not infer, indicate, or guarantee future results or performance.
By utilizing this script/indicator/study or any portion of it, you agree to accept 100% responsibly and liability for your investment or financial decisions, and I will not be held liable for your subjective analytic interpretations incurring sustained monetary losses. The opinions and information visual or otherwise provided by this script/indicator is not investment advice, nor does it constitute recommendation.

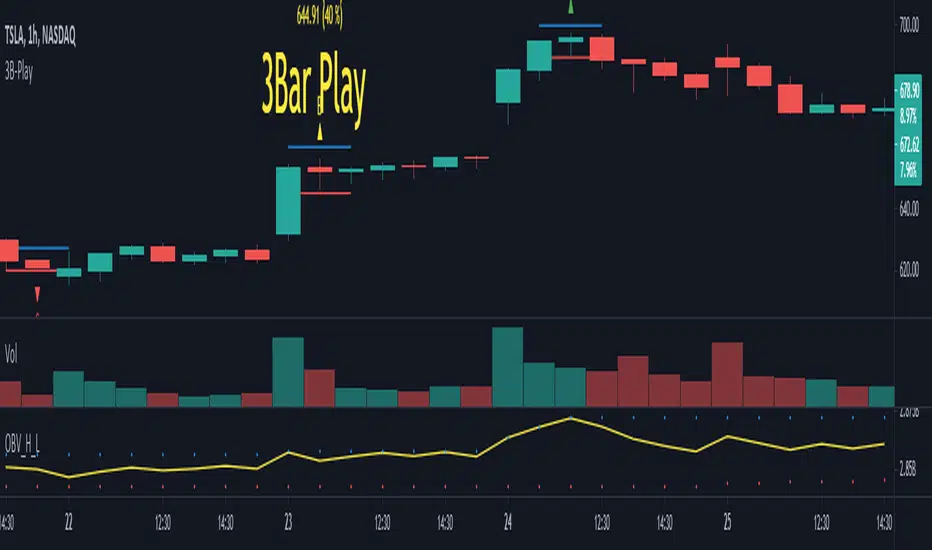
3B-Play Finder1 - Objective
2 - How to use (Theory)
3 - How to use (Grade System)
4 - Inputs
5 - Extras and Alerts
6 - Notes
Objective
This script aims to mark 3 Bar play patterns (both short and long) by identifying them on the chart, with an arrow pointing up from long and down for short. Aswell, setting alerts based on grade.
Following the base concept, this script comes with a "grade" system (A, B, C), which aims to classify 3B-Play according to input parameters.
2 - How to use (Theory)
The pattern is described by a wide range Ignite bar followed by a narrow resting bar.
Long
Given a 3 Bar play pattern, with a wide range green bar, the entry point should be above the ignite and narrow bar wicks (high) with stop loss set below the resting bar wick low but within ignite wide range bar.
The exit depends on the chart analysis, and there is no set rule for it.
Short
Similar to long but is with a wide range red bar and entry is defined on wick low and stop-loss at wick high.
3 - How to use (Grade System)
Since 3B-play come in all sort of shapes, some are "textbook" perfect, others a bit more "loose". I set a grading system, to differentiate each one.
The way the 3 Bar play quality is determined is based on the percentage size of the resting bar in relation to igniting bar size, starting from de close. An example of how this works is the following. Note: enabling the extra draws lines helps visually to adjust the grades to your preference.
4 - Inputs
3B Quality section
Enable/disable each grade.
CONTROL LONG / SHORT
Set the percentage values for each grade.
Extras
Enable/Disable extra plots.
5 - Extras and Alerts
This script comes with an extra section, enabling it, draws lines on the max and min values, as well, showing the values in text and the set percentage.
Also, you can set alerts based on the grade and short/long, note you should set the alert to bar close to avoid pre-trigger warnings.
6 - Notes
The script can be shorted a lot, by only looking for a single 3 bar play, to less than 30 lines.
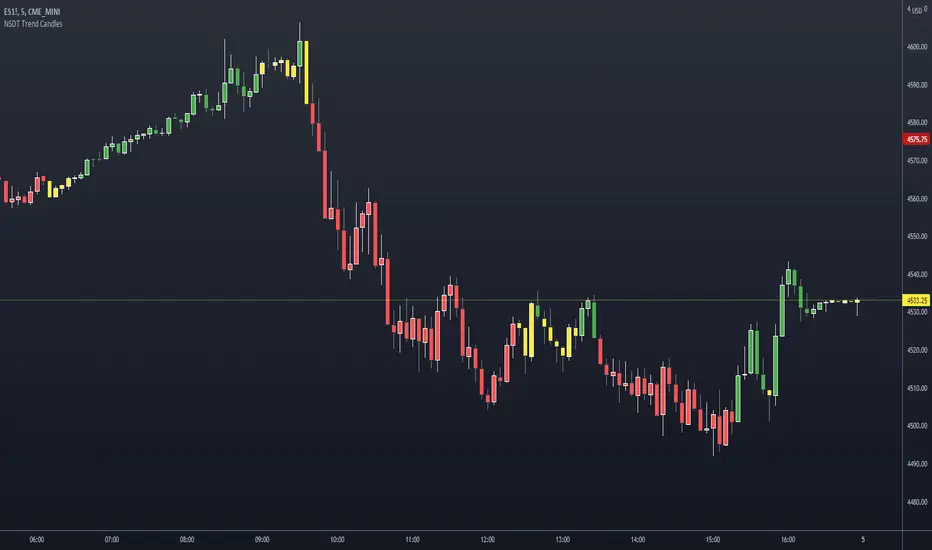
NSDT Trend CandlesThis script changes the color of the candles based on uptrend (green), downtrend (red), neutral/chop (yellow). It uses an ATR and Pivots to determine the direction, or lack of. Since all markets move differently and market volatility changes, you will need to adjust the settings to find a potential match for the day. It's pretty simple to use. Just enter in the direction of the trend and exit (or reverse) when the candle color changes.
Active Market FTFCIncludes most features of my original Strat Candles+Open Levels+Active FTFC indicator but this new addition is focused more for day traders.
Active Market FTFC allows you to add ONE broader average ticker (Indices, Sector or any other ticker you desire). When your stock and the selected ticker BOTH have Full Timeframe Continuity the Candle will light up.
In this example I have opened up $TSLA 15 minute chart. Once the Indicator has been applied I have entered $QQQ within my indicator settings and selected 15/30/60/D open levels with the Active FTFC function for 15/30/60/D.
Once TSLA's 15/30/60/D close price is more than the open price AND the QQQ broader average's 15/30/60/D close price is more than the open price the candle will change colour.
Please change your Active FTFC Candle Colours within the settings. I hope this indicator helps someone :)

Common Candlestick PatternsCommon Candlestick Patters Highlighter.
- TLS: Three Line Strike (Bearish and Bullish)
- AB: Advance Block
- IB: Inside Bar

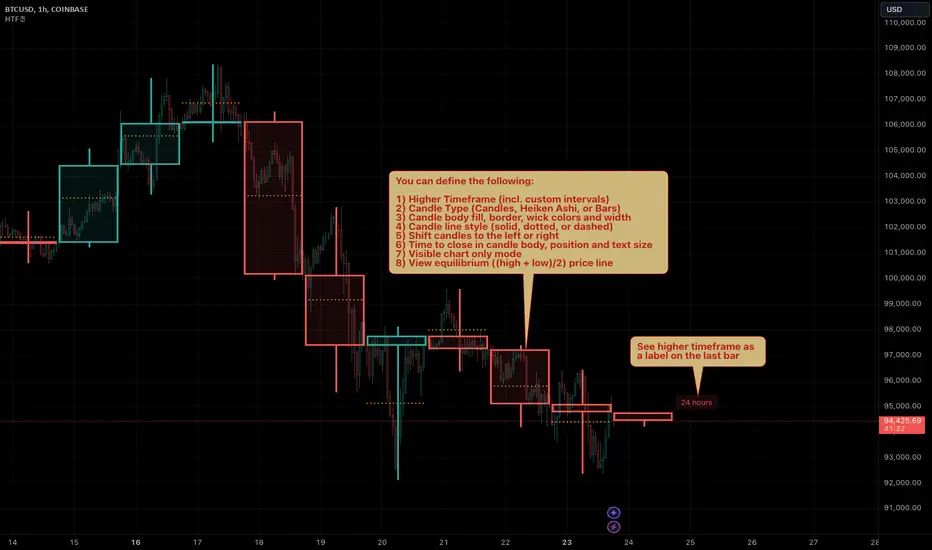
HTF Candles by Prosum SolutionsOverview of Features
This indicator was inspired by the work of "informanerd" in the script called "HTF Candles" as well as the built-in script called "Multi-Time Period Charts" by TradingView. The script will provide a highly customizable interface to specify the higher timeframe resolution for the candlesticks, the type of candle, as well as various styling options for the body, borders and wicks.
Usage Information
The indicator can be applied to any chart at any time frame, but resolutions less than 1 minute may demonstrate gaps between bars and the candles may not render properly.
When the "Same as chart" option is chosen for the "Resolution" field, the indicator will attempt to find a higher timeframe resolution to ensure the candlesticks are drawn.
Enjoy! 👍
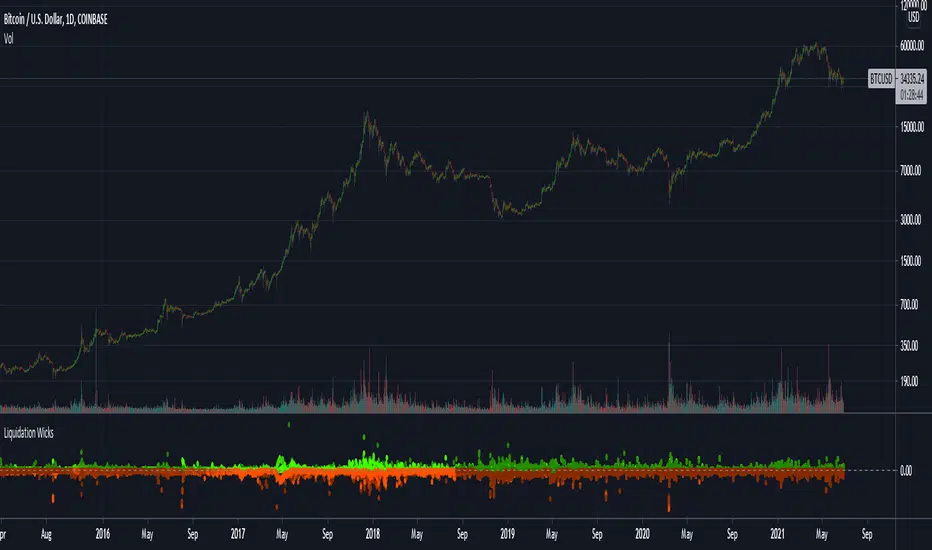
Liquidation Wicks BTCThis script shows the variance between the various btc intruments to find when liquidation cause extreme wicks and price disparity between exchanges
The red dots indicate the difference of the LOWS
and the green dots indicate the difference of the HIGHS
The indicator only works for BTC but it doesn't matter what chart its used on
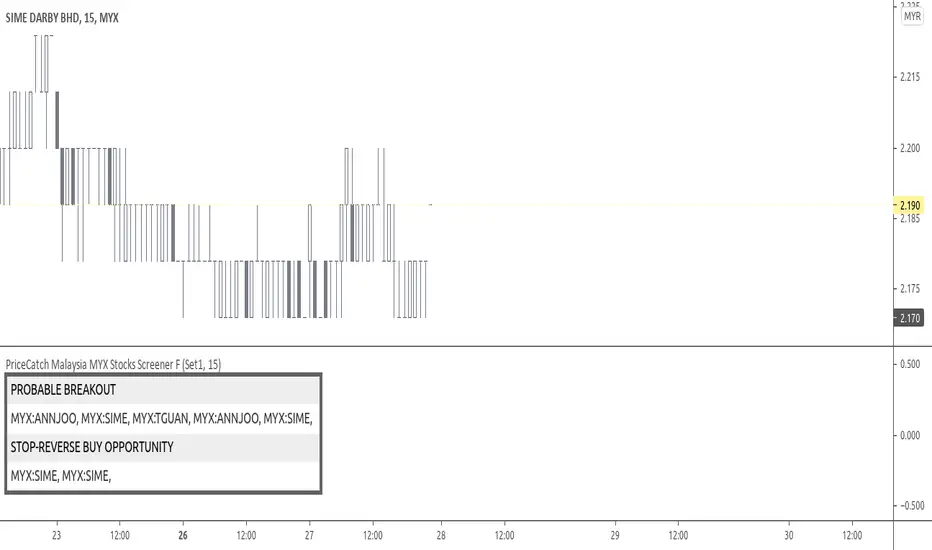
PriceCatch Malaysia MYX Stocks Screener FHi,
Tradingview community and Malaysian MYX Traders. Warm Greetings.
Malaysia MYX Stocks Screener
I am sharing a script that screens Malaysia MYX stocks for Probable Breakout Buy signal and Stop-Reverse Buy Signal. This script may prove to be useful to traders who trade Malaysia MYX listed stocks.
I have already shared the script "PriceCatch Signals Buy Signals" that marks the following levels on the chart.
Probable Breakout Buy Level
Stop-Reverse Buy Level
While the script "PriceCatch Signals Buy Signals" can be used independently, this script is intended to be used with the script "PriceCatch Signals Buy Signals".
Used together, these two scripts may help you identify probable buy opportunities. The purpose of this script is to help screen stocks quickly without manually going through every stock in your watch list.
Please read the Notes of the script "PriceCatch Signals Buy Signals" for explanation of its functionality.
Stock Set
This Free screener scans a list of 20 stocks. The full version scans a list of 60 stocks. The stocks list will be regularly updated. Care has been taken to include liquid stocks. MYX traders may suggest liquid stocks for inclusion in full version.
Chart resolution vs. Script resolution
I have noticed that if the chart resolution is set to 15 minutes time-frame and the screener resolution is selected as 2 Hours, then the results are correct. However, if the screener resolution is set to 5 minutes, then the results are not accurate. This is not an issue with script. So scanning higher time-frames from a lower time-frame chart works better. My advice however, is better to set the chart resolution to the same interval as screener resolution for sure results.
As usual with price action, longer time-frames produce more reliable signals.
CHART
You can have any stock on your chart, while the screener is scanning the stocks independently. In the above image, chart is set to 45 minutes time frame and stock is ABMB, however screener is screening stocks in 120 minutes time frame and has found GTRONIC.
NOTE - PRIOR TO USING THIS SCRIPT:
Please remember that the script is shared with absolutely no assurances about usability and any warranties whatsoever and as a responsible trader, please satisfy yourselves thoroughly and use it only if you are satisfied it works for you. Remember, you are 100% responsible for your actions. If you understand and accept that, you may use the script.
QUERIES/FEEDBACK
Please PM me.
Regards to all and wish everyone all the best with trading.
Fair Value Gap / FVG - HTF Orderflow bias / trendCalculates Fair Value Gap (FVG) as a counter and plots it below price.
FVG Counter value resets to +ve or -ve once the FVG counter reverses direction.
Use this script to find a bias to trade with.
Best used on HTF (like 1W, 1D), so the bias can be transferred to LTF (like 4H, 1H).
If you end up using this script, please leave a comment below on how you used it. I can try to incorporate those ideas in an update.
Cheers!

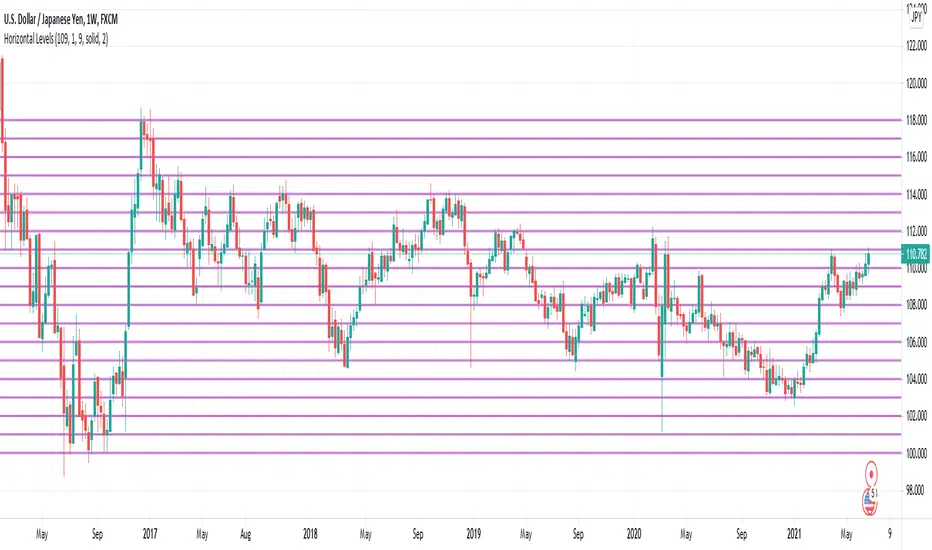
Configurable Horizontal LevelsThis script draws horizontal levels onto a chart. Unlike existing scripts, this one allows the configuration of the level number, starting level, and level distance.
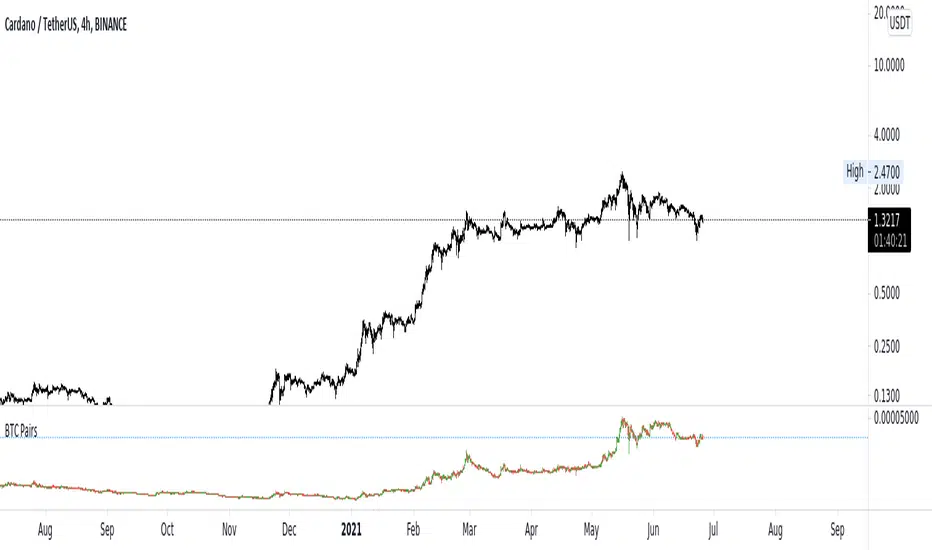
BTC PairsHi Crypto traders,
As many of you, while trading in altcoins, it is important to look at their BTC pairs also. That is why I created a script like this.
It works under these conditions:
1- The coin you are looking for must have BTC pair in the exchange of the chart. ( If an exchange does not have ADABTC while it has ADAUSDT, the script wont work )
2- The pair in that exchange must be concatenated as follows "PAIR_NAME" + "BTC" in tradingview. Ex: "ADA" + BTC" = "ADABTC"
If you have any questions or suggestion, I would be glad to hear and answer them.
Stay Safe.