Sentinel System V1.1
Sentinel System – High-Probability Confluence Indicator (Non-Repainting)The Sentinel System is a powerful all-in-one indicator designed for traders who want clean, high-probability entries with minimal false signals. Built around the principle of multiple confluence, it combines trend filtering, momentum triggers, and dynamic price zones to deliver precise buy/sell arrows only when everything aligns.Key Features:Trend Filter: Uses EMA 50/200 to ensure signals only appear in the direction of the prevailing trend (no counter-trend noise).
Sentinel Trigger: Custom fast/slow momentum crossover optimized to catch the beginning of impulsive moves.
Sentinel Zones: Shaded dynamic areas based on recent pivots/fractals, mild overbought/oversold conditions, and relative strength. Signals are only validated inside these high-confluence zones.
Clean Arrows & Alerts: Non-repainting ↑ (long) and ↓ (short) arrows with pop-up, sound, and push alerts.
Confluence Dashboard: Small on-chart label showing signal strength (Strong / Medium / Weak).
Works on any timeframe and any asset – exceptional performance on volatile markets like BTC, ETH, XAU/USD, and major forex pairs.
Why traders love it:Extremely low false signal rate thanks to triple-layer confirmation.
Fully non-repainting – once an arrow appears, it stays.
Perfect for scalping (lower TFs) or swing trading (higher TFs).
Simple and clean visuals – no chart clutter.
Whether you're a beginner looking for reliable signals or an experienced trader seeking confluence confirmation, Sentinel System helps you stay on the right side of the market with confidence.Feel free to test it extensively – the results speak for themselves. Disclaimer: No indicator guarantees profits. Always use proper risk manageme
¿Cómo funciona?Combina tres capas de confirmación:Tendencia (EMA).
Momentum (trigger).
Zona de precio dinámica.
Solo cuando las tres coinciden, aparece una señal. Esto reduce mucho las entradas falsas.¿Para qué sirve?Funciona en cualquier timeframe y cualquier activo.
Destaca especialmente en mercados volátiles como Bitcoin (BTC), Ethereum (ETH), oro (XAU/USD) y pares mayores de forex.
Ideal para scalping (timeframes bajos) o swing trading (timeframes altos).
Perfecto para principiantes que buscan señales claras o traders avanzados que quieren confirmación extra.
Candlestick analysis

Wyckoff Method - Comprehensive Analysis# WYCKOFF METHOD - QUICK REFERENCE CHEAT SHEET
## 🟢 STRONGEST BUY SIGNALS
### 1. SPRING ⭐⭐⭐⭐⭐
- **What:** False breakdown below support on LOW volume
- **Look for:** Quick reversal, close above support
- **Entry:** When price closes back in range
- **Stop:** Below spring low
- **Target:** Top of range minimum
### 2. SOS (Sign of Strength) ⭐⭐⭐⭐
- **What:** Breakout above resistance on HIGH volume
- **Look for:** Wide spread up bar, strong close
- **Entry:** On breakout or wait for LPS pullback
- **Stop:** Below range top
- **Target:** Height of range projected up
### 3. SHAKEOUT ⭐⭐⭐⭐
- **What:** Sharp move below support with HIGH volume, immediate reversal
- **Look for:** Long lower wick, closes strong
- **Entry:** When price reclaims support
- **Stop:** Below shakeout low
- **Target:** Previous resistance
---
## 🔴 STRONGEST SELL SIGNALS
### 1. UTAD (Upthrust After Distribution) ⭐⭐⭐⭐⭐
- **What:** False breakout above resistance, quick rejection
- **Look for:** Spike high, weak close, often high volume
- **Entry:** When price closes back in range
- **Stop:** Above UTAD high
- **Target:** Bottom of range minimum
### 2. SOW (Sign of Weakness) ⭐⭐⭐⭐
- **What:** Breakdown below support on HIGH volume
- **Look for:** Wide spread down bar, weak close
- **Entry:** On breakdown or wait for LPSY rally
- **Stop:** Above range bottom
- **Target:** Height of range projected down
### 3. UPTHRUST ⭐⭐⭐⭐
- **What:** Move above resistance on LOW volume, weak close
- **Look for:** Long upper wick, closes in lower half
- **Entry:** When resistance holds
- **Stop:** Above upthrust high
- **Target:** Support level
---
## 📊 ACCUMULATION PHASES (Bottom Formation)
```
PHASE A: Stopping the Downtrend
├─ PS (Preliminary Support) - First buying
├─ SC (Selling Climax) - Panic bottom ⚠️ KEY EVENT
├─ AR (Automatic Rally) - Relief bounce
└─ ST (Secondary Test) - Retest SC low
PHASE B: Building the Cause
├─ Trading range forms
├─ Multiple tests of support
├─ Volume decreasing
└─ Absorption occurring
PHASE C: The Test
├─ SPRING - False breakdown ⚠️ KEY EVENT
└─ TEST - Support holds on low volume
PHASE D: Dominance Emerges
├─ SOS - Breakout ⚠️ KEY EVENT
├─ LPS - Last Point of Support (pullback)
└─ BU - Backup
PHASE E: Markup
└─ New uptrend, strong momentum
```
**Background Color:** Blue → Green (getting brighter)
**Action:** Buy in Phase C/D, Hold through Phase E
---
## 📊 DISTRIBUTION PHASES (Top Formation)
```
PHASE A: Stopping the Uptrend
├─ PSY (Preliminary Supply) - First selling
├─ BC (Buying Climax) - Euphoric top ⚠️ KEY EVENT
├─ AR (Automatic Reaction) - Sharp drop
└─ ST (Secondary Test) - Retest BC high
PHASE B: Building the Cause
├─ Trading range forms
├─ Multiple tests of resistance
├─ Demand being absorbed
└─ Volume patterns change
PHASE C: The Test
└─ UTAD - False breakout ⚠️ KEY EVENT
PHASE D: Dominance Emerges
├─ SOW - Breakdown ⚠️ KEY EVENT
└─ LPSY - Last Point of Supply (rally to exit)
PHASE E: Markdown
└─ New downtrend, strong selling
```
**Background Color:** Orange → Red (getting darker)
**Action:** Sell in Phase C/D, Stay out during Phase E
---
## 💰 VOLUME SPREAD ANALYSIS (VSA)
| Signal | Meaning | Color | Implication |
|--------|---------|-------|-------------|
| **ND** (No Demand) | Up bar, LOW volume | 🟠 Orange | Weakness - uptrend ending |
| **NS** (No Supply) | Down bar, LOW volume | 🔵 Blue | Strength - downtrend ending |
| **SV** (Stopping Volume) | VERY HIGH volume, narrow spread | 🟣 Purple | Potential reversal |
| **UT** (Upthrust) | Above resistance, LOW vol, weak close | 🔴 Red | Sell signal |
| **SO** (Shakeout) | Below support, HIGH vol, strong close | 🟢 Green | Buy signal |
---
## 🎯 VOLUME INTERPRETATION
| Volume Level | Bar Color | Meaning |
|--------------|-----------|---------|
| **VERY HIGH** (>2x average) | Dark Green/Red | Climax, potential reversal |
| **HIGH** (>1.5x average) | Light Green/Red | Strong interest |
| **NORMAL** | Gray | Average trading |
| **LOW** (<0.7x average) | Faint Gray | Testing, no interest |
---
## ⚖️ EFFORT vs RESULT
| Scenario | Volume | Spread | Meaning |
|----------|--------|--------|---------|
| **High Effort, Low Result** | HIGH | Narrow | ⚠️ Potential reversal |
| **Low Effort, High Result** | LOW | Wide | ⚠️ Trend weakening |
| **High Effort, High Result** | HIGH | Wide | ✅ Strong trend |
| **Low Effort, Low Result** | LOW | Narrow | 😴 No interest |
---
## 📏 TRADING RULES
### ✅ DO:
- ✅ Wait for confirmation before entering
- ✅ Trade in direction of higher timeframe
- ✅ Use springs and UTAD as primary signals
- ✅ Measure trading range for targets
- ✅ Place stops outside the range
- ✅ Look for volume confirmation
- ✅ Check multiple timeframes
- ✅ Focus on Phase C and D events
### ❌ DON'T:
- ❌ Buy during Phase E Markdown
- ❌ Sell during Phase E Markup
- ❌ Trade against major trend
- ❌ Ignore volume signals
- ❌ Enter without clear stop loss
- ❌ Trade every signal
- ❌ Use on very low timeframes without practice
- ❌ Ignore the context
---
## 🎪 COMPOSITE OPERATOR (Smart Money)
### 💰 Green Money Symbol (Bottom)
- **Meaning:** Institutions accumulating
- **Location:** Demand zones, springs, tests
- **Action:** Follow the smart money - buy
### 💰 Red Money Symbol (Top)
- **Meaning:** Institutions distributing
- **Location:** Supply zones, UTAD, weak rallies
- **Action:** Follow the smart money - sell
---
## 📍 SUPPLY & DEMAND ZONES
### 🟢 Demand Zones (Green Boxes)
- **Created at:** SC, Spring, Shakeout
- **Represents:** Where smart money bought
- **Action:** Look for bounces
### 🔴 Supply Zones (Red Boxes)
- **Created at:** BC, UTAD, Upthrust
- **Represents:** Where smart money sold
- **Action:** Look for rejections
---
## 🎯 TARGET CALCULATION
### Measured Move Method
```
1. Measure trading range height
Example: Top at 120, Bottom at 100 = 20 points
2. Add to breakout point (accumulation)
Breakout at 120 + 20 = Target: 140
3. Or subtract from breakdown (distribution)
Breakdown at 100 - 20 = Target: 80
```
### Multiple Targets
- **Conservative:** 1x range height (100% probability reached)
- **Moderate:** 1.5x range height (70% probability)
- **Aggressive:** 2x range height (40% probability)
---
## ⏰ TIMEFRAME GUIDE
| Timeframe | Use For | Reliability | Recommended For |
|-----------|---------|-------------|-----------------|
| **Weekly** | Major trends | ⭐⭐⭐⭐⭐ | Position traders |
| **Daily** | Swing trades | ⭐⭐⭐⭐⭐ | Most traders |
| **4-Hour** | Active swing | ⭐⭐⭐⭐ | Active traders |
| **1-Hour** | Day trading | ⭐⭐⭐ | Experienced only |
| **15-Min** | Scalping | ⭐⭐ | Experts only |
**Golden Rule:** Always check one timeframe higher for context!
---
## 🚨 ALERT PRIORITY
### 🔔 MUST-HAVE ALERTS
1. Spring
2. UTAD
3. SOS
4. SOW
### 🔔 NICE-TO-HAVE ALERTS
5. Selling Climax (SC)
6. Buying Climax (BC)
7. Smart Money Accumulation
8. Smart Money Distribution
### 🔔 CONFIRMATION ALERTS
9. Phase E Markup
10. Phase E Markdown
---
## 💡 QUICK DECISION TREE
```
Is there a clear trading range?
├─ YES
│ ├─ Did price break BELOW support?
│ │ ├─ Volume LOW + Quick reversal = SPRING → BUY ✅
│ │ └─ Volume HIGH + Stays down = Breakdown → SELL ⚠️
│ │
│ └─ Did price break ABOVE resistance?
│ ├─ Volume LOW + Quick reversal = UTAD → SELL ✅
│ └─ Volume HIGH + Stays up = Breakout → BUY ⚠️
│
└─ NO
├─ Strong uptrend = Wait for re-accumulation
└─ Strong downtrend = Wait for re-distribution
```
---
## 📝 PRE-TRADE CHECKLIST
Before entering any trade:
- Identified the current Wyckoff phase
- Confirmed with volume analysis
- Checked higher timeframe trend
- Located supply/demand zones
- Identified clear entry point
- Set stop loss level
- Calculated target (risk:reward >1:2)
- Verified position size (risk 1-2%)
- Have at least 2 confirming signals
- Not trading against major trend
---
## 🧠 REMEMBER
**The Three Laws:**
1. **Supply & Demand** - Price is determined by imbalance
2. **Cause & Effect** - Range size predicts move size
3. **Effort & Result** - Volume should confirm price movement
**The Key Principle:**
> "Trade with the Composite Operator (smart money), not against them"
**Best Setups:**
1. Spring in accumulation (Phase C)
2. UTAD in distribution (Phase C)
3. SOS breakout (Phase D)
4. SOW breakdown (Phase D)
**When in Doubt:**
- ❓ Stay out
- 📈 Use higher timeframe
- 📚 Review the documentation
- 🎯 Wait for clearer signal
---
## 📱 INDICATOR SETTINGS QUICK SETUP
**For Stocks/Crypto (Good Volume Data):**
- Volume MA Length: 20
- High Volume Multiplier: 1.5
- Climax Volume: 2.0
- Swing Length: 5
**For Forex (Limited Volume Data):**
- Volume MA Length: 20
- High Volume Multiplier: 1.3
- Climax Volume: 1.8
- Swing Length: 7
- Turn OFF "Volume Confirmation"
**For Day Trading:**
- Swing Length: 3
- All other settings: Default
**For Position Trading:**
- Swing Length: 7-10
- Volume MA Length: 30
- Use Daily/Weekly charts
---
## 🎓 SKILL PROGRESSION
### Beginner (Month 1-2)
- Focus on: SC, Spring, SOS
- Timeframe: Daily only
- Goal: Identify phases correctly
### Intermediate (Month 3-6)
- Add: All accumulation events
- Timeframe: Daily + 4H
- Goal: Trade springs profitably
### Advanced (Month 6-12)
- Add: Distribution events, VSA
- Timeframe: Multiple timeframes
- Goal: Trade complete cycles
### Expert (Year 2+)
- Master: All events, all timeframes
- Combine: With other methodologies
- Goal: Consistent profitability
---
**Print this sheet and keep it next to your trading desk!**
*Remember: Quality over quantity. Wait for the best setups.*
# Wyckoff Method - Comprehensive Analysis Indicator
## Complete Implementation Guide for TradingView Pine Script
---
## TABLE OF CONTENTS
1. (#overview)
2. (#installation)
3. (#theory)
4. (#components)
5. (#signals)
6. (#strategies)
7. (#settings)
8. (#alerts)
9. (#patterns)
10. (#troubleshooting)
---
## OVERVIEW
This indicator implements Richard Wyckoff's complete trading methodology, including:
- **All 5 Phases** of Accumulation and Distribution
- **18+ Wyckoff Events** (PS, SC, AR, ST, Spring, SOS, LPS, BC, UTAD, SOW, etc.)
- **Volume Spread Analysis (VSA)** principles
- **Supply & Demand Zone** detection
- **Composite Operator** logic (Smart Money tracking)
- **Effort vs Result** analysis
- **Three Wyckoff Laws**: Supply/Demand, Cause/Effect, Effort/Result
---
## INSTALLATION
### Step 1: Copy the Code
1. Open the `wyckoff_comprehensive.pine` file
2. Select all code (Ctrl+A / Cmd+A)
3. Copy to clipboard (Ctrl+C / Cmd+C)
### Step 2: Add to TradingView
1. Go to TradingView.com
2. Open any chart
3. Click "Pine Editor" at the bottom of the screen
4. Click "New" or "Open"
5. Paste the entire code
6. Click "Save" and give it a name
7. Click "Add to Chart"
### Step 3: Verify Installation
You should see:
- Labels on the chart (PS, SC, Spring, SOS, etc.)
- Background colors indicating phases
- Volume analysis in the lower pane
- A table in the top-right corner showing current phase
---
## WYCKOFF METHOD THEORY
### The Three Fundamental Laws
#### 1. **Law of Supply and Demand**
- Price rises when demand exceeds supply
- Price falls when supply exceeds demand
- The indicator tracks volume vs price movement to identify imbalances
#### 2. **Law of Cause and Effect**
- A period of accumulation (cause) leads to markup (effect)
- A period of distribution (cause) leads to markdown (effect)
- Trading ranges build "cause" for future price movement
#### 3. **Law of Effort vs Result**
- **Effort** = Volume (energy put into the market)
- **Result** = Price movement (spread of the bar)
- High effort with low result = potential reversal
- Low effort with high result = trend weakness
### The Five Phases
#### **ACCUMULATION CYCLE**
**Phase A: Stopping the Downtrend**
- Preliminary Support (PS): First sign of buying
- Selling Climax (SC): Panic selling exhaustion
- Automatic Rally (AR): Bounce from SC
- Secondary Test (ST): Test of SC low on lower volume
**Phase B: Building the Cause**
- Trading range develops
- Supply being absorbed by composite operator
- Multiple tests of support and resistance
- Volume generally decreases
**Phase C: The Test (Spring)**
- False breakdown below support
- Traps late sellers
- Quick reversal on low volume
- Last chance to accumulate before markup
**Phase D: Dominance Emerges**
- Sign of Strength (SOS): Break above resistance
- Last Point of Support (LPS): Pullback opportunity
- Backup (BU): Final consolidation
- Demand clearly exceeds supply
**Phase E: Markup**
- New uptrend established
- Price moves rapidly higher
- Phase E can last months/years
- Original trading range becomes support
#### **DISTRIBUTION CYCLE**
**Phase A: Stopping the Uptrend**
- Preliminary Supply (PSY): First sign of selling
- Buying Climax (BC): Euphoric buying exhaustion
- Automatic Reaction (AR): Sharp selloff from BC
- Secondary Test (ST): Test of BC high on lower volume
**Phase B: Building the Cause**
- Trading range at top
- Demand being absorbed by composite operator
- Multiple tests of support and resistance
**Phase C: The Test (UTAD)**
- Upthrust After Distribution
- False breakout above resistance
- Traps late buyers
- Quick reversal
**Phase D: Dominance Emerges**
- Sign of Weakness (SOW): Break below support
- Last Point of Supply (LPSY): Rally opportunity to exit
- Supply clearly exceeds demand
**Phase E: Markdown**
- New downtrend established
- Price moves rapidly lower
- Original trading range becomes resistance
---
## INDICATOR COMPONENTS
### 1. EVENT LABELS
#### Accumulation Events (Green labels)
- **PS** = Preliminary Support
- **SC** = Selling Climax (largest label, most important)
- **AR** = Automatic Rally
- **ST** = Secondary Test
- **SPRING** = Spring (critical buy signal)
- **TEST** = Test of support
- **SOS** = Sign of Strength (breakout)
- **LPS** = Last Point of Support
- **BU** = Backup
#### Distribution Events (Red labels)
- **PSY** = Preliminary Supply
- **BC** = Buying Climax (largest label, most important)
- **AR** = Automatic Reaction
- **ST** = Secondary Test
- **UTAD** = Upthrust After Distribution (critical sell signal)
- **SOW** = Sign of Weakness
- **LPSY** = Last Point of Supply
#### VSA Events (Small colored labels)
- **ND** (Orange) = No Demand - weakness
- **NS** (Blue) = No Supply - strength
- **SV** (Purple) = Stopping Volume
- **UT** (Red) = Upthrust - weakness
- **SO** (Green) = Shakeout - strength
#### Composite Operator (💰 symbols)
- Green 💰 at bottom = Smart Money Accumulation
- Red 💰 at top = Smart Money Distribution
### 2. BACKGROUND COLORS
- **Light Blue** = Phase A (Accumulation)
- **Light Orange** = Phase A (Distribution)
- **Very Light Green** = Phase C (Accumulation Testing)
- **Very Light Red** = Phase C (Distribution Testing)
- **Light Green** = Phase D (Accumulation Strength)
- **Light Red** = Phase D (Distribution Weakness)
- **Green** = Phase E (Markup - Bull trend)
- **Red** = Phase E (Markdown - Bear trend)
### 3. SUPPLY & DEMAND ZONES
- **Green boxes** = Demand zones (where smart money accumulated)
- **Red boxes** = Supply zones (where smart money distributed)
- Zones extend 20 bars into the future
- Price reactions at these zones are significant
### 4. VOLUME PANEL
- **Dark Green/Red bars** = Very High Volume (climax)
- **Light Green/Red bars** = High Volume
- **Gray bars** = Normal Volume
- **Faint Gray bars** = Low Volume
- **Blue line** = Volume Moving Average
### 5. INFORMATION TABLE (Top Right)
Displays real-time analysis:
- **Current Phase** (A, B, C, D, or E)
- **Status** (description of what's happening)
- **Volume** (Very High, High, Normal, Low)
- **Spread** (Wide, Normal, Narrow)
- **Effort/Result** (Poor, Normal, Good)
- **Range** (YES if in trading range)
- **Bias** (BULLISH, BEARISH, or NEUTRAL)
---
## HOW TO READ THE SIGNALS
### STRONG BUY SIGNALS (in order of strength)
1. **SPRING** (strongest)
- False breakdown below support
- Look for: Low volume, quick reversal, close above support
- Entry: When price closes back above support level
- Stop: Below the spring low
2. **SOS (Sign of Strength)**
- Break above trading range resistance
- Look for: High volume, wide spread up bar
- Entry: On breakout or pullback to LPS
- Stop: Below trading range
3. **Shakeout (SO)**
- Similar to spring but more violent
- Look for: High volume, penetration of support, strong close
- Entry: When price reclaims support
- Stop: Below shakeout low
4. **LPS (Last Point of Support)**
- Pullback after SOS
- Look for: Low volume, shallow pullback
- Entry: When support holds
- Stop: Below LPS
5. **No Supply (NS)**
- Down bar on very low volume
- Indicates lack of selling pressure
- Confirms accumulation phase
### STRONG SELL SIGNALS (in order of strength)
1. **UTAD (Upthrust After Distribution)** (strongest)
- False breakout above resistance
- Look for: High volume spike, rejection, close below resistance
- Entry: When price closes back below resistance
- Stop: Above UTAD high
2. **SOW (Sign of Weakness)**
- Break below trading range support
- Look for: High volume, wide spread down bar
- Entry: On breakdown or rally to LPSY
- Stop: Above trading range
3. **Upthrust (UT)**
- Move above resistance on low volume, weak close
- Look for: Low volume, close in lower half of bar
- Entry: When resistance becomes resistance again
- Stop: Above upthrust high
4. **LPSY (Last Point of Supply)**
- Rally after SOW
- Look for: Low volume, weak rally
- Entry: When rally fails
- Stop: Above LPSY
5. **No Demand (ND)**
- Up bar on very low volume
- Indicates lack of buying pressure
- Confirms distribution phase
### NEUTRAL/WARNING SIGNALS
- **High Effort, Low Result** = Potential reversal coming
- **Stopping Volume** = Trend may be ending
- **Absorption** = Large volume with small movement (accumulation/distribution)
---
## TRADING STRATEGY EXAMPLES
### Strategy 1: Accumulation Range Breakout
**Setup:**
1. Identify trading range (blue background in Phase B)
2. Wait for Spring or Test (Phase C)
3. Wait for SOS breakout (Phase D)
**Entry:**
- Option A: Buy on SOS breakout
- Option B: Wait for LPS pullback (better risk/reward)
**Stop Loss:**
- Below the spring low or trading range bottom
**Target:**
- Measure height of trading range (cause)
- Project upward from breakout point (effect)
- Minimum target = range height
**Example:**
```
Trading Range: 100 to 120 (20 point range)
SOS Breakout at: 120
Target: 120 + 20 = 140 minimum
```
### Strategy 2: Distribution Range Breakdown
**Setup:**
1. Identify trading range after uptrend
2. Wait for UTAD (Phase C)
3. Wait for SOW breakdown (Phase D)
**Entry:**
- Option A: Sell on SOW breakdown
- Option B: Wait for LPSY rally (better risk/reward)
**Stop Loss:**
- Above the UTAD high or trading range top
**Target:**
- Measure height of trading range
- Project downward from breakdown point
- Minimum target = range height
### Strategy 3: Spring Trading
**Setup:**
1. Strong downtrend followed by range
2. Price breaks below range bottom
3. Volume is LOW on breakdown
4. Price quickly reverses and closes above support
**Entry:**
- When candle closes above support level
- Or on retest of support
**Stop Loss:**
- Below spring low (usually tight)
**Target:**
- Top of trading range
- Previous swing high
**Risk/Reward:**
- Typically 1:3 or better
### Strategy 4: Smart Money Tracking
**Setup:**
1. Look for 💰 symbols in demand zones
2. Multiple accumulation signals (PS, SC, ST, Test)
3. Volume decreasing during range
**Entry:**
- At next demand zone test
- On SOS breakout
**Confirmation:**
- Background turning green (Phase D/E)
- Table shows "BULLISH" bias
### Strategy 5: VSA Reversal
**Setup:**
1. Strong trend in place
2. Stopping Volume (SV) appears at extreme
3. Followed by No Demand (ND) or No Supply (NS)
**Entry:**
- When trend breaks down/up
- On retest of extreme
**Example (Bullish):**
```
Downtrend → Stopping Volume → No Supply → Up bar
Entry: Buy when price moves above SV bar
```
---
## SETTINGS & CUSTOMIZATION
### Volume Analysis Settings
**Volume MA Length** (default: 20)
- Shorter = More sensitive to volume changes
- Longer = Smoother, less noise
- Recommended: 15-25 for most timeframes
**High Volume Multiplier** (default: 1.5)
- Threshold for "high volume"
- Lower = More signals
- Higher = Only extreme volume
- Recommended: 1.3-2.0
**Climax Volume Multiplier** (default: 2.0)
- Threshold for climax events (SC, BC)
- Should be significantly higher than normal
- Recommended: 2.0-3.0
### Phase Detection Settings
**Swing Detection Length** (default: 5)
- How many bars to look left/right for swing points
- Shorter = More swings detected (more noise)
- Longer = Fewer swings (cleaner, might miss some)
- Recommended: 3-7
**Range Expansion Threshold** (default: 1.5)
- Multiplier for "wide spread" bars
- Higher = Only very wide bars qualify
- Recommended: 1.3-2.0
**Volume Confirmation** (default: ON)
- Requires volume confirmation for events
- Turn OFF for very low volume instruments
- Keep ON for stocks, forex, crypto
### Display Options
Toggle on/off:
- ✅ **Show Accumulation/Distribution Phases** - Background colors
- ✅ **Show Wyckoff Events** - All labeled events
- ✅ **Show Volume Spread Analysis** - VSA labels
- ✅ **Show Supply/Demand Zones** - Boxes on chart
- ✅ **Show Composite Operator Signals** - 💰 symbols
### Color Customization
- **Bullish Color** - All accumulation events
- **Bearish Color** - All distribution events
- **Neutral Color** - Range/neutral signals
---
## ALERT SETUP
### Available Alerts
1. **Selling Climax (SC)** - Potential bottom forming
2. **Spring** - Strong buy signal
3. **Sign of Strength (SOS)** - Bullish breakout
4. **Buying Climax (BC)** - Potential top forming
5. **UTAD** - Strong sell signal
6. **Sign of Weakness (SOW)** - Bearish breakdown
7. **Phase E Markup** - Uptrend confirmed
8. **Phase E Markdown** - Downtrend confirmed
9. **Smart Money Accumulation** - Institutions buying
10. **Smart Money Distribution** - Institutions selling
### How to Set Up Alerts
1. Click the "⏰" icon on TradingView
2. Select "Create Alert"
3. Condition: Choose the indicator and alert type
4. Example: "Wyckoff Method - Spring"
5. Set notification preferences (popup, email, webhook)
6. Click "Create"
### Recommended Alert Strategy
**Conservative Trader:**
- Spring
- SOS
- UTAD
- SOW
**Aggressive Trader:**
- Add: SC, BC, Smart Money signals
**Long-term Investor:**
- Phase E Markup
- Phase E Markdown
- Smart Money Accumulation
---
## COMMON PATTERNS
### Pattern 1: Classic Accumulation
```
Phase A: Downtrend → PS → SC → AR → ST
Phase B: Range building (4-12 weeks typical)
Phase C: Spring (false breakdown)
Phase D: SOS → LPS → BU
Phase E: Markup (new uptrend)
```
**What to do:**
- Mark the range boundaries
- Wait for spring
- Buy on LPS or SOS
- Hold through markup
### Pattern 2: Classic Distribution
```
Phase A: Uptrend → PSY → BC → AR → ST
Phase B: Range building (topping process)
Phase C: UTAD (false breakout)
Phase D: SOW → LPSY
Phase E: Markdown (new downtrend)
```
**What to do:**
- Mark the range boundaries
- Wait for UTAD
- Sell on LPSY or SOW
- Stay out during markdown
### Pattern 3: Re-Accumulation
```
Uptrend → Trading Range → Spring → Uptrend continues
```
- Occurs during existing uptrend
- Shorter accumulation period
- Often no clear SC (trend is already up)
- Spring is the key signal
### Pattern 4: Re-Distribution
```
Downtrend → Trading Range → UTAD → Downtrend continues
```
- Occurs during existing downtrend
- Shorter distribution period
- Often no clear BC (trend is already down)
- UTAD is the key signal
### Pattern 5: Failed Breakout
**Bullish Failed Breakout:**
```
Range → Breakdown → Immediate reversal (Spring)
```
- Price breaks support
- Volume is LOW
- Immediate strong reversal
- Very bullish
**Bearish Failed Breakout:**
```
Range → Breakout → Immediate reversal (UTAD)
```
- Price breaks resistance
- Volume may be high initially
- Quick rejection and reversal
- Very bearish
---
## TIMEFRAME RECOMMENDATIONS
### Daily Charts (Most Reliable)
- Best for swing trading
- Clear phases and events
- Less noise
- Recommended for beginners
### 4-Hour Charts
- Good for active swing traders
- Faster signals than daily
- Still reliable
### 1-Hour Charts
- For day traders
- More false signals
- Need to filter carefully
- Use in conjunction with higher timeframe
### 15-Minute / 5-Minute
- Only for experienced traders
- High noise level
- Many false signals
- Use daily chart for context
**Golden Rule:** Always check higher timeframe first!
---
## MULTI-TIMEFRAME ANALYSIS
### Top-Down Approach (Recommended)
1. **Weekly Chart** - Identify major trend and phase
2. **Daily Chart** - Find current accumulation/distribution
3. **4H Chart** - Identify entry timing
4. **Entry Timeframe** - Execute trade
### Example Analysis:
**Weekly:** Phase E Markup (bullish)
**Daily:** Phase B Re-accumulation
**4-Hour:** Spring detected
**Action:** Buy on daily LPS
---
## WYCKOFF + OTHER INDICATORS
### Complementary Tools
1. **Moving Averages**
- 20/50 SMA for trend context
- Already plotted on indicator
2. **RSI**
- Divergences at SC/BC
- Confirms overbought/oversold
3. **MACD**
- Confirms trend change in Phase D
- Divergences support Wyckoff events
4. **Volume Profile**
- Identifies value areas
- Confirms supply/demand zones
5. **Order Flow / Footprint Charts**
- See institutional activity
- Confirms smart money signals
**Don't Over-Complicate:**
- Wyckoff is a complete system
- Other indicators are supplementary
- When in doubt, trust Wyckoff
---
## TROUBLESHOOTING
### Issue: Too Many Labels
**Solution:**
- Increase swing length (Settings → 7 or 10)
- Increase volume multipliers
- Turn off VSA labels if not needed
- Focus on major events only (SC, Spring, SOS, BC, UTAD, SOW)
### Issue: Missing Expected Events
**Solution:**
- Decrease swing length (Settings → 3)
- Decrease volume multipliers
- Turn OFF volume confirmation
- Check timeframe (use daily chart)
### Issue: False Signals
**Solution:**
- Use higher timeframe
- Wait for confirmation
- Don't trade against major trend
- Look for multiple signal convergence
### Issue: Can't See Background Colors
**Solution:**
- Check "Show Phases" is enabled
- Increase monitor brightness
- Colors are subtle by design (not to obscure price)
### Issue: Volume Shows Incorrectly
**Solution:**
- Ensure volume data is available for your symbol
- Some symbols have poor volume data
- Forex spot pairs have no real volume
- Use futures or stock markets for best results
### Issue: No Trading Range Detected
**Solution:**
- Market may be trending strongly
- Trading range might be too small
- Wait for price to consolidate
- Not all markets have clear ranges
---
## ADVANCED TIPS
### 1. Count Point & Figure Charts
- Wyckoff used P&F to measure "cause"
- Width of range × height = minimum move target
- Longer accumulation = larger markup
### 2. Watch for Absorption
- High volume + narrow spread = someone absorbing
- In downtrend = accumulation
- In uptrend = distribution
### 3. Multiple Timeframe Springs
- Spring on daily + spring on weekly = very strong
- Increases probability significantly
### 4. Failed Signals Are Signals Too
- Failed spring = weakness, expect lower
- Failed UTAD = strength, expect higher
### 5. Context is King
- Don't buy during Phase E Markdown
- Don't sell during Phase E Markup
- Respect the major trend
### 6. Volume Precedes Price
- Study volume changes first
- Price follows volume
- Decreasing volume in range = building energy
### 7. Composite Operator Mindset
- Think like institutions
- Where would smart money buy/sell?
- They need liquidity (retail traders)
---
## RISK MANAGEMENT
### Position Sizing
**Conservative:**
- Risk 1% per trade
- Wider stops at range boundaries
**Moderate:**
- Risk 1-2% per trade
- Stops below spring/above UTAD
**Aggressive:**
- Risk 2-3% per trade
- Tight stops
- Higher win rate needed
### Stop Loss Placement
**Accumulation:**
- Below spring low
- Below trading range bottom
- Below demand zone
**Distribution:**
- Above UTAD high
- Above trading range top
- Above supply zone
### Take Profit Strategy
**Method 1: Measured Move**
- Range height = minimum target
- 2x range height = extended target
**Method 2: Fibonacci Extensions**
- 1.0 = range height
- 1.618 = extended target
- 2.618 = maximum target
**Method 3: Trail the Stop**
- Move stop to breakeven at 1R
- Trail under swing lows in markup
- Lock in profits progressively
---
## BACKTESTING CHECKLIST
Before trading with real money:
- Backtest on 50+ historical examples
- Record all signals in trading journal
- Calculate win rate (aim for >50%)
- Calculate average R:R (aim for >1:2)
- Test on multiple instruments
- Test on multiple timeframes
- Test in different market conditions
- Verify signal consistency
- Practice on demo account
- Start small with real money
---
## RECOMMENDED READING
### Books
1. **"Studies in Tape Reading"** - Richard D. Wyckoff
2. **"The Richard D. Wyckoff Method"** - Rubén Villahermosa
3. **"Charting the Stock Market: The Wyckoff Method"** - Jack Hutson
4. **"Master the Markets"** - Tom Williams (VSA)
### Courses
1. Wyckoff Analytics - Official Wyckoff course
2. TradeVSA - Volume Spread Analysis
3. StockCharts - Wyckoff education
### Communities
1. Wyckoff Analytics Forum
2. Reddit r/Wyckoff
3. TradingView Wyckoff ideas section
---
## FREQUENTLY ASKED QUESTIONS
**Q: Can I use this on crypto?**
A: Yes, works well on major cryptocurrencies with good volume.
**Q: Does it work on forex?**
A: Yes, but use futures volume (like 6E for EUR/USD) for better accuracy.
**Q: What's the best timeframe?**
A: Daily chart for most traders. 4H for more active trading.
**Q: How long does accumulation last?**
A: Typically 2-12 weeks. Longer accumulation = bigger markup.
**Q: Can I automate this?**
A: You can use the alerts, but manual analysis is recommended.
**Q: What's the win rate?**
A: With proper filtering: 60-70% on major signals (Spring, UTAD, SOS, SOW).
**Q: Should I trade every signal?**
A: No. Focus on Spring, UTAD, SOS, and SOW in trending markets.
**Q: What if I see conflicting signals?**
A: Use higher timeframe for context. When in doubt, stay out.
**Q: How do I know which phase I'm in?**
A: Check the table in top-right corner. Also look at background color.
**Q: Can I use this for options trading?**
A: Yes, excellent for timing option entries (especially around Spring/UTAD).
---
## FINAL THOUGHTS
The Wyckoff Method is:
- **A complete trading system** (not just an indicator)
- **Based on 100+ years** of market wisdom
- **Used by institutions** and professional traders
- **Requires practice** and screen time
- **Highly effective** when applied correctly
**Success Tips:**
1. Start with daily charts
2. Focus on major events (SC, Spring, SOS, BC, UTAD, SOW)
3. Always check higher timeframe context
4. Wait for confirmation before entering
5. Manage risk properly
6. Keep a trading journal
7. Be patient - wait for the best setups
**Remember:**
- Not every range will have all events
- Some phases may be abbreviated
- Context and confluence matter most
- Practice makes perfect
---
## SUPPORT & UPDATES
For questions, improvements, or bug reports:
- Check TradingView script comments
- Join Wyckoff trading communities
- Study historical examples
- Practice on demo accounts
**Good luck and happy trading!**
---
*Disclaimer: This indicator is for educational purposes. Always do your own analysis and risk management. Past performance does not guarantee future results.*
# WYCKOFF VISUAL SETUP EXAMPLES
## ACCUMULATION SCHEMATIC #1 (Classic Bottom)
```
Price Chart View:
│ PHASE E
│ MARKUP
│ ╱
│ ╱
┌─SOS─────┤ ╱
│ │ ╱
┌───────────┤ ┌LPS │╱
│ PHASE B │ │ │
│ (Cause) └──┴──────┤
┌AR──┤ │
┌────┤ │ ┌─Spring │ PHASE D
│ └ST──┤ │ │
│ │ │ │
────SC────────┴─────────┴───────────┴──────────
│
PS
│ PHASE A
│
Downtrend
```
### PHASE A - Stopping the Downtrend
```
PS: │ High volume down bar
▼ First sign of support
■ Not bottom yet
SC: │ VERY HIGH volume
▼ Panic selling exhaustion
█ Long lower wick
█ This is the low
AR: │ Automatic rally
▲ Relief bounce
■ High volume acceptable
ST: │ Secondary test
▼ Low volume (KEY!)
■ Tests SC low
```
### PHASE B - Building the Cause
```
┌─────────┐
│ ~~~ │ Multiple tests
│ ~ ~ │ Volume decreases
│~ ~ │ Range gets tighter
└─────────┘
Duration: 2-12 weeks typical
The longer, the bigger the eventual move
```
### PHASE C - The Test (SPRING)
```
║ False breakdown
─────╨─────
▼ Low volume
█ Breaks below support
■
█ Quick reversal
▲ Closes ABOVE support
CRITICAL: Volume must be LOW
Close must be strong
Happens quickly (1-3 bars)
```
### PHASE D - Strength Emerges
```
SOS: ▲ Sign of Strength
────╥──── Break above resistance
║ High volume
║ Wide spread
LPS: ▼ Last Point Support
■ Pullback on LOW volume
▲ Great entry point
BU: ▲ Backup
■ Final consolidation
▲ Before markup
```
### PHASE E - Markup
```
╱
╱
╱ Strong uptrend
╱ High momentum
╱ Can last months/years
──╱──
```
---
## DISTRIBUTION SCHEMATIC #2 (Classic Top)
```
Price Chart View:
Uptrend
│
PSY
│ PHASE A
────BC────────┬─────────┬───────────┬──────────
│ │ UTAD │
│ PHASE B │ │ PHASE D
┌AR──┤ ┌LPSY │ │
│ │ │ └───────────┤
│ └──┴──────┐ │╲
└ST──┤ │ │ ╲
│ └───────────┤ ╲
└─SOW─────┤ │ ╲
│ │ ╲
│ PHASE C │ ╲
│ │ PHASE E
│ │ MARKDOWN
```
### PHASE A - Stopping the Uptrend
```
PSY: │ High volume up bar
▲ Preliminary supply
■ Selling starting
BC: │ VERY HIGH volume
▲ Buying climax
█ Euphoric top
█ Long upper wick
AR: │ Automatic reaction
▼ Sharp selloff
■ High volume
ST: │ Secondary test
▲ Low volume (KEY!)
■ Tests BC high
```
### PHASE C - The Test (UTAD)
```
▲ False breakout
────╥────
║ Breaks ABOVE resistance
║ Often high volume spike
▼
█ Rejection / weak close
█ Closes BELOW resistance
▼
CRITICAL: Closes weak
Quick rejection
Traps buyers
```
### PHASE D - Weakness Emerges
```
SOW: ▼ Sign of Weakness
────╨──── Break below support
║ High volume
║ Wide spread
LPSY: ▲ Last Point Supply
■ Rally on LOW volume
▼ Last chance to exit
```
---
## VOLUME PATTERNS (Critical to Understanding)
### ACCUMULATION Volume Pattern
```
Volume
│ SC
█
█ ST
■ ■ Spring
■ ■ ■ SOS LPS
──┴────┴────┴──────█───■────►
│ │ │ │ │
│ │ │ │ │
A A C D D
Pattern: HIGH → low → low → HIGH → low
Key: Volume DECREASES during range
INCREASES on breakout
```
### DISTRIBUTION Volume Pattern
```
Volume
│ BC
█
█ ST
■ ■ UTAD
■ ■ ■ SOW LPSY
──┴────┴────┴──────█───■────►
│ │ │ │ │
│ │ │ │ │
A A C D D
Pattern: HIGH → low → varies → HIGH → low
Key: Volume MAY increase on UTAD
Definitely HIGH on breakdown (SOW)
```
---
## REAL TRADE SETUPS
### Setup #1: SPRING BUY
```
Entry Conditions:
1. Clear trading range identified
2. Price breaks BELOW support
3. Volume is LOW (critical!)
4. Price reverses QUICKLY
5. Closes ABOVE support level
Entry: Next bar or on retest
Stop: Below spring low
Target: Top of range (minimum)
Example:
Support: $100
Spring low: $98 (low volume)
Close: $101
Entry: $102
Stop: $97.50
Target: $120 (range top)
Risk/Reward: 1:4
```
### Setup #2: UTAD SELL
```
Entry Conditions:
1. Clear trading range identified (after uptrend)
2. Price breaks ABOVE resistance
3. Often high volume spike
4. Price reverses QUICKLY
5. Closes BELOW resistance level
Entry: Next bar or on retest
Stop: Above UTAD high
Target: Bottom of range (minimum)
Example:
Resistance: $200
UTAD high: $205 (spike)
Close: $198
Entry: $197
Stop: $206
Target: $180 (range bottom)
Risk/Reward: 1:2
```
### Setup #3: SOS BREAKOUT
```
Entry Conditions:
1. Clear accumulation range
2. Spring already occurred (ideal)
3. Price breaks ABOVE resistance
4. HIGH volume on breakout
5. Wide spread up bar
Entry Option A: On breakout ($120)
Entry Option B: Wait for LPS pullback ($115)
Stop: Below range or LPS
Target: Range height projected up
Example:
Range: $100-$120 (20 points)
SOS breakout: $120
Entry A: $120
Stop: $115
Target 1: $140 (100%)
Target 2: $150 (150%)
```
---
## VSA SPECIFIC PATTERNS
### Pattern 1: No Demand (Weakness)
```
▲
■ Up bar
■ Low volume ◄── KEY
▲ Small body
Context: After uptrend
Meaning: Buyers exhausted
Action: Prepare to sell
```
### Pattern 2: No Supply (Strength)
```
▼
■ Down bar
■ Low volume ◄── KEY
▼ Small body
Context: After downtrend
Meaning: Sellers exhausted
Action: Prepare to buy
```
### Pattern 3: Stopping Volume
```
═ Very high volume
█ Narrow spread ◄── KEY
═ Price not moving
Context: At extremes
Meaning: Absorption
Action: Expect reversal
```
---
## COMMON MISTAKES (What NOT to Do)
### ❌ Mistake 1: Buying Prematurely
```
WRONG:
SC
▼
█ ← DON'T BUY HERE
CORRECT:
Spring
─────╨─────
▼
█ ← BUY HERE
▲
```
### ❌ Mistake 2: Ignoring Volume
```
WRONG: "It broke below support, must be spring"
─────╨───── High volume
█
This is a BREAKDOWN, not a spring!
CORRECT Spring:
─────╨───── LOW volume ✓
■ Quick reversal ✓
▲
```
### ❌ Mistake 3: Trading Against Trend
```
WRONG:
Markdown Phase E
╲
╲ ← Trying to buy here
╲
╲
CORRECT:
Wait for new accumulation to complete
```
---
## MULTI-TIMEFRAME EXAMPLE
### Weekly Chart: Phase E Markup (Bullish)
```
╱
╱
╱ Long-term uptrend
╱
───╱─────
```
### Daily Chart: Re-Accumulation Phase C
```
┌─────────┐
│ Spring │ ← We are here
│ ▼ │
─────┴────█────┴─────
▲
```
### 4-Hour Chart: Entry Timing
```
Last 48 hours:
─────╨───── Spring occurred
█
▲ ← Enter now
■
```
**Result:** Triple confirmation across timeframes = High probability trade
---
## PROFIT TARGETS (Visual Guide)
### Method 1: Basic Measured Move
```
Resistance: 120 ┐ ─────────
│
│ 20 points
│
Support: 100 ┘ ─────────
Breakout: 120
Target: 120 + 20 = 140
╱╱╱ 140 (Target)
╱╱╱
╱╱╱
──────◄ 120 (Breakout)
│
Range │ 20
│
──────┘ 100
```
### Method 2: Multiple Targets
```
╱╱╱ 150 (Target 3: 2.5x) - 20% position
╱╱╱
╱╱╱ 140 (Target 2: 2x) - 30% position
╱╱╱
─────◄╱ 130 (Target 1: 1x) - 50% position
│
10 │ 120 (Breakout)
│
─────┘ 110 (Support)
```
### Method 3: Trailing Stop
```
1. Move stop to breakeven at Target 1
2. Trail stop under swing lows
3. Let winners run
╱╱╱
╱ ╱╱ ← Trail stop here
╱╱ ╱
╱ ╱ ← Then here
─────◄──╱
← Start here (breakeven)
```
---
## TIMING ENTRIES (Exact Bar Patterns)
### Perfect Spring Entry
```
Bar 1: ▼ Breaks below (Low vol)
█
Bar 2: ▲ Reverses (Closes strong)
█ ◄─ ENTER HERE
Bar 3: ■ Confirms
▲
DON'T WAIT for Bar 3!
Enter on Bar 2 close
```
### Perfect UTAD Entry
```
Bar 1: ▲ Breaks above (Spike vol OK)
█
Bar 2: ▼ Reverses (Closes weak)
█ ◄─ ENTER HERE
Bar 3: ■ Confirms
▼
SHORT on Bar 2 close
Don't wait for more confirmation
```
---
## COMPOSITE OPERATOR PSYCHOLOGY
### What Smart Money Does (Follow Them)
**Accumulation:**
```
1. Create fear (PS, SC)
2. Shake out weak hands (Spring)
3. Absorb supply quietly (Phase B)
4. Test for remaining supply (Test)
5. Mark it up (SOS → Phase E)
💰 They buy LOW when retail panics
```
**Distribution:**
```
1. Create euphoria (PSY, BC)
2. Trap late buyers (UTAD)
3. Distribute to buyers (Phase B)
4. Test for remaining demand (ST)
5. Mark it down (SOW → Phase E)
💰 They sell HIGH when retail buys
```
### Where to Look for Smart Money
```
💰 Buy signals appear at:
- Demand zones (green boxes)
- Springs and shakeouts
- Tests of support
- After selling climax
💰 Sell signals appear at:
- Supply zones (red boxes)
- UTAD and upthrusts
- Weak rallies (LPSY)
- After buying climax
```
---
## PRACTICE EXERCISES
### Exercise 1: Identify the Phase
Look at any chart and ask:
1. Is there a trading range? (Phase B likely)
2. Did we just stop a trend? (Phase A)
3. Was there a spring/UTAD? (Phase C)
4. Is there a breakout? (Phase D)
5. Is trend running? (Phase E)
### Exercise 2: Volume Analysis
For each bar, note:
- Volume level (High/Normal/Low)
- Spread (Wide/Normal/Narrow)
- Effort vs Result (Matching? Diverging?)
### Exercise 3: Find Historical Springs
Go back 6 months:
- Mark all springs you can find
- Note the setup before each
- Track what happened after
- Calculate win rate
---
## FINAL VISUALIZATION: The Complete Cycle
```
ACCUMULATION → MARKUP → DISTRIBUTION → MARKDOWN → ACCUMULATION...
Distribution Accumulation
(Top) (Bottom)
┌───────────────┐ ┌───────────────┐
│ BC UTAD │ │ Spring SC │
│ │ │ │ │ │ │ │
────┴───┴───┴───────┴─╲ ╱────────┴───┴───┴────
╲ ╱
Markdown ╲ ╱ Markup
(Phase E) ╲ ╱ (Phase E)
╲ ╱
╲ ╱
╲ ╱
╲ ╱
V
The market cycles endlessly
Your job: Identify where you are in the cycle
Trade accordingly
```
---
**Remember:**
- 📊 Study charts daily
- 📝 Journal every setup
- 🎯 Wait for the best signals
- 💰 Follow smart money
- ⏰ Be patient
- 🚀 Let winners run
**The indicator does the heavy lifting - you make the decisions!**


GK Zero-Lag Major BOS TrendGK ZERO-LAG Major BOS Trend
is a technical indicator designed to highlight breaks of structure BOS
in the direction of the prevailing trend
The script uses a zero-lag trend filter combined with confirmed structural high/low breaks to reduce noise and avoid minor or premature prints.
Print labels are only printed after candle close, ensuring stable, and confirmed prints
The indicator is designed to help traders identify trend continuation and structural shifts,
making it suitable as a confirmed tool across multiple markets and timeframes.
Best used on higher timeframes 5/15/30Min 2/3/4Hour
also resistance and support lines
Disclaimer
this indicator is provided for educational purposes only

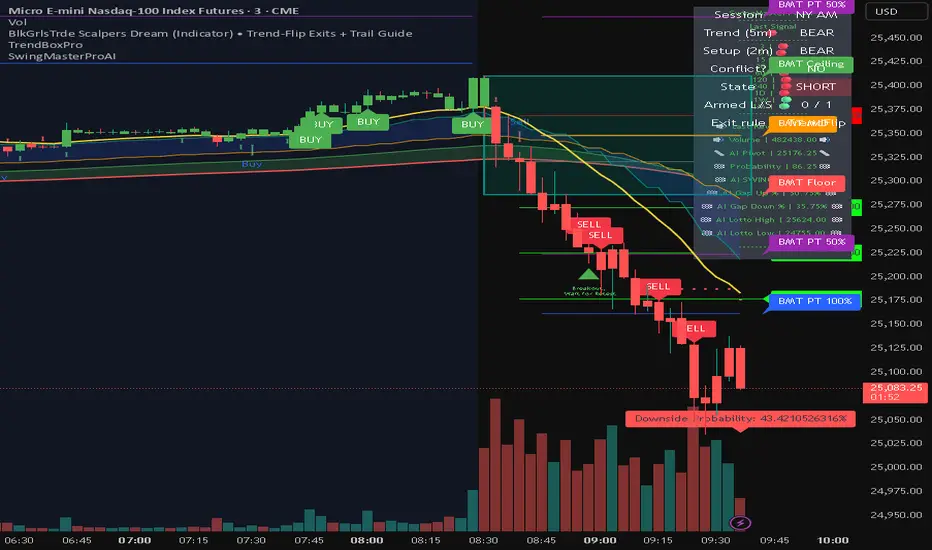
BlkGrlsTrde Scalpers DreamBlkGrlsTrde – Scalpers Dream (MNQ)
BlkGrlsTrde – Scalpers Dream is a discretionary scalping indicator designed specifically for Micro E-Mini Nasdaq (MNQ) traders who want clear, structured entries and exits without clutter or over-engineering.
This tool focuses on momentum continuation after key price reactions, helping traders stay aligned with higher-timeframe context while executing on lower timeframes such as the 1-minute chart.
What It Provides
Clear BUY and SELL signals for scalp entries
Structured trade levels with:
Stop level
TP1 (partial target)
TP2 (runner target)
Exit signals, including:
TP1 hit
TP2 hit
Stop hit
Exit on opposite signal
No-Trade (Conflict) state when conditions do not align, displayed clearly in gray so you know when to stand down
Session awareness for London, NY AM, and NY PM trading windows
On-chart status panel showing current market state at a glance
Designed For
MNQ scalpers
Traders who prefer structure but manual execution
Traders who want clarity over complexity
Live trading during active sessions without constant indicator stacking
How to Use
Best used on MNQ 1-minute charts
Take signals in the direction of the displayed bias
Manage risk using the plotted stop and targets
Stand aside during NO TRADE states
Use TP1 to reduce risk and TP2 for runners
This is an indicator, not an automated trading system. It is intended to support disciplined decision-making, not replace it.
Disclaimer
This indicator is for educational and informational purposes only. Trading futures involves substantial risk. Always manage risk appropriately and trade within your plan.
EBP Auto Fibonacci Drawer 👑 Daily EBP Trading Strategy (Final Refined Summary)
This is a daily price action strategy that combines a specific reversal candle (EBP) with a Fibonacci retracement for a confirmed trend continuation entry.
1. 🕯️ The Signal Candle (EBP Confirmation)
Wait for a single daily candle to close that meets two strict criteria:
Liquidity Sweep: The candle's low must first wick below the low of the preceding day.
Strong Reversal: The candle must then reverse and close above the high of the preceding day (confirming a strong move).
2. 📐 Fibonacci Retracement Setup
The Fibonacci Retracement tool is applied to the newly confirmed EBP Candle to define the retracement and entry zone for the next day.
Drawing the Fib (for a Buy Setup): Draw the Fib from the EBP Candle's Close to the EBP Candle's Low.
3. 🎯 Entry and Risk Management
The trade is executed on the next candle (Day 2) after the price retraces and then reverses, confirmed by a candle close.
Action Retracement & Entry Condition Stop Loss (SL) Placement Target (TP) Placement
Buy (Long) Price retraces into the Fib levels, and then the candle CLOSES above any of the key breakout levels: 0%, 25%, 50%, 75%, or 100%. Placed at the Most Recent Swing Low (The lowest point before the EBP candle's move). The EBP Candle's High Wick.
Sell (Short) (Inverse) Price retraces into the Fib levels, and then the candle CLOSES below any of the key breakout levels: 0%, 25%, 50%, 75%, or 100%. Placed at the Most Recent Swing High (The highest point before the EBP candle's move). The EBP Candle's Low Wick.
Export to Sheets
Key Takeaways:
Timeframe: Daily candles are used for all signals and entries.
Entry Trigger: A confirmed candle close outside the Fib level is required, not just a wick or price crossing.
Risk Control: The Stop Loss is set at a structural point (the recent swing) for better protection.
Would you like to search for examples of this "Engineered Block Pricing" (EBP) candle pattern on a chart? That clarification makes sense, as placing the Stop Loss (SL) at the recent swing low (or high for a short) is a more conservative and structurally sound location than just the immediate EBP candle's wick.
Here is the final, fully refined summary of the Daily EBP Trading Strategy, incorporating all criteria: the specific signal candle, the Fibonacci retracement levels, the candle close entry trigger, and the recent swing low/high for the stop loss.
👑 Daily EBP Trading Strategy (Final Refined Summary)
This is a daily price action strategy that combines a specific reversal candle (EBP) with a Fibonacci retracement for a confirmed trend continuation entry.
1. 🕯️ The Signal Candle (EBP Confirmation)
Wait for a single daily candle to close that meets two strict criteria:
Liquidity Sweep: The candle's low must first wick below the low of the preceding day.
Strong Reversal: The candle must then reverse and close above the high of the preceding day (confirming a strong move).
2. 📐 Fibonacci Retracement Setup
The Fibonacci Retracement tool is applied to the newly confirmed EBP Candle to define the retracement and entry zone for the next day.
Drawing the Fib (for a Buy Setup): Draw the Fib from the EBP Candle's Close to the EBP Candle's Low.
3. 🎯 Entry and Risk Management
The trade is executed on the next candle (Day 2) after the price retraces and then reverses, confirmed by a candle close.
Action Retracement & Entry Condition Stop Loss (SL) Placement Target (TP) Placement
Buy (Long)
Price retraces into the Fib levels, and then the candle CLOSES above any of the key breakout levels: 0%, 25%, 50%, 75%, or 100%.
Placed at the Most Recent Swing Low (The lowest point before the EBP candle's sharp move). The EBP Candle's High Wick.
Sell (Short) (Inverse) Price retraces into the Fib levels, and then the candle CLOSES below any of the key breakout levels: 0%, 25%, 50%, 75%, or 100%.
Placed at the Most Recent Swing High (The highest point before the EBP candle's sharp move). The EBP Candle's Low Wick.

Line9EMA+BOLL
The 9 EMA moving averages can be freely adjusted, and they are overlaid with the upper, middle, and lower bands of the Bollinger Bands.

Supply & Demand - Trading Vidhyalaya (Free)A powerful script that automatically plots Supply and Demand zones on your chart. Designed to help traders identify potential reversal areas with precision.
Free Version Capabilities:
Works exclusively on the Daily (1D) Timeframe.
Includes Wick & Strong validation logic.
📍 Pinpoint accurate reversals.
🔔 Real-time alerts for Daily zones.
📉 "Touched" zone logic to keep your chart clean.
Want to use this on Intraday Charts? The Premium version supports ALL Timeframes (1m to Monthly) and includes Multi-Timeframe (MTF) overlay capabilities.

Line6EMA+BOLL
The values of the six EMA moving averages can be freely adjusted, and it also integrates the upper, middle, and lower lines of the Bollinger Bands.

Vhenom ORB A+ (Professional)Vhenom ORB A+ (Professional)
Advanced Opening Range Breakout System with A+ Momentum & Failure Detection
What This Indicator Is
Vhenom ORB A+ (Professional) is a precision-built Opening Range Breakout system designed for active index futures traders who want early entries, objective confirmation, and protection against false breakouts.
This is not a generic ORB clone.
It is a multi-session, momentum-aware, reversal-aware trading framework built specifically to handle:
Explosive breakouts
Failed breakouts
Intraday continuation
Reversals back into range
Real-time decision-making (not just candle-close hindsight)
Core Philosophy
Most ORB indicators fail because they:
Only work at candle close
Treat all breakouts the same
Ignore volatility context
Provide no framework for failed moves
Vhenom ORB A+ solves all of that.
It does not tell you what to trade.
It tells you when conditions are objectively favorable.
🔹 Key Features
1️⃣ Multi-Session ORB Engine (NY Time)
Define ORBs across multiple intraday windows, not just the cash open:
NY Cash Open (09:30–09:45)
Midday Expansion
Power Hour
Evening Session
Overnight Sessions
Fully customizable ORB windows
Each ORB:
Draws High / Low / Midline in real time
Freezes when complete
Automatically rolls forward into the next session
No repainting of historical ORBs.
2️⃣ Real-Time Breakout Detection (Live Preview)
Unlike most indicators, Vhenom ORB A+ can signal intrabar:
Signals flicker live as price breaks the ORB
Signals confirm on candle close
If price re-enters the range, the signal disappears
This allows:
Earlier entries for aggressive traders
Confirmed entries for conservative traders
You choose.
3️⃣ A+ Momentum Engine (ATR-Based)
Not all breakouts are equal.
The A+ Engine measures candle expansion relative to ATR to identify true momentum breakouts.
When an A+ breakout occurs:
The candle is highlighted
The label upgrades to A+ Buy / A+ Sell
Optional filtering: require A+ for signals or use it as a visual upgrade
This helps eliminate:
Chop
Low-energy fake moves
Weak breakouts that stall immediately
4️⃣ Failure Mode (Reversal Detection)
This is where most ORB tools fall apart.
Vhenom ORB A+ actively monitors failed breakouts.
If price:
Breaks out of the ORB
Fails to hold
Re-enters the range within a defined window
The indicator generates:
R Buy (failed downside breakout)
R Sell (failed upside breakout)
With:
Acceptance-by-close logic
Minimum bar delay (no same-candle chaos)
Optional live preview
This allows traders to:
Capture reversals
Avoid chasing failed breakouts
Trade against trapped participants
5️⃣ Conflict Protection (No Mixed Signals)
The logic explicitly prevents:
Buy and Sell on the same candle
Breakout and reversal on the same bar
Overlapping signal noise
If a conflict ever exists:
Sell wins (conservative bias)
The system is intentionally opinionated to reduce indecision.
6️⃣ Candle Coloring for Immediate Context
Candle colors provide instant visual feedback:
A+ Breakout candles
Failed breakout reversal candles
Priority rules ensure clarity (Reversal > A+)
You can glance at the chart and know what just happened.
🔹 Designed For
This indicator is ideal for:
NQ / ES / MNQ / MES traders
GC / MGC traders
ORB, momentum, and reversal traders
Traders who scale quickly and manage stops tightly
Traders who want structure, not guesses
It works on any symbol or timeframe, but is optimized for index futures.
🔹 What This Is NOT
❌ Not a signal bot
❌ Not a “win every trade” system
❌ Not meant for set-and-forget trading
This tool gives high-quality decision points — execution is up to you.
🔹 Basic vs Professional
Basic Version
NY Cash Session ORB only
ORB lines only
No momentum logic
No reversals
Professional Version (This)
Multiple ORB sessions
Live breakout preview
A+ momentum detection
Failure / reversal detection
Advanced filtering & controls
Designed for real trading, not hindsight
🔹 Final Notes
This indicator was built by a trader, refined through real market behavior, and designed to expose opportunity and risk at the same time.
If you understand:
Opening ranges
Volatility
Acceptance vs rejection
Risk management
Vhenom ORB A+ gives you an edge — not a crutch.

Volume Orderblock Breakout v3.6this is indicator that shows long short siganl and tp lines can be checked.
you can get profit by this forever.
we can win over whales
keep going don't give up!!!


APS - Sweeps & BOSThis indicator identifies pivot highs and lows, detects liquidity sweeps, and marks Break of Structure (BOS).
Key Features:
1) Pivot Detection :
The script uses configurable left and right bar parameters to identify significant pivot highs and lows, marking them with "X" labels on the chart. These pivots represent potential areas where price may react.
2) Sweep Detection :
A sweep occurs when price temporarily moves beyond a previous pivot level but closes back inside, suggesting a liquidity grab or stop hunt. The indicator draws horizontal lines connecting the original pivot to the sweep location and labels these events. Sweeps often precede reversals as they collect liquidity before moving in the opposite direction.
3) Break of Structure (BOS) :
BOS events are marked when price closes beyond a previous pivot level, indicating a potential shift in market structure. Bullish BOS occurs when price closes above a pivot high, while Bearish BOS occurs when price closes below a pivot low. These can signal continuation moves or trend changes.
4) Previous Day High/Low (PDH/PDL):
The indicator tracks the previous session's high and low (based on 6 PM ET session breaks, which auto-adjusts for DST) and displays whether these levels have been breached. It also calculates and displays a 50% equilibrium line between PDH and PDL.
5) Higher Timeframe Context :
A table in the top-right corner shows whether the higher timeframe close is in premium (above equilibrium) or discount (below equilibrium) territory. The HTF automatically adjusts based on your current timeframe.
6) Customization Options:
Adjustable pivot sensitivity (left/right bars)
Configurable sweep lookback period
Customizable colors, line styles, and label sizes for all elements
Toggle visibility for any component
Optional alerts for sweeps and BOS events
How to Use:
Sweeps near support/resistance often indicate liquidity grabs before reversals
BOS events can confirm directional bias changes
Use PDH/PDL levels as reference points for intraday trading
Consider HTF context when taking trades (discount zones for longs, premium zones for shorts)
Important Notes:
This indicator is designed for educational purposes and market analysis. Past patterns do not guarantee future results. Please follow proper risk management.

Liquidity Buy SignalLiquidity Buy Signal is an indicator designed to detect BUY entries based on liquidity (swing lows) combined with a bullish reversal candle pattern. It automatically marks recent swing-low zones/levels, tracks the transition from solid → dashed when a level gets broken, and then confirms a signal when price sweeps/cuts the correct level and a bullish candle pattern appears.
OANDA:EURUSD
BUY signal (green triangle) triggers when:
A bullish reversal candle pattern (based on a set of rules) is detected, and
The Liquidity chain conditions are satisfied using the most recent swing lows:
Price crosses the level with the lower wick, or
The level is within the lower 30% range of the previous candle (n-1), and
The level does not pass through the bodies of older candles (filtered by lookback).
Key settings:
Pivot Lookback: controls swing-low detection sensitivity.
Swing Area: Wick Extremity / Full Range for zone definition.
Filter lookback older bodies: filters out levels that intersect older candle bodies (skips n-2).
Style: toggle Swing Low display + zone/line colors.
Alerts:
Includes a built-in alertcondition for BUY signals (useful for notifications/webhooks).
This indicator is especially well-suited for identifying potential bottoms in a downtrend.
Note: This tool provides trading signals and should be combined with context (trend/HTF/volume/risk management) before entering trades. Not financial advice.

DMA % Movement vs Avg (v6)This script can give a directional guidance based on DMA trend. There is a small label which will indicate the % increment based on a look back period. Since we work as 200 DMA as ref. this is best used for daily and weekly charts only.
PS: DoesNOT work for monthly charts !!


Multi-TF EMAs (50/100/200)This indicator plots 9 Exponential Moving Averages (EMAs) on your chart, combining three key EMA lengths (50, 100, 200) across three higher timeframes (Daily, Weekly, Monthly). This allows traders to identify dynamic support/resistance levels and trend direction across multiple timeframes without switching charts.

UK100 London Judas & IFVG SetupUK100 London Judas & IFVG Setup
Overview This indicator is a specialized trading tool designed to automate the ICT Judas Swing strategy specifically for the UK100 (FTSE 100) index during the London Market Open. It combines institutional time-based logic with price action confirmation using Inversion Fair Value Gaps (IFVG) to identify high-probability reversal setups.
How It Works The strategy is based on the concept that the initial move after the London Open is often a "fake-out" (manipulation) designed to trap retail traders and engineer liquidity before the true trend of the day begins.
Session & Opening Price:
The script marks the London Open price (default 09:00 Warsaw / 08:00 London time) with a dashed line.
This serves as the "line in the sand." Prices moving away from this line initially are monitored for manipulation.
Judas Swing (Liquidity Sweep):
If price moves BELOW the open, it is hunting Sell-Side Liquidity (trapping sellers).
If price moves ABOVE the open, it is hunting Buy-Side Liquidity (trapping buyers).
The Entry Trigger: Inversion FVG (IFVG):
The indicator scans for Fair Value Gaps (FVG) created during the manipulation phase.
BUY Signal: The price manipulates lower, creates a Bearish FVG (Red Box), but then aggressively reverses and closes ABOVE that gap. The gap is now "Inverted" (turns Green), acting as support.
SELL Signal: The price manipulates higher, creates a Bullish FVG (Green Box), but then aggressively reverses and closes BELOW that gap. The gap is now "Inverted" (turns Orange), acting as resistance.
Key Features
Automated Pattern Recognition: No need to manually draw gaps. The script detects valid FVG inversions that align with the Judas Swing logic.
Built-in Risk Calculator: The signal labels display the exact Lot Size you should use based on your account balance and risk percentage (default 0.5%). It calculates this dynamically based on the Stop Loss distance.
Institutional Targets: The indicator fetches H1 Fractals (Liquidity) from the 1-hour timeframe and plots them on your 1-minute chart as blue lines. These are your primary Take Profit (TP) levels.
Stop Loss Visualization: Automatically suggests a Stop Loss placement behind the swing high/low of the reversal structure.
How to Use
Timeframe: Set your chart to 1 Minute (1m).
Asset: UK100 (FTSE 100).
Wait: Allow the London session to open. Watch for price to move away from the opening line.
Execute: When a BUY or SELL label appears:
Enter the trade using the Lot Size shown on the label.
Set your Stop Loss at the price shown on the label.
Target the blue H1 Liquidity lines for profit taking.
Settings
Timezone: Set this to your chart/exchange timezone (Default: Europe/Warsaw).
Account Balance: Input your current trading capital (e.g., 100,000) for accurate risk calculations.
Risk Per Trade %: The percentage of your account you are willing to lose if the Stop Loss is hit (Standard: 0.5% - 1.0%).
Contract Size: The value of 1 point movement (Check your broker's specifications. Usually 1 for CFDs).
Alerts You can set a single alert in TradingView to capture all signals. Select the indicator and choose "Any alert() function call". You will receive a notification with the direction (Buy/Sell), Entry Price, and Lot Size.

Precision Candle (Multi-Asset)This Script Helps in finding a Precision Candle, which signifies a potential crack in correlated assets.
you can choose between 2 or 3 assets.
make sure to use the same time frame across all assets.
Enjoy !

Magical Thirteen Turns - The Greedy SnakeThe number 9 appears:
Meaning: Warning signal. The rise may encounter resistance and a cautious pullback is about to begin.
Operation: Consider reducing your holdings (selling a portion) to lock in profits and avoid experiencing wild fluctuations.
The number 13 appears:
Meaning: Strong sell signal. The upward momentum is likely to be exhausted, which is also known as "bull exhaustion".
Operation: It is recommended to liquidate your positions or significantly reduce them. Short sell (if you are trading contracts).

HTF Suspension Blocks [TakingProphets]-----------------------------------------------------------------------------------------------
HTF SUSPENSION BLOCKS
-----------------------------------------------------------------------------------------------
HTF Suspension Blocks bring ICT’s Suspension Block concept into a multi-timeframe workflow by detecting the 3-candle pattern on higher timeframes and projecting those zones directly onto your current execution chart.
Instead of only seeing Suspension Blocks on the timeframe they form, this script identifies valid HTF formations, draws their ranges on your lower timeframe, extends them forward, and manages invalidation automatically. You get higher-timeframe context while staying in your execution environment.
-----------------------------------------------------------------------------------------------
PURPOSE AND SCOPE
-----------------------------------------------------------------------------------------------
- Detect ICT-style Suspension Blocks on multiple higher timeframes (HTF 1 / HTF 2 / HTF 3)
- Project HTF blocks onto the current chart using bar-time anchored drawing
- Require measurable body-to-body separation defined in true ticks (instrument-aware)
- Auto-extend blocks forward in time until invalidation
- Optional Consequent Encroachment (50% equilibrium) inside each block
- Per-timeframe visibility limiting so charts stay clean and actionable
- Labels each block with the originating HTF (ex: M5 / M15 / M60)
- Alerts for:
- New HTF bullish / bearish block formation
- Price entering into any HTF bullish / bearish block
- Session-restricted alert windows (New York time)
-----------------------------------------------------------------------------------------------
WHAT IS A SUSPENSION BLOCK
-----------------------------------------------------------------------------------------------
A Suspension Block is a strict 3-candle displacement sequence defined by body-to-body gaps around a middle candle. This HTF variant uses the same model, but evaluates the pattern on a higher timeframe and then projects the zone onto your current chart.
Bullish Suspension Block logic:
- HTF Candle 1 close is BELOW HTF Candle 2 open by at least Minimum Body Separation
- HTF Candle 3 open is ABOVE HTF Candle 2 close by at least Minimum Body Separation
- HTF Candle 3 open is ABOVE HTF Candle 1 close to ensure a valid vertical span
- Block vertical span: Candle 1 close (low) to Candle 3 open (high)
- Block remains valid until price CLOSES below the block low (Candle 1 close)
Bearish Suspension Block logic (mirror conditions):
- HTF Candle 1 close is ABOVE HTF Candle 2 open by at least Minimum Body Separation
- HTF Candle 3 open is BELOW HTF Candle 2 close by at least Minimum Body Separation
- HTF Candle 3 open is BELOW HTF Candle 1 close to ensure a valid vertical span
- Block vertical span: Candle 1 close (high) to Candle 3 open (low)
- Block remains valid until price CLOSES above the block high (Candle 1 close)
All gap calculations are normalized using `syminfo.mintick` so the “ticks” setting behaves correctly across instruments.
-----------------------------------------------------------------------------------------------
GENERAL SETTINGS
-----------------------------------------------------------------------------------------------
- Minimum Body Separation (ticks)
- Minimum required body-to-body gap in HTF tick units
- Used for both:
- Candle 1 close to Candle 2 open separation
- Candle 2 close to Candle 3 open separation
- Examples:
- 0.25 = quarter-tick gap
- 1.0 = full tick gap
-----------------------------------------------------------------------------------------------
TIMEFRAMES
-----------------------------------------------------------------------------------------------
This script supports up to 3 higher timeframe sources. Each HTF has:
- Enable toggle
- Timeframe selector
- Per-timeframe Max Blocks visibility control
HTF 1 / HTF 2 / HTF 3:
- These are the timeframes the script scans for Suspension Blocks
- Blocks are drawn only when your current chart timeframe is LOWER than the selected HTF
- This prevents duplicate / redundant rendering when you’re already on the HTF or higher
Max Blocks per timeframe:
- Limits the number of most-recent blocks shown per side (bullish + bearish) for that HTF
- 0 = show all blocks for that timeframe
-----------------------------------------------------------------------------------------------
VISUALIZATION SETTINGS
-----------------------------------------------------------------------------------------------
Bullish Blocks:
- Toggle visibility
- Fill color controls opacity / emphasis
- Optional border with selectable style (Solid / Dashed / Dotted)
Bearish Blocks:
- Toggle visibility
- Fill color controls opacity / emphasis
- Optional border with selectable style (Solid / Dashed / Dotted)
Consequent Encroachment (CE):
- Optional 50% equilibrium line drawn inside each block
- Style options (Solid / Dashed / Dotted)
- Automatically extends as blocks extend
HTF Labels:
- Each block is labeled with its originating timeframe (ex: M5 / M15 / M60)
- Label styling includes:
- Text color
- Size (Tiny / Small / Normal / Large)
- Labels are intentionally hidden on non-visible blocks when visibility limiting is active
-----------------------------------------------------------------------------------------------
HOW HTF PROJECTION WORKS
-----------------------------------------------------------------------------------------------
- The script requests the last 3 candles of each selected HTF via `request.security()`
- It maps those HTF candles into the standard 3-candle Suspension Block model:
- Candle 1 = oldest
- Candle 2 = middle
- Candle 3 = most recent
- When a valid block forms:
- A box is created using `xloc.bar_time`
- The left side anchors to the HTF candle timestamp
- The right side projects forward to the current chart time
- Each HTF has its own independent storage set:
- Bull boxes, bear boxes
- High / low bounds
- CE lines
- Labels
-----------------------------------------------------------------------------------------------
BLOCK MANAGEMENT & INVALIDATION
-----------------------------------------------------------------------------------------------
- All blocks extend forward automatically to the current bar time
- Bullish invalidation:
- Block is removed when price CLOSES below the block low
- Bearish invalidation:
- Block is removed when price CLOSES above the block high
- When a block invalidates:
- The box is deleted
- Its CE line is deleted
- All stored references are removed from the set
This keeps the chart focused on active HTF zones only.
-----------------------------------------------------------------------------------------------
VISIBILITY LIMITING
-----------------------------------------------------------------------------------------------
Each timeframe’s “Max Blocks” setting controls how many blocks per side remain visible.
When Max Blocks > 0:
- The script calculates distance from current price to every stored block range
- It keeps the closest N blocks per side (bullish + bearish)
- Blocks not kept are made fully transparent:
- Hidden fill
- Hidden border
- Hidden CE line
- Hidden label text
This gives you the most relevant HTF structures near price without clutter.
-----------------------------------------------------------------------------------------------
ALERT SYSTEM
-----------------------------------------------------------------------------------------------
Alerts are optional and can be restricted to specific NY sessions.
Sessions (New York time):
- Session 1 (default: 09:30–16:00)
- Session 2 (optional)
- Session 3 (optional)
Alert types:
- HTF Bullish Block Formed
- Triggers when any enabled HTF forms a new bullish suspension block
- HTF Bearish Block Formed
- Triggers when any enabled HTF forms a new bearish suspension block
- Enter Bullish Block
- Triggers when price transitions from NOT inside any bullish HTF block to inside one
- Enter Bearish Block
- Triggers when price transitions from NOT inside any bearish HTF block to inside one
Messages:
- Fully customizable alert text inputs
- Script automatically appends ticker + current chart timeframe for context
-----------------------------------------------------------------------------------------------
BEST USE CASES
-----------------------------------------------------------------------------------------------
- Use HTF Suspension Blocks as “context zones” while executing on a lower timeframe
- Pair with ICT displacement, liquidity, PD arrays, and market structure for confluence
- Treat blocks as HTF inefficiency zones that can act as reaction points on retracements
- Use “enter block” alerts as a heads-up to shift into execution mode at HTF levels
-----------------------------------------------------------------------------------------------
DISCLAIMER
-----------------------------------------------------------------------------------------------
This indicator is provided for educational and analytical purposes only. It does not constitute financial advice. Trading involves risk, and past performance is not indicative of future results.
© TakingProphets
-----------------------------------------------------------------------------------------------
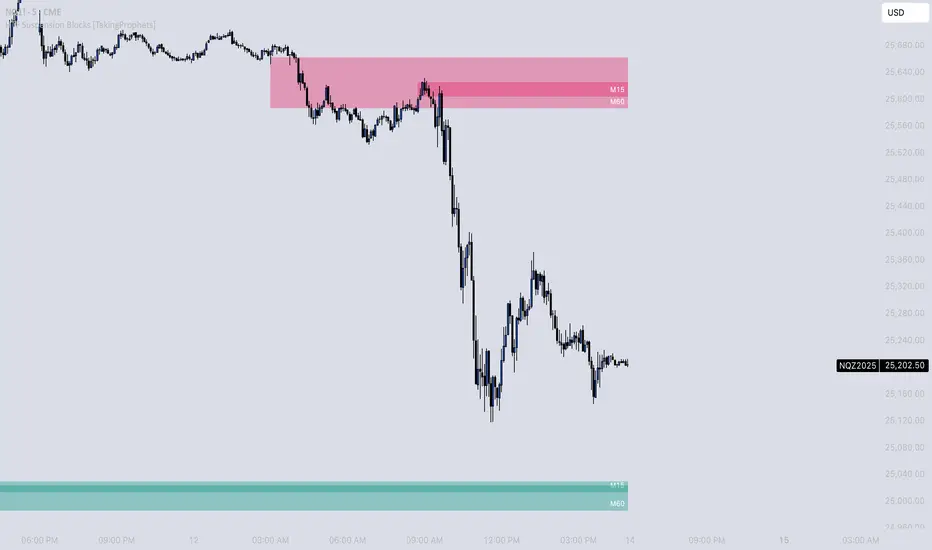
MWTI Introduction onChartMarket Wave TransIndex (MWTI)
Colors show when to attack and when to rest.
• Background = current market wave
• Masked zones = low momentum (rest)
• Upper dots = higher timeframe bias
No symbols, no predictions.
Just read the market state.
Works on any market, any timeframe.
Introduction (sample) is optimized for the 15m chart.
Try it on any market in 15m.
-------------------------------------------------------

Daily OpenThis is a protected/private script. To request access, please provide:
TradingView username (required)
Your main market(s) and timeframe(s)
Intended use (education / backtesting / live trading)
(Optional) Any proof of eligibility if applicable
Once your request is reviewed, access will be granted to the username provided.
Usage Terms:
No copying, modifying, distributing, publishing, or reselling of this script or its logic
Access is granted to approved accounts only
This script is a tool for analysis and not financial advice; you assume all trading risks
The author reserves the right to update the script or revoke access at any time
