SMT Fill by DukeSong
What is SMT fill?
Two correlated assets have common FVG on one candle, one asset touched the gap while the other did not. This is a strong sign of trend continuation.
What does this indicator do?
Display FVGs that has SMT fill of current asset (e.g. NQ) with respect to a correlated asset (e.g. ES).
How to use?
Add indicator, select the correlated asset, SIMPLE!
Candlestick analysis

SYXX - HTF Candle Overlay
This script, titled "HTF Candle Overlay by SYXX," is designed to visualize the full range and structure of a higher-timeframe (HTF) candle directly onto a lower-timeframe chart. It helps traders maintain context by showing where the current price action sits relative to a much larger candle's boundaries. Combined with LuxAlgo Volume Node Profile.
1. 🔍 Primary Feature: Higher Timeframe Candle Projection
Configurable Timeframe: The user sets the desired HTF using the Interval input, which defaults to 'D' (Daily). The indicator then tracks the High, Low, Open, and Close of that HTF bar.
Live and Historical Drawing: The script uses box.new to draw boxes representing the candle's full range (High to Low).
Historical Boxes (if changeHTF): When a new HTF candle closes, the completed box for the previous period is drawn.
Live Box (if barstate.islast): The indicator draws a live, dynamic box for the current, incomplete HTF candle, which expands with every new High or Low on the lower chart.
2. 🎨 Visualization & Customization
Color-Coded Bias: The boxes are colored based on the HTF candle's direction:
Bullish/Long (BgLong): Green color is used if the HTF candle closed higher than it opened (close > htfOpen).
Bearish/Short (BgShort): Red color is used if the HTF candle closed lower than it opened.
Box Styling: Users can customize the box's appearance, including border color and style, border thickness, and background opacity (BoxOpacity).
Midline: An optional MidLine is calculated as the average of the HTF High and Low, acting as a potential support/resistance reference point.
Range Display: The indicator can display the range of the box in pips (BoxRangePips) or the percentage of movement relative to the full range (BoxRangePercentage).
Time Labels: It plots time labels that show the start and end time of the completed HTF period (e.g., "07:00 - 11:00").
3. 🚨 Alert System (Placeholders)
The script includes placeholder inputs for standard trading alerts, though the internal logic for checking these conditions is currently commented out or set to false:
Alert: Break Above/Below Box: To signal a breakout of the HTF High or Low.
Alert: Price Re-Enters Box: To signal a pullback back into the range.

Smart Non-Overlapping S/R How to Interpret This Chart
The "Cluster" Effect: Look for areas where lines from different timeframes are close together (e.g., a Daily Support line is right next to a 4-Hour Support line). These "clusters" are very strong zones where price is highly likely to bounce.
Breakouts:
Bullish Breakout: If a candle closes above a Resistance line (e.g., "Daily Res"), that line often turns into new Support.
Bearish Breakout: If a candle closes below a Support line (e.g., "Daily Sup"), that line often turns into new Resistance.
Color Coding:
Orange (Daily): Major levels. Expect big reactions here.
Purple (4H): Medium trend levels. Good for swing trades.
Blue (1H): Minor levels. Good for day trading entries.

MG SUPORTE E RESISTENCIASupport and resistance tested on MNQ; you can choose between daily, weekly, or monthly

Clean Day End TradingThis script visualizes the complete Clean Box Breakout framework.
It automatically detects the intraday boundary window, builds a dynamic High/Low box, and locks levels at boundary close.
Features include:
• Dynamic boundary High/Low with optional historical day-1 & day-2 levels
• Automatic box visualization and real-time level updates
Ideal for traders who want clean, visual confirmation of the breakout model without running a strategy.

AI Kernel Regression StrategyHow to Use This Strategy
Paste the Code: Open the Pine Editor, paste the code, and click "Add to chart".
Look for Reversals:
BUY Signal: The price dipped below the green band (oversold) and snapped back up. The script identifies this as a high-probability bounce.
SELL Signal: The price spiked above the red band (overbought) and snapped back down.
Adjust the "Lookback Window":
In the settings (gear icon), if you change Lookback Window to a higher number (e.g., 15-20), the lines become smoother (better for trends).
If you lower it (e.g., 3-5), it becomes very reactive (better for scalping).
Important Note on "Repainting"
This script uses a technique called Regression. In live trading, it works perfectly (the signal appears when the candle closes). However, be aware that "AI" scripts like this are heavy on calculations. If you refresh your browser, the historical lines might shift slightly to fit the data better. Always wait for the candle to close before taking the trade to ensure the signal is locked in.

5分钟K线数5-min Bar Counter for Day Trading
5-min Bar Counter for Day Trading
5-min Bar Counter for Day Trading
5-min Bar Counter for Day Trading
Daily High-Low-Open + LabelsSimple PDH/PDL/DO indicator. It is in horizontal line form and it includes labels. So you don't have to place them daily yourself. Updates on its own every single day.

LTD Buy/Sell Stoch, MACD, RSI and ADX With Trend Filter V4.2This indicator is based upon Stoch, MACD and RSI overbought/oversold levels. In addition some 200 EMAs are added for trend confirmation. Some more features will be added on next version
Here are the following features it have
- Multiple EMAs filter added for trend based signals only
- Added Pullback Protection with volume
- Added Buy only or Sell only filters
- Added ATR Stop loss calculator
- Added Lot Calculator

Smoothed Heiken Ashi Candles9-SMA Trading Method (Buy and Sell Rules)
Sell Rules
A candle closes above.
Buy Rules
A candle closes below the 9-SMA.

OFM Key Levels (GC Asia)ETH Session Levels
Previous Day HLC
Current Week High & Low
Previous Week OHLC

FVG & IFVG MTF Detector [Alphaomega18]TITLE:
FVG & IFVG Multi-Timeframe Detector
SHORT DESCRIPTION:
Automatic Fair Value Gap (FVG) and Inverse Fair Value Gap (IFVG) detector with multi-timeframe analysis and automatic gap fill closure.
FULL DESCRIPTION:
📊 OVERVIEW
This indicator automatically detects Fair Value Gaps (FVG) and Inverse Fair Value Gaps (IFVG) on your current timeframe and up to 12 additional timeframes simultaneously. Perfect for confluence analysis and identifying institutional zones.
🎯 KEY FEATURES
✅ Multi-Timeframe Detection:
• 12 available timeframes: 1min, 2min, 5min, 10min, 15min, 30min, 1H, 2H, 4H, Daily, Weekly, Monthly
• Each timeframe with customizable color
• Timeframe labels positioned on the right of boxes
✅ Automatic Closure:
• FVGs automatically close when price fills the gap
• Option to disable for traditional fixed extension
• Smart midline management
✅ Complete Customization:
• Customizable colors for each timeframe
• Configurable label size, position, and style
• Gap size display options (separate for current TF and MTF)
• Transparent or colored labels for MTF
• Customizable borders and midlines
✅ Filters & Controls:
• Filter by minimum gap size
• Maximum boxes per timeframe
• Configurable box extension (5-100 bars)
• Border styles: Solid, Dashed, Dotted
✅ Integrated Dashboard:
• Active FVG/IFVG counter
• Statistics per timeframe
• Customizable position
📈 USAGE
1. **Timeframe Activation**:
- Go to Settings > Multi-Timeframe
- Check the timeframes you want to analyze
- Customize colors for each timeframe
2. **Display Configuration**:
- Settings > Display: control labels and their content
- "Transparent MTF Labels": displays only timeframe text without colored background
- "Show Gap Size": separate options for current TF and MTF
3. **Automatic Closure**:
- Settings > Filters > "Close FVG when Filled": enable to automatically close filled gaps
- Disable for traditional fixed extension
4. **Filtering**:
- "Min Gap Size": filter out insignificant small gaps
- "Max Boxes": control the number of FVGs displayed per timeframe
🔍 INTERPRETATION
• **Bullish FVG (🟢)**: Bullish gap - potential support zone
• **Bearish IFVG (🔴)**: Bearish gap - potential resistance zone
• **MTF Confluences**: Multiple FVGs from different timeframes at the same level = strong institutional zone
⚙️ TECHNICAL PARAMETERS
• Detection: low > high (bullish) | high < low (bearish)
• Max boxes per timeframe: 500
• Max lines: 500
• Automatic memory management (old FVG deletion)
🎨 ADVANCED CUSTOMIZATION
• Separate background and border colors
• 4 label sizes: Tiny, Small, Normal, Large
• 3 label positions for current TF: Left, Center, Right
• MTF labels always positioned right for clarity
• Optional midlines with customizable style and color
💡 USAGE TIPS
1. Start with 2-3 timeframes maximum to avoid visual overload
2. Use contrasting colors to easily differentiate timeframes
3. Daily/Weekly gaps are perfect for identifying major institutional zones
4. Combine with your price action strategy for precise entries
5. Automatic closure helps identify when a zone is invalidated
📊 IDEAL FOR
• ICT Traders (Inner Circle Trader)
• Scalping & Day Trading
• Swing Trading
• Institutional zone analysis
• Multi-timeframe confluence trading
🔔 ALERTS
Configurable alerts for:
• New Bullish FVG detected
• New Bearish IFVG detected
---
© 2024 Alphaomega18 - All rights reserved
License: Mozilla Public License 2.0

Breakaway Gaps## Breakaway Gaps — Multi-Method Gap & Imbalance Mapping Tool
**Overview**
Breakaway Gaps is a gap-mapping tool designed to highlight areas where price has displaced rapidly and left potential imbalance zones on the chart. It blends multiple detection techniques into one framework, allowing traders to monitor different styles of “breakaway” behavior without clutter or manual drawing.
---
### What the script provides
- **Gap & imbalance zone detection** — identifies areas where price has moved quickly and may have left inefficiencies behind.
- **Breakaway zones** — highlights areas created by strong directional movement or structural shifts in price.
- **Automatic zone management** — highlighted areas extend forward and are removed once price interacts with them, keeping the chart clean.
- **Adjustable behavior** — all major parameters can be tuned: sensitivity, lookback length, displacement thresholds, color themes, and the number of displayed zones.
---
### Why this tool is useful
- Captures different forms of breakaway conditions in a single indicator.
- Helps traders visualize zones that may act as future reaction points, liquidity magnets, or reference areas.
- Designed to keep the chart clean by automatically maintaining and updating all zones.
- Flexible enough to support both discretionary and systematic styles.
---
### What it does *not* do
- Does **not** generate trade signals, entries, exits, stop levels, or position direction.
- Does not predict outcomes or guarantee that any highlighted zone will be respected or filled.
- Should be used as a contextual tool alongside your own analysis and risk management.
---
### Suggested applications
- Identifying potential retracement targets after strong moves
- Marking areas where liquidity may rest or where price may rebalance
- Supporting market structure, breakout, or liquidity-based trading frameworks
- Higher-timeframe context zones combined with lower-timeframe execution
---
### Customization
The tool offers full user control over sensitivity, zoning behavior, highlight style, and display limits, so traders can adapt it to different markets and timeframes.
---
**Disclaimer**
This tool is for chart visualization only. It does not provide financial advice or guaranteed outcomes. Always use proper risk management and your own judgment when trading.

SIFVG [ULTRA+]Introduction
Sweep Inverse Fair Value Gap° is a fully customizable charting tool built to track inversion fair value gap logic that occur after displacement events—specifically when Fair Value Gaps (FVGs) are closed through, and effectively flipping their original state. The tool is inspired by Inner Circle Trader (ICT) concepts, offering a clean visual interface to support traders studying price behaviour after liquidity sweeps, FVG closures, and highlighting mechanical swings targets.
This indicator does not draw zones or suggest direction. It operates entirely on confirmed price events and produces logic-bound visuals designed for traders who already understand IFVG-based reasoning and seek visual consistency across sessions, Timeframe on any instrument.
Key Terms and Definitions
• Swing High / Swing Low: A swing high is a local price peak with lower highs on either side. A swing low is a local trough with higher lows on either side. These are used to detect where liquidity may rest and are required for confirming the initial raid condition in the IFVG model.
• Liquidity Raid: This occurs when price trades through a prior swing high or low, effectively “sweeping” a level where orders may be clustered around. The raid is a required precursor to inversion logic in this model. The tool will not evaluate a potential Fair Value Gap or Inversion Fair Value Gap unless a swing high or low has been taken first.
• Fair Value Gap (FVG): A Fair Value Gap is a price imbalance that occurs when a strong move leaves a gap between candles—specifically, when the high of one candle and the low of a later candle do not overlap. FVGs often emerge during displacement and are commonly studied as inefficiencies within a price leg.
• Inversion Fair Value Gap: An inversion happens when price fully closes through an existing Fair Value Gap that raided liquidity, suggesting the original imbalance rebalanced, and looks to reverse its original role. For example, when a bearish FVG is closed above after raiding a swing low, it may present a shift in orderflow (bullish inversion). The tool recognizes SIFVGs as “inverted” after a candle body candle closes through the gap post raid.
• Displacement: A strong directional price move, typically with momentum, that leaves a Fair Value Gap behind. Displacement is important in inversion logic, as it creates the context and confidence in comparing and contrasting FVGs and Inversions for obvious flips in market behaviour.
• SIFVG Line: Once inversion occurs, the indicator draws a single horizontal array on the candle's close. It marks the start of model activation. This is not a prediction level or a support/resistance area, as it merely serves as a reference for when model logic is sequentially active.
• Opposing Swing: The swing high or low opposite the one that was swept during the initial raid. This becomes the model’s first target for mechanical delivery and is automatically drawn once the IFVG line is plotted. When price reaches this swing, the model has reached its mechanical objective and could offer opportunities for further continuation to additional liquidity pools if orderflow continues to be present.
• Invalidation: The Sweep Inversion Fair Value Gap is considered invalid in one of two scenarios, which the user can toggle individually: a body print back above/below the inversion in bearish/bullish conditions, or trading above/below the most recent swing high/low after the liquidity raid. The SIFVG line will continue extending until the setup is invalidated by the chosen toggle, or when the Opposing Swing is reached.
• Consequent Encroachment (CE): The midpoint (50%) of the FVG or SIFVG. This line can be optionally displayed for users who use the midpoint of imbalances for reference of imbalance respect. It is not required by the model’s internal logic but may assist with discretionary interpretation.
• Description
At its core, SIFVG follows a structured three-step logic sequence: a FVG is created, liquidity is taken, and the Fair Value Gap (FVG) inside of the leg of the raid is closed through, signally a potential orderflow shift. Once inversion is confirmed, an SIFVG line is plotted at the close of the candle that caused the inversion, making it the structural anchor for the model.
The tool does not account for partial fills or candle wicks for FVGs or SIFVGs. Only full-body closures through a qualifying FVG are recognized. When this occurs, a bullish or bearish inversion is plotted and the model becomes active. From there, the opposing swing (the unswept high or low from the displacement leg) is automatically drawn as the target for the model.
Key Features
The Bias allows traders to define whether to track bullish inversions (closing above bearish FVGs), bearish inversions (closing below bullish FVGs), or neutral to see both. This allows isolated directional focus as well as the ability to display all models.
The Session Filter enables traders to define up to four specific Time blocks when the model is permitted to trigger. The Macros Only toggle filters setups further by limiting activation to the first and last 10 minutes of each hour, a filter inspired for intraday traders and scalpers.
How Traders Can Use the Indicator Effectively
SIFVG is not meant to identify trade signals, entries, or exits. It is best used as a visual tracker and confluence for structure-based delivery. The tool excels as a companion for:
Journaling and reviewing SIFVG-based setups across Timeframes and sessions
Studying structural completion or invalidation behaviour
Tracking delayed deliveries and retracement-based logic
Traders using the tool should be familiar with FVG formations, inversion criterias, and the importance of orderflow once an opposing swing is reached.
Usage Guidance
Add the SIFVG to a TradingView chart. This is a fractal script and can be applied across any Timeframe or asset pairing.
Use the SIFVG line to track inversion structure, monitor when inversions are created and negated, and reference the opposing swing to determine whether structural delivery has completed.
Use the SIFVG in combination with your own discretion and narrative to assess when the model has flipped, held, or broken.
Terms and Conditions
Our charting tools are products provided for informational and educational purposes only and do not constitute financial, investment, or trading advice. Our charting tools are not designed to predict market movements or provide specific recommendations. Users should be aware that past performance is not indicative of future results and should not be relied upon for making financial decisions. By using our charting tools, the purchaser agrees that the seller and the creator are not responsible for any decisions made based on the information provided by these charting tools. The purchaser assumes full responsibility and liability for any actions taken and the consequences thereof, including any loss of money or investments that may occur as a result of using these products. Hence, by purchasing these charting tools, the customer accepts and acknowledges that the seller and the creator are not liable nor responsible for any unwanted outcome that arises from the development, the sale, or the use of these products. Finally, the purchaser indemnifies the seller from any and all liability. If the purchaser was invited through the Friends and Family Program, they acknowledge that the provided discount code only applies to the first initial purchase of any Marcus product. The purchaser is therefore responsible for cancelling – or requesting to cancel – their subscription in the event that they do not wish to continue using the product at full retail price. If the purchaser no longer wishes to use the products, they must unsubscribe from the membership service, if applicable. We hold no reimbursement, refund, or chargeback policy. Once these Terms and Conditions are accepted by the Customer, before purchase, no reimbursements, refunds or chargebacks will be provided under any circumstances.
By continuing to use these charting tools, the user acknowledges and agrees to the Terms and Conditions outlined in this legal disclaimer.

Simple Moving Averages + LabelsSimple Moving Averages
With this indicator, you can add a personal and visual touch to your simple mobile averages, activating and customizing the way you view your SMAs with or without labels and prices.

Alt Trading: Mike's ORB Signal Pro
The Alt Trading: Mike's ORB Signal Pro indicator is a professional opening-range breakout system engineered for precision intraday trading on futures and CFD markets. It dynamically calculates the first 15-minute range (9:30–9:45 AM New York time) using 1-minute granularity, then monitors for clean breakout triggers when price closes decisively above or below these critical levels. The system allows only one long and one short setup per session, ensuring disciplined trade selection and eliminating overtrading. Once a valid breakout occurs, the indicator automatically generates visual risk/reward boxes that extend in real time, displaying entry, stop-loss, and take-profit zones with surgical clarity. Integrated money management logic calculates position size dynamically based on account balance, risk per trade, and stop distance, with support for both MNQ futures ($2/point) and CFD contracts with custom point values. The system caps position size to prevent over-leveraging and displays all critical metrics including raw and rounded contract size, risk percentage, and stop distance in a clean top-right table for instant decision-making. Trades automatically close when price hits the target, stop, or session end (4:00 PM by default), snapping all visual elements to the final bar for historical clarity. Optional session-level lines (CDH, CDL, PDH, PDL) provide additional context for confluence-based entries. With fully customizable styling for risk/reward zones, labels, ORB lines, and watermark branding, this indicator delivers a complete, exchange-grade framework for disciplined breakout trading with transparent risk modeling and real-time visual feedback.

YSR TRIDENT FX - Smoothed Heiken Ashi Candles – 🧿 What This Indicator Does
This indicator plots Smoothed Heiken Ashi Candles with a custom vertical offset, allowing traders to view both:
Regular price candles
Smoothed Heiken Ashi trend candles
side-by-side without overlapping.
Traditional Heiken Ashi candles can hide real price movement.
This version solves that by adding double smoothing + adjustable spacing, giving crystal-clear trend visualization while preserving real market structure.
🔥 Key Features
✅ 1. Dual EMA Smoothing
The script applies smoothing twice:
First smoothing: EMA applied on OHLC
Second smoothing: EMA applied on Heiken Ashi values
This creates ultra-clean trend candles with reduced noise.
✅ 2. Adjustable Vertical Distance (Offset)
Control how far Smoothed HA candles appear from regular candles.
Great for:
Scalpers
Price Action traders
No overlap → cleaner market structure.
✅ 3. Accurate Heiken Ashi Formula
Uses:
HA Close = Average of smoothed OHLC
HA Open = Previous HA Open + Previous HA Close / 2
HA High / Low = True trend-based levels
🌈 Color Coding
Green → Bullish Trend
Red → Bearish Trend
(The colors follow the smoothed structure, not raw candles.)
✔️ Best Used For
Trend following
Reversal filtering
Identifying clean directional bias
Removing noise from volatile markets
⭐ Recommended Settings
Length 1: 9
Length 2: 9
Vertical Distance: 0
These create a smooth but responsive Heiken Ashi display.

TCT OBIF Detector█ OVERVIEW
The OBIF (Order Block Imbalance Fill) indicator automatically detects and visualizes high-probability trading zones by combining two powerful Smart Money Concepts: Order Blocks and Fair Value Gaps (FVGs).
An OBIF occurs when an Order Block forms immediately before a Fair Value Gap, creating a zone of institutional interest that price often revisits before continuing its move.
█ CONCEPTS
Order Block (OB)
An Order Block is the last opposing candle before a strong directional move. It represents an area where institutional traders likely placed orders.
- Bullish OB: Last bearish candle before an up-move
- Bearish OB: Last bullish candle before a down-move
Fair Value Gap (FVG)
An FVG is a price imbalance created when a candle's body completely gaps past the previous candle's range, leaving an unfilled area.
- Bullish FVG: Gap up where candle .low > candle .high
- Bearish FVG: Gap down where candle .high < candle .low
OBIF Zone
When an Order Block directly precedes an FVG, it creates an OBIF - a confluence zone with higher probability of acting as support/resistance.
█ HOW TO USE
1. Identify the Trend
Use OBIFs in the direction of the higher timeframe trend for best results.
2. Wait for Price to Return
OBIFs act as magnets - price often returns to fill the imbalance and test the order block.
3. Look for Confirmation
When price enters an OBIF zone, look for:
- Rejection wicks
- Engulfing patterns
- Break of structure on lower timeframes
4. Mitigation
Once price fully trades through the OBIF (touches the opposite edge), the zone is considered mitigated and loses its significance.
█ FEATURES
- Automatic Detection — Identifies OBIFs in real-time as they form
- Visual Zones — Clean, non-intrusive boxes that don't obscure price action
- Mitigation Tracking — Zones automatically update when price mitigates them
- Multi-Timeframe Friendly — Works on any timeframe from 1m to Monthly
- Customizable — Adjust colors, opacity, and display preferences
█ SETTINGS
- Lookback Window — How many candles back to search for the Order Block (default: 3)
- Show Bullish/Bearish — Toggle visibility of each type
- Show Mitigated — Display zones that have been mitigated (shown in gray)
- Fill Opacity — Adjust zone transparency (higher = more see-through)
- Border Width — Thickness of zone borders
█ BEST PRACTICES
✓ Use on higher timeframes (1H+) for more reliable zones
✓ Combine with market structure analysis
✓ Look for OBIFs at key support/resistance levels
✓ Use lower timeframe confirmation for entries
✗ Don't trade every OBIF blindly
✗ Avoid OBIFs against the dominant trend
█ CREDITS
The Composite Trader (TCT) methodologies.

CharisGold FX Dashboard v2.8 (Signals + Alerts)this strategy is a trend line follower using EMA LOW (2 3 6 9) for scalping EMA LOW(25 34 89 110 355 and 480 )for trend direction

aPraJaiThis indicator Overlays Heikin Ashi Candles over the normal Candlestick pattern for you to be able to view both candle types simultaneously.

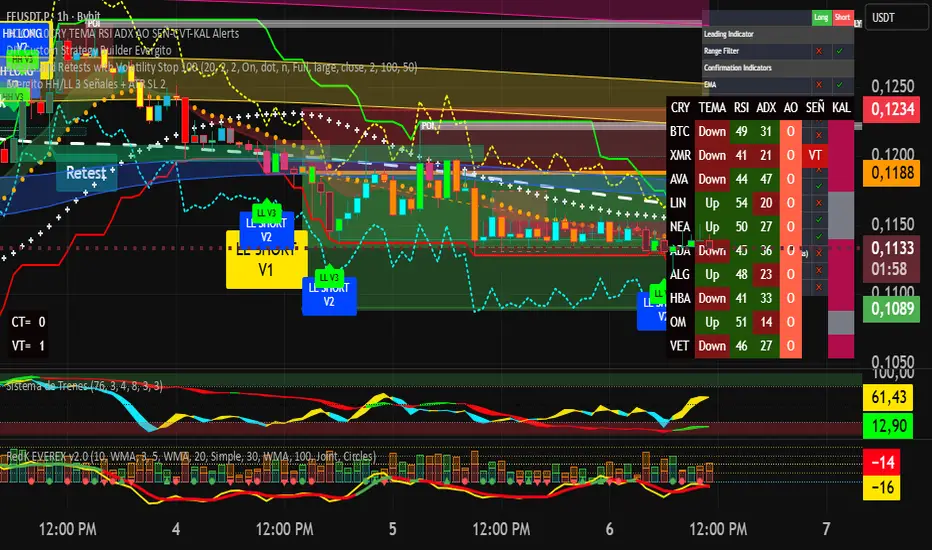
Evergito HH/LL 3 Señales + ATR SL 2How to trade with the Evergito HH/LL 3 Signals + ATR SL indicator? Brief and direct explanation: General system logic: The indicator looks for actual breakouts of the high/low of the last 20 bars (HH/LL) and combines them with the position relative to the 200 SMA to filter the underlying trend. You have 3 types of signals that you can activate/deactivate separately: Signal
When it appears
What it means in practice
Entry type
V1
HH breakout + the close crosses above the 200 SMA (or the opposite in a short position)
Very safe entry confirmed. The price has just validated the long/flat trend → safer and with a better ratio
The most reliable (the original)
V2
HH breakout but the price was already above the 200 SMA (or already below in a short position)
Entry in an already established trend. Fewer “surprises”, more continuity
Ideal for strong trends
V3
Only the breakout of the HH or LL, without looking at the 200 SMA
Aggressive entry/scalping on explosive breakouts. More signals, more noise.
For times of high volatility.
How to enter the market (simple rule): Wait for any of the 3 labels (V1, V2, or V3) to appear, depending on which ones you have activated.
Enter at the close of that candle (or at the open of the next one if you are conservative).
Automatic Stop Loss → the blue (long) or yellow (short) line that represents the ATR x2.
Take Profit → you decide, but the indicator already gives you the visual reference for the risk (ATR x2), so 1:2 or 1:3 is usually very convenient.
Practical example: You see a large green label “HH LONG V1” → you go long at the close of that candle. Stop right at the blue line (ATR x2 below the price).
Typical target: 2x or 3x the risk (very common to reach it in a trend).
Recommended use: Most traders leave only V1 activated → fewer signals but very high quality.
Those who trade intraday or crypto usually combine V1 + V2.
V3 only for news events or very volatile openings.
In summary:
Label = immediate entry
Blue/yellow line = automatic stop
And enjoy the move.
Evergito HH/LL 3 Señales + ATR SLHow to trade with the Evergito HH/LL 3 Signals + ATR SL indicator? Brief and direct explanation: General system logic: The indicator looks for actual breakouts of the high/low of the last 20 bars (HH/LL) and combines them with the position relative to the 200 SMA to filter the underlying trend. You have 3 types of signals that you can activate/deactivate separately: Signal
When it appears
What it means in practice
Entry type
V1
HH breakout + the close crosses above the 200 SMA (or the opposite in a short position)
Very safe entry confirmed. The price has just validated the long/flat trend → safer and with a better ratio
The most reliable (the original)
V2
HH breakout but the price was already above the 200 SMA (or already below in a short position)
Entry in an already established trend. Fewer “surprises”, more continuity
Ideal for strong trends
V3
Only the breakout of the HH or LL, without looking at the 200 SMA
Aggressive entry/scalping on explosive breakouts. More signals, more noise.
For times of high volatility.
How to enter the market (simple rule): Wait for any of the 3 labels (V1, V2, or V3) to appear, depending on which ones you have activated.
Enter at the close of that candle (or at the open of the next one if you are conservative).
Automatic Stop Loss → the blue (long) or yellow (short) line that represents the ATR x2.
Take Profit → you decide, but the indicator already gives you the visual reference for the risk (ATR x2), so 1:2 or 1:3 is usually very convenient.
Practical example: You see a large green label “HH LONG V1” → you go long at the close of that candle. Stop right at the blue line (ATR x2 below the price).
Typical target: 2x or 3x the risk (very common to reach it in a trend).
Recommended use: Most traders leave only V1 activated → fewer signals but very high quality.
Those who trade intraday or crypto usually combine V1 + V2.
V3 only for news events or very volatile openings.
In summary:
Label = immediate entry
Blue/yellow line = automatic stop
And enjoy the move.

Forex Knack — Premium Smart Money Indicator📈 Forex Knack — Premium Smart Money Indicator
Developed by Vineesh Rohini
Forex Knack is an invite-only, institutional-grade Smart Money Concepts toolkit built for traders who want clarity, precision and high-quality confluence — without leaking the internal logic.
This indicator combines market structure mapping, dynamic trend shifts, valuation zones and multi-layer confirmation into a clean, professional interface suitable for Forex, XAUUSD (Gold), Crypto and major Indices.
★ Core Benefits
- ✅ Cleaner Market Structure: Live BOS / CHoCH mapping for internal + swing structure.
- ✅ Directional Clarity: Proprietary “Shift” model to identify buy/sell phases.
- ✅ Confluence Signals: Combo confirmations when structure + momentum align.
- ✅ Premium / Discount Zones: Automatic institutional zones for better entries.
- ✅ Order Block Visuals: Internal & swing order block identification.
- ✅ Fair Value Gaps (optional): Imbalance highlighting for tactical entries.
- ✅ Momentum Confirmation: Oscillator-based trend confirmation.
- ✅ Strong / Weak Highs & Lows: Quick strength/weakness view for swing decisions.
🚫 What’s NOT included
- No full strategy code or secret formulas are revealed.
- Not a turnkey “auto-trade” bot — it is a professional decision-support tool.
🔒 Invite-only Access
This script is invite-only: the source code is fully protected and hidden.
You may apply for access; approved users can add the indicator to their charts but **will never** see the source code.
📬 How to request access
1. Follow the author profile on TradingView.
2. Send a message with your TradingView username and the note:
“Requesting access to Forex Knack indicator.”
(Access is granted manually after verification.)
⚠ Disclaimer
For educational purposes only. Not financial advice. Use with proper risk management.
© Vineesh Rohini — Forex Knack
