VOLUME with DOUBLE MAA volume chart with dual moving averages. If you're looking for a volume chart with dual moving averages, this script is for you. By averaging the volume over two periods, you can discover more subtle relationships between price and volume.
Candlestick analysis

Scout Regiment - Signal📊 中文版
指标简介
Buy/Sell Signal 多维度交易信号指标
这是一个结合了EMA趋势过滤、CCI动量指标和RSI背景环境的多维度交易信号系统。通过三重过滤机制,帮助交易者在合适的市场环境中捕捉高质量的买卖信号。
核心特点
✅ 趋势过滤:使用233周期EMA确保顺势交易
✅ 动量确认:CCI(33)穿越信号作为入场触发
✅ 背景过滤:RSI(13)环境判断,避免同一背景重复信号
✅ 智能去重:每个RSI背景周期内只标记首次信号
✅ 清晰标识:三角形标记配合颜色区分买卖方向
使用说明
信号逻辑:
做多信号 (Buy):
收盘价 > EMA233(确认上升趋势)
CCI33向上穿越20(动量转强)
情况1:在RSI红色背景中首次出现
情况2:在RSI绿色背景中出现
做空信号 (Sell):
收盘价 < EMA233(确认下降趋势)
CCI33向下穿越80(动量转弱)
情况1:在RSI绿色背景中首次出现
情况2:在RSI红色背景中出现
参数设置
EMA过滤长度:默认233,用于判断主趋势方向
CCI长度:默认33,控制动量指标灵敏度
RSI长度:默认13,用于背景环境判断
重要提示
⚠️ 信号出现后不要立即下单!请务必检查:
CCI中期是否出现"浪子回头"形态
OBV成交量状态是否配合
RSI是否成功穿越50中线
结合其他技术分析工具综合判断
💡 建议配合使用:
支撑阻力位分析
成交量指标(如OBV)
更大周期的趋势确认
📈 English Version
Indicator Overview
Buy/Sell Signal - Multi-Dimensional Trading Signal System
This is a comprehensive trading signal system that combines EMA trend filtering, CCI momentum indicator, and RSI background environment. Through a triple-layer filtering mechanism, it helps traders capture high-quality buy and sell signals in appropriate market conditions.
Key Features
✅ Trend Filter: 233-period EMA ensures trend-following trades
✅ Momentum Confirmation: CCI(33) crossover signals as entry triggers
✅ Background Filter: RSI(13) environment detection to avoid duplicate signals
✅ Smart Deduplication: Only first signal per RSI background cycle
✅ Clear Visualization: Triangle markers with color-coded direction
How to Use
Signal Logic:
Buy Signal:
Close > EMA233 (confirms uptrend)
CCI33 crosses above 20 (momentum strengthens)
Case 1: First occurrence in RSI red background
Case 2: Occurs in RSI green background
Sell Signal:
Close < EMA233 (confirms downtrend)
CCI33 crosses below 80 (momentum weakens)
Case 1: First occurrence in RSI green background
Case 2: Occurs in RSI red background
Parameter Settings
EMA Filter Length: Default 233, for main trend direction
CCI Length: Default 33, controls momentum sensitivity
RSI Length: Default 13, for background environment detection
Important Notes
⚠️ DO NOT enter trades immediately after signal appears! Always check:
Whether CCI shows a "reversal" pattern in medium-term
OBV volume status confirmation
Whether RSI successfully crosses the 50 midline
Combine with other technical analysis tools
💡 Recommended to Use With:
Support/Resistance analysis
Volume indicators (such as OBV)
Higher timeframe trend confirmation
Risk Disclaimer
This indicator is for reference only and does not constitute investment advice. Trading involves risk. Please conduct thorough analysis and use proper risk management before making any trading decisions.
适合交易者类型 / Suitable For:
波段交易者 / Swing Traders
日内交易者 / Day Traders
趋势跟踪者 / Trend Followers
适用市场 / Applicable Markets:
股票 / Stocks
外汇 / Forex
加密货币 / Crypto
期货 / Futures

ORB + FVG A+ PRO (All-in-One) [QQQ]Configurable ORB + FVG + filters (VIX, ORB range, relative volume) + A+ PRO (retest at the FVG edge + rejection) + anti-fakeout + orange reminder “CONFIRM POC/HVN (Volume Profile)” right when the A+ signal appears

SnR Key Level Detector by RWBTradeLabSnR Key Level Detector by RWBTradeLab
A clean, non-repainting key level detector built for price action traders who want clear, fixed Support/Resistance reference levels with breakout upgrades and alerts.
What this indicator does
This script automatically detects and draws 6 types of SnR key levels using CLOSED candles only (no running-candle logic):
1. Base Key Levels (from 2-candle sequences)
* A Level: Green → Red (Level = 1st Green candle Close)
* V Level: Red → Green (Level = 1st Red candle Close)
* Bullish Gap Level: Green → Green (Level = 1st Green candle Close)
* Bearish Gap Level: Red → Red (Level = 1st Red candle Close)
2. Breakout Upgrade Levels
* RBS (Resistance → Support): When a Green candle CLOSE breaks above an A Level or Bearish Gap Level
* SBR (Support → Resistance): When a Red candle CLOSE breaks below a V Level or Bullish Gap Level
Visuals on chart
* Each detected level is drawn as a horizontal Ray extended to the right.
* Optional text labels are placed above/below the level based on the level type.
* Adjustable “Label Offset (ticks)” to keep labels cleaner on the chart.
Alerts (bar-close only)
Built-in alerts trigger only when a candle is CONFIRMED:
* A Level
* V Level
* Bullish Gap
* Bearish Gap
* SBR
* RBS
Each alert includes price and time in the message.
Key settings
* Candle Length (closed candles): Scans last N closed candles (running candle excluded).
* On/Off toggles: Enable/disable each level type and text labels individually.
* Label Offset (ticks): Controls the label distance from the level line.
Non-repainting confirmation
All levels and alerts are calculated on confirmed bars only.
No repainting, no running-bar signals.
Best use
Works on any market and timeframe. For higher reliability, combine with:
* Higher timeframe structure
* Supply & Demand zones
* Trend context and liquidity sweeps
Disclaimer:
This indicator is a level-detection tool, not financial advice. Trading involves risk; always use proper risk management and confirm levels with your own analysis.
Creator: RWBTradeLab
If you find this useful, please leave a like ⭐ and share your feedback.

Reaction CandlesThis is a very simple but effective indicator, turn it on and see for yourself.
Can be used on any timeframe, but tested on the 5 and 30 mins.
Developed for use on Gold and Indexes, but works well on any stock. Easy to visually back test.

True vs False Breakout (Vol + Body Shape) **Indicator Description: True vs. False Breakout Detector**
This indicator helps identify the quality of a breakout by analyzing price action and volume.
**★ Green Arrow: "True Breakout (Strong Candle)"**
This represents a high-confidence breakout signal.
* **Criteria:** Price Breakout + Volume Surge + Strong Candle Close (minimal to no upper wick).
* **Significance:** Indicates strong bullish momentum.
**● Grey Dot: "Weak Breakout"**
Appears when price breaks resistance but shows signs of weakness.
* **Criteria:** Breakout with low volume OR a long upper wick (rejection).
* **Meaning:** "Price made a new high, but the move is untrustworthy."
* **Action:** Do not chase the long position. Be cautious and look for potential reversals.
**▼ Red Label: "False Breakout (Reversal)"**
* **Signal:** Appears when a Weak Breakout (Grey Dot) is followed by bearish price action.
* **Action:** This indicates a confirmed False Breakout and presents a prime shorting opportunity.
-------------------------------------------------------------------------------------------
★指标描述:真假突破辨别。
★绿色箭头 "真突破 (强K线)":
这是你要的完美信号。
它意味着:价格破位 + 成交量放大 + K线收盘坚决(几乎没有上影线)。
对应刚才的行情: 刚才那根1H大阳线应该会触发这个信号。
灰色圆点 "弱势突破" (新增):
如果价格突破了阻力,但是没量,或者留了长上影线(像你之前描述的那几根15分钟线),指标会标记灰色圆点。
含义: “虽然价格破了新高,但我不信任它”。这时候千万不要追多,反而要准备做空。
红色标签 "假突破 (反转)":
当灰色圆点(弱势突破)出现后,紧接着出现红色标签,就是绝佳的做空点。


CVD Candle Divergence IndicatorThis indicator identifies potential reversal points by comparing the direction of price candles with the direction of cumulative volume delta (CVD) candles, while applying additional filters based on RSI behavior, volume strength, and candlestick wick structure.
It aims to highlight situations where price movement and volume delta disagree, which can signal fading momentum or absorption.
Core Concept
The script combines several independent conditions that must occur simultaneously before a signal is displayed on the chart. A signal appears only when all filters agree, reducing the number of low-quality or noise-based setups.
1. CVD Candle Direction
The indicator uses TradingView’s built-in function for volume delta candles. These candles summarize buying and selling aggression derived from lower-timeframe volume.
A CVD green candle indicates more buyer-initiated volume.
A CVD red candle indicates more seller-initiated volume.
The script looks for instances where price and CVD candles disagree:
Bullish signal: price candle is green while CVD candle is red
Bearish signal: price candle is red while CVD candle is green
This creates a form of divergence using volume delta instead of price highs and lows.
2. RSI Context Filter
Momentum is evaluated through RSI. Instead of relying only on standard overbought/oversold levels, the script also includes a recency filter based on the RSI midline (50 level).
RSI Threshold
Users can specify the RSI value required for bullish and bearish conditions.
Recency Filter
The indicator only allows signals if RSI has crossed the 50 level within a user-defined number of bars. This prevents signals during extended one-directional trends where divergence is less meaningful.
3. Volume Strength Filter
Signals are filtered through a volume-based requirement:
Current volume must exceed a moving average of volume multiplied by a user-defined factor.
This ensures that signals appear only during periods with sufficient participation and reduces noise during low-volume consolidation.
4. Wick-to-Body Ratio Filter
To incorporate price-action characteristics, the script evaluates the wick structure of each candle:
Bullish signals require a sufficiently large lower wick relative to the total candle range.
Bearish signals require a sufficiently large upper wick relative to the total candle range.
The wick percentage is fully configurable.
This adds a rejection or absorption component to the logic and prevents signals on weak or indecisive candles.
Signal Conditions
A bullish signal appears when all of the following are true:
Price candle is green
RSI is below the bullish threshold
CVD candle is red
Volume is above its threshold (if enabled)
RSI has interacted with the 50 level recently
Lower wick meets the wick-percentage requirement
A bearish signal requires the opposite conditions:
Price candle is red
RSI is above the bearish threshold
CVD candle is green
Volume is above its threshold (if enabled)
RSI recently interacted with the 50 level
Upper wick meets the wick-percentage requirement
Signals appear as arrows directly on the chart.
Use Cases
This indicator is intended for traders who work with:
Momentum shifts
Volume delta analysis
Candle structure-based confirmation
Reversal or exhaustion setups
Divergence concepts beyond price highs/lows
It does not predict market direction. Instead, it highlights areas where multiple conditions suggest a potential imbalance between price movement and volume delta.
I would strongly suggest to use this indicator only on timeframes 2-15m.
Here are a few examples:


GYD-VOLinesCalculate support and resistance lines through the volume of large-level cycles, so that when subsequent candlesticks reach these lines, they can serve as a reference for trading decisions! The larger the cycle, the better the support and resistance effect!
通过大级别周期的成交量计算出支撑阻力线,以便后续K线表达到这里的时候,为交易决策做参考!越大周期的线,撑压效果越好!

Horizontal LineA horizontal line divided based on grid distance, suitable for traders who use Open Interest (OI) for market analysis. This grid system helps users clearly identify key price levels, such as areas where significant contract accumulation occurs, potential reversal zones, or regions where heavy buying and selling activity is expected.

RRE ZonesLine Creation: Each FVG box now has a corresponding dashed line drawn through its center:
Uses a dashed style for clear visibility
Matches the FVG color (with 30% transparency)
Extends to the right like the box
Width of 1 pixel
Synchronized Cleanup: When FVG boxes are removed (either by reaching max count or being filled by price), their corresponding center lines are also deleted automatically.
The center lines help you:
Quickly identify the 50% level of each FVG
Use it as a potential target or entry level
Better visualize the gap's midpoint for trading decisions

3LL+Baby & 3HH+Baby Pattern3LL+Baby & 3HH+Baby Pattern Indicator
Overview
This indicator identifies powerful reversal patterns based on momentum exhaustion and inside bar formations. It detects two specific candlestick patterns that signal potential trend reversals: the bullish 3LL+Baby and the bearish 3HH+Baby.
Pattern Descriptions
📈 3LL+Baby Pattern (Bullish Reversal)
Conditions:
Three consecutive candles form lower lows (each low is lower than the previous)
The fourth candle is bullish/green (closes higher than it opens)
The fourth candle is completely contained within the third candle's range (both high and low)
Interpretation: After a downward momentum with three lower lows, a bullish inside bar (baby candle) suggests sellers are exhausted and buyers may be taking control. This pattern often precedes upward reversals.
📉 3HH+Baby Pattern (Bearish Reversal)
Conditions:
Three consecutive candles form higher highs (each high is higher than the previous)
The fourth candle is bearish/red (closes lower than it opens)
The fourth candle is completely contained within the third candle's range (both high and low)
Interpretation: After upward momentum with three higher highs, a bearish inside bar indicates buyers are losing strength and sellers may be gaining control. This pattern often signals potential downward reversals.
Features
Visual Signals
Green Triangle (↑): Appears below bars when 3LL+Baby pattern is detected
Red Triangle (↓): Appears above bars when 3HH+Baby pattern is detected
Labels: Clear text labels identifying each pattern type
Background Highlighting: Subtle background colors (green for bullish, red for bearish)
Customization Options
Toggle labels on/off
Toggle arrow signals on/off
Enable/disable bullish patterns independently
Enable/disable bearish patterns independently
How to Use
Add to Chart: Apply the indicator to any timeframe and instrument
Configure Settings: Adjust visibility options based on your preference
Set Alerts: Create alerts for immediate pattern notifications
Trading Strategy:
3LL+Baby : Consider long positions or closing shorts
3HH+Baby: Consider short positions or closing longs
Always confirm with additional analysis and risk management
Best Practices
Use in conjunction with support/resistance levels
Combine with volume analysis for confirmation
Works on all timeframes (higher timeframes generally more reliable)
Apply proper risk management and stop-loss orders
Consider the broader market context and trend

BALANCED Strategy: Intraday Pro + Smart DashboardWelcome to the BALANCED Strategy: Intraday Pro.
This all-in-one indicator is designed for Intraday traders looking to capture trend movements while effectively filtering out sideways market noise. It combines the power of Supertrend for direction, EMA 100 for the baseline trend, and rigorous validation via RSI and ADX.
The script also integrates a complete Risk Management system with targets based on the Golden Ratio (Fibonacci) and a real-time Dashboard.
⏳ Recommended Timeframes
This algorithm is optimized for Intraday volatility:
M5 (5 Minutes) ⭐️: Ideal for quick Scalping. The ADX filter is crucial here to avoid false signals.
M15 (15 Minutes) 🏆: The "Sweet Spot." It offers the best balance between signal frequency and trend reliability.
M30 / H1: For a "Swing Intraday" approach—calmer, fewer signals, but higher precision.
Not recommended for M1 (1 Minute) with default settings (too much noise).
🚀 How It Works
The algorithm follows a strict 3-step logic to generate high-quality signals:
1. Trend Identification (The Engine)
Supertrend: Determines the immediate direction.
EMA 100: Acts as a background trend filter. We only buy above and sell below the EMA.
2. Noise Filtering (Safety)
ADX (Average Directional Index): The signal is only validated if there is sufficient volatility (Configurable threshold, default 12) to avoid "chop markets" (flat markets).
RSI (Relative Strength Index): Strict momentum filter. Buy only if RSI > 50, Sell if RSI < 50.
3. Entry Confirmation (The Trigger)
The script doesn't just rely on a crossover. It waits for "Price Action" confirmation: the candle must close higher than the previous one (for Long) or lower (for Short) to validate the entry.
🛡️ Risk Management (Money Management)
This is the core strength of this tool. Upon signal validation, the script automatically calculates and plots:
Stop Loss (SL): Based on volatility (ATR). It places the stop at the recent Low/High with a safety padding.
Take Profit (TP): Two modes available:
Fibonacci Mode (Default): Targets the 1.618 extension (Golden Ratio) of the risk taken.
Fixed Ratio Mode: Targets a manual Risk/Reward ratio (e.g., 2.0).
📊 The Dashboard
Located at the bottom right, the smart dashboard provides vital info at a glance:
Signal Time: To check if the alert is fresh.
Type (LONG/SHORT): Color-coded (Green/Pink).
Tech Data: RSI and ADX values at the moment of the signal.
Exact Prices: Entry Level, Target (TP), and Stop Loss (SL).
⚙️ Configurable Settings
Sensitivity: Adjust the Supertrend factor (Default 2.0).
Filters: Toggle the RSI filter ON/OFF or adjust the ADX threshold.
Execution: Choose between Fibonacci Target (1.618) or a Manual Ratio.
⚠️ Disclaimer: This tool is a technical decision aid and does not constitute financial investment advice. Always use prudent risk management and backtest the indicator on your preferred assets before live use.

EMA/Volume/Institutional Candle (Deep)This indicator is designed for short-term swing trading and intraday trend identification using a combination of EMA structure, momentum shifts, volume confirmation, and institutional footprint analysis.
🔹 Key Features
1. EMA Trend Framework (9, 20, 50, 200)
✔ EMA 9 & EMA 20: Ultra-short-term momentum; ideal for fast trend shifts.
✔ EMA 50: Medium-term trend guide; helps identify pullbacks vs. reversals.
✔ EMA 200: Long-term trend bias and major dynamic support/resistance.
2. EMA 9/20 Crossover Signal
✔ Bullish Crossover → EMA 9 crossing above EMA 20 indicates momentum expansion and early trend reversal.
✔ Bearish Crossover → EMA 9 crossing below EMA 20 shows momentum weakening and possible short-side opportunity.
3. High-Volume Zone Detection
✔ Highlights candles with volume spikes above average, signaling institutional interest.
✔ Useful for identifying breakout validity, liquidity grabs, or trap candles.
4. Institutional Candles (Smart Money Footprint)
✔ Automatically marks institutional order blocks, imbalance zones, or large displacement candles.
✔ Helps traders identify where smart money entered the market and potential mitigation zones.
🎯 How This Indicator Helps You Trade
✔ Quickly spot trend direction with multi-EMA alignment
✔ Identify high-probability entries with EMA 9/20 crossover + volume confirmation
✔ Find institutional zones for sniper-style entries
✔ Filter fake breakouts using volume spikes
✔ Perfect for stocks, indices, crypto, and forex

Golden hour 1130 1230 Session LinesGolden Hour 11:30–12:30 Session Lines
Overview :
Calculate the session high and low between 11:30 AM and 12:30 PM and mark the lines.
Trading Rule
Once the price breaks either side (high or low), it will continue to move further in that direction.
Session Time : 11:30 AM – 12:30 PM
Key Levels : Session High & Session Low
Strategy : Breakout continuation in the direction of the break

Long an Short Liq filter rev 3.0 /nnaCan help you to see horizontal Liquidation maps on cryptocurrency market. Script created to help you with EP. Calibration parameters for different coins could be different. Write me in Dm. i can help you with that

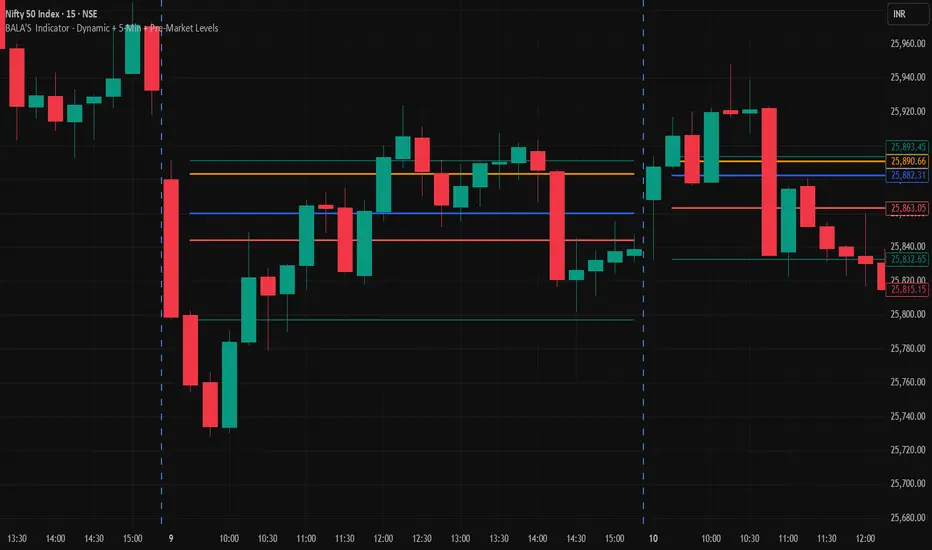
BALA'S Indicator - Dynamic + 5-Min + Pre-Market LevelsINTRADAY Strategy on Nifty with 15min Candle Setup.
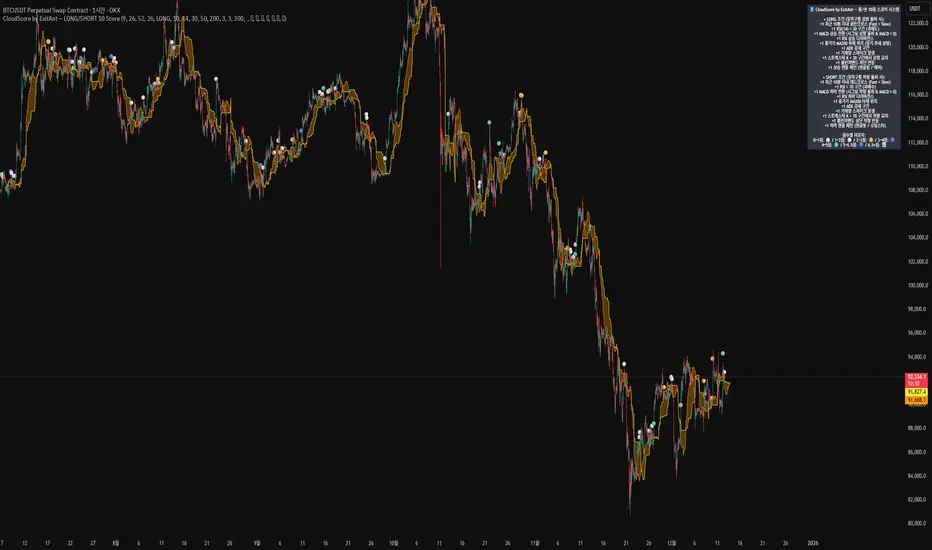
CloudScore by ExitAnt [Upgrade]📘 CloudScore PRO by ExitAnt (v13)
CloudScore PRO는 일목균형표(REAL Ichimoku Cloud)의 ‘진짜 상방 돌파’만을 감지하고,
여기에 총 10가지 추세·모멘텀·패턴·거래량 요소를 점수화하여 (0~9점)
현재 추세 전환의 강도를 직관적으로 알려주는 고급 추세 분석 지표입니다.
일목 구름은 본래 강력한 추세 전환 신호를 제공하지만
“위→안→위” 또는 “부분 돌파” 같은 왜곡 신호가 매우 많습니다.
v13은 이를 완전히 제거하고,
오직 아래→안→위 또는 아래→위(직통) 형태의 ‘진짜 돌파’에서만 점수를 계산합니다.
🎯 지표 목적
* 진짜 일목구름 돌파만 필터링하여 신뢰도 상승
* 10개 기술 요소의 점수화(0~9점)로 한눈에 추세 강도 판단
* 거짓 진입 신호(위→안→위) 완전 제거
* 점수 0일 때도 ‘🔴’로 명확하게 무효 신호 표시
* 초보자부터 숙련자까지 모두 활용 가능한 추세 진입 필터링 지표
🧠 점수 계산 방식 (가중치 기반)
구름 돌파가 유효하게 발생하면,
아래 10가지 조건을 체크하여 각 항목별 가중치 점수가 합산됩니다.
▶ 기존 +1 점 항목 (5개)
1. 골든 크로스 발생
Fast MA가 Slow MA를 최근 N봉 내 상향 돌파
2. RSI 과매도 구간
RSI < 설정값 → 반등 가능성 증가
3. MACD 강세 전환
MACD < 0 & 시그널 상향 돌파
4. RSI 상승 다이버전스
가격 하락, RSI 상승 → 바닥 가능성
5. 종가 > MA200
장기 추세와 일치하는 경우만 점수 강화
▶ 신규 +1 점 항목 (추가 5개)
6. ADX > 20 (추세 강도)
추세가 실제로 형성되고 있을 때
7. 거래량 스파이크 발생
거래량이 평균 대비 일정 배수 이상 증가 → 큰 매수 유입
8. Stochastic Oversold Cross
%K < 30에서 골든크로스 → 저점 반등 신호
9. Bollinger Band Rebound
이전 봉이 하단 밴드를 이탈하고, 현재 봉이 중심선을 회복한 경우
10. 강세 캔들 패턴 (Bullish Engulfing / Hammer 등)
강한 반전 패턴 발생 시
> 점수는 단순 +1 합산이 아니라
> 각 요소의 중요도에 따른 가중치 합산 방식으로 계산됩니다.
📊 점수별 이모지 (8단계)
| 점수 구간 | 이모지 | 의미 |
| -------- | ------ | -------------- |
| ≤ 0 | 🔴 | 무효 신호 |
| 0 ~ 1 | ⚪ | 매우 약함 |
| 1 ~ 2 | 🟡 | 약함 |
| 2 ~ 3 | 🟢 | 관찰 필요 |
| 3 ~ 4 | 🔵 | 양호 |
| 4 ~ 5 | 📈 | 추세 형성 |
| 5 ~ 6.5 | 🚀 | 매우 강함 |
| **6.5+** | **👑** | **최상급 고신뢰 구간** |
> 👑 이모지는 6.5점 초과에서만 표시되며,
> 여러 핵심 조건이 동시에 충족된 극소수 구간에서만 나타납니다.
🖥 차트 표시 요소
* REAL Ichimoku Cloud(미래 이동 없는 실제 구름)을 기반으로 계산
* TRUE breakout(아래 → 위 돌파) 시 캔들 위에 점수 이모지 표시
* 최근 N개의 캔들만 표시 가능
* 우측 상단에 현재 점수 요소 설명 패널 표시
* 점수 0점일 때도 🔴 표시하여 신호의 부재를 명확히 표현
* 위→안→위처럼 잘못된 돌파는 완전히 제외됨
🔧 사용자 설정
* Tenkan / Kijun / SenkouB 기간 설정
* 점수 요소 개별 활성화/비활성화
* 이모지 커스터마이즈
* 최근 몇 개의 캔들까지 표시할지 설정
* MA, RSI, MACD, ADX, Bollinger 등 점수 요소 사용자 정의 가능
⚠️ 유의사항
이 지표는 일목구름 돌파 기반의 확률적 보조 도구이며,
단독으로 매수·매도 결정을 내리는 용도로 사용해서는 안 됩니다.
* 시장 변동성
* 시간 프레임
* 거래량 환경
에 따라 신호 강도는 달라질 수 있습니다.
실제 매매 적용 전 반드시 백테스트 및 시뮬레이션을 권장합니다.
오케이. 그럼 **지금 네 코드(v13, 가중치 + 8단계 이모지 기준)** 와
**완전히 1:1로 맞는 영어 설명 최종본**을 줄게.
(퍼블릭 배포용으로 그대로 써도 되는 수준)
# 📘 **CloudScore PRO by ExitAnt (v13)**
CloudScore PRO is an advanced **Ichimoku-based trend scoring indicator**
that detects only **true, valid Ichimoku Cloud breakouts** and evaluates the
strength of the trend using a **weighted score system built from 10 technical components**.
Unlike standard Ichimoku signals — which often generate distorted breakouts such as
**“above → inside → above”** —
CloudScore PRO v13 **filters these out completely** and only accepts the following structures as valid breakouts:
* **below → inside → above**
* **below → above (direct breakout)**
This ensures that scoring is applied **only when a genuine trend transition occurs**.
## 🎯 Purpose of the Indicator
* Filter out false Ichimoku Cloud breakouts
* Evaluate trend strength using **10 weighted confirmation signals**
* Visualize trend quality instantly using **8-stage emoji scoring**
* Clearly mark invalid signals (score ≤ 0)
* Serve as a robust **entry filter** for both beginners and advanced traders
## 🧠 Scoring Logic (Weighted System)
When a valid cloud breakout occurs, CloudScore PRO evaluates the following
10 components and **adds weighted scores based on their importance**.
### ▶ Core Trend & Momentum Components (5)
1. **Golden Cross**
* Fast MA crosses above Slow MA within the defined lookback period
2. **RSI Oversold Condition**
* RSI below threshold, indicating potential reversal
3. **MACD Bullish Shift**
* MACD below zero with bullish signal-line crossover
4. **RSI Bullish Divergence**
* Price makes a lower low while RSI makes a higher low
5. **Close Above MA200**
* Price aligned with the long-term trend direction
### ▶ Additional Confirmation Components (5)
6. **ADX Trend Strength**
* Confirms that a real trend is forming
7. **Volume Spike**
* Significant increase in trading volume vs average
8. **Stochastic Oversold Cross**
* %K crosses upward below the 30 level
9. **Bollinger Band Rebound**
* Price recovers after breaking below the lower band
10. **Bullish Candlestick Pattern**
* Engulfing, Hammer, or similar reversal patterns
> Scores are **not simple +1 increments**.
> Each component contributes a **weighted value**, reflecting its real-world importance.
## 📊 Emoji Score System (8 Levels)
| Score Range | Emoji | Meaning |
| ----------- | ------ | ---------------------------------- |
| ≤ 0 | 🔴 | Invalid / no signal |
| 0 ~ 1 | ⚪ | Very weak |
| 1 ~ 2 | 🟡 | Weak |
| 2 ~ 3 | 🟢 | Moderate |
| 3 ~ 4 | 🔵 | Decent |
| 4 ~ 5 | 📈 | Trend forming |
| 5 ~ 6.5 | 🚀 | Very strong |
| **6.5+** | **👑** | **Premium, high-confidence setup** |
👑 **The crown emoji appears only when the total weighted score exceeds 6.5**,
meaning multiple high-importance conditions are aligned simultaneously.
This prevents “emoji inflation” and ensures that premium signals remain rare and meaningful.
## 🖥 Chart Features
* Uses **REAL Ichimoku Cloud** (no future displacement)
* Displays score emojis directly on breakout candles
* Supports LONG / SHORT / BOTH modes
* Optional display limited to the most recent N bars
* Top-right panel explains scoring structure and logic
* Completely ignores false breakouts (above → inside → above)
## 🔧 User Options
* Adjust Ichimoku, MA, RSI, MACD, ADX parameters
* Enable or disable individual scoring components
* Fully customize emoji symbols
* **Display only signals above a chosen minimum score**
* e.g. show only 👑 setups by setting minimum score to 6.5
## ⚠️ Disclaimer
CloudScore PRO is a **probability-based trend evaluation tool**,
not a standalone buy or sell signal.
Signal strength may vary depending on:
* Market volatility
* Timeframe
* Volume environment
Always perform proper backtesting and apply sound risk management
before using this indicator in live trading.
Risk & Position CalculatorThis indicator is called "Risk & Position Calculator".
This indicator shows 4 information on a table format.
1st: 20 day ADR% (ADR%)
2nd: Low of the day price (LoD)
3rd: The percentage distance between the low of the day price and the current market price in real-time (LoD dist.%)
4th: The calculated amount of shares that are suggested to buy (Shares)
The ADR% and LoD is straightforward, and I will explain more on the 3rd and 4th information.
__________________________________________________________________________________
The Lod dist.% is a useful tool if you are a breakout buyer and use the low of the day price as your stop loss, it helps you determine if a breakout buy is at a risk tight area (~1/2 ADR%) or it is more of a chase (>1 ADR%).
I use four different colors to visualize this calculation results (green, yellow, purple, and red).
Green: Lod dist.% <= 0.5 ADR%
Yellow: 0.5 ADR% < Lod dist.% <= 1 ADR%
Purple: 1 ADR% < Lod dist.% <= 1.5 ADR%
Red: 1.5 ADR% < Lod dist.%
(e.g., if Lod dist.% is colored in Green, it means your stop loss is <= 0.5 ADR%, therefore if you buy here, the risk is probably tight enough)
__________________________________________________________________________________
The Shares is a useful tool if you want to know exactly how many shares you should buy at the breakout moment. To use this tool, you first need to input two information in the indicator setting panel: the account size ($) and portfolio risk (%).
Account Size ($) means the dollar value in your total account.
Portfolio Risk (%) means how much risk you are willing to take per trade.
(e.g. a 1% portfolio risk in a 5000$ account is 50$, which is the risk you will take per trade)
After you provide these two inputs, the indicator will help you calculate how many shares you should buy based on the calculated Dollar Risk ($), real-time market price, and the low of the day price.
(e.g. Dollar Risk (50$), real-time market price (100$), Lod price (95$) -> then you will need to buy 50/(100-95) = 10 shares to meet your demand, so it will display as Shares { 10 } )
In addition, I also introduce a mechanism that helps you avoid buying too big of a position relative to your overall account . I set the limit to 25%, which means you don't put more than 25% of your account money into a single trade, which helps prevent single stock risk.
By introducing this mechanism, it will supervise if the suggested Shares to buy exceed max position limit (25%). If it actually exceeds, instead of using Dollar Risk ($) to calculate Shares, it will use position limit to calculate and display the max Shares you should buy.
__________________________________________________________________________________
That's it. Hope you find this explanation helpful when you use this indicator. Have a great day mate:)

Delbert SetupDelbert Setup is a clean, time-based session framework designed for traders who follow PNY, NYO, and evening market structure in IST (Asia/Kolkata) time.
It highlights key intra-day timing, PNY/NYO session highs/lows, and important schedule-based vertical markers for structured intraday planning.
🔍 What This Indicator Shows
1. PNY Session (09:30–18:55 IST)
Automatically draws:
PNY High (PNYH)
PNY Low (PNYL)
Thin solid levels from session start to session end
Vertical dotted lines at PNY open & close with timestamp labels
2. NYO Session (19:00–19:55 IST)
Displays:
NYOH / NYOL levels
NYO open/close vertical dotted lines
Session-only range levels (thin solid 1px)
3. 00:30 IST Marker
A dedicated vertical dotted line at 00:30 IST, useful for:
Timing bias
Session transitions
Trade management cutoffs
4. Optional NQ Reference Levels
If enabled, the script plots:
NQ open price at NYO start
Adjustable ± offset bands (default 100 points)
These assist traders correlating NQ behavior with their instrument.
🎨 Visual Style
All vertical lines → thinnest dotted black
PNY / NYO highs & lows → thin solid levels (1px)
Time labels → red, size-small, placed above chart structure
Designed for clean visual structure without clutter
🕒 Why IST Timing?
This indicator is tailored for traders who operate in India Standard Time, aligning PNY/NYO with local clock time without mental conversion.
All calculations use Asia/Kolkata timezone internally.
⚠ Notes
This indicator does not generate buy/sell signals.
It is meant as a market structure & session map, helping traders reference key liquidity and timing zones.
Works on any timeframe and across all assets.
✔ Ideal For Traders Who Use:
Session-based models (PNY, NYO, Pre-New York)
Liquidity sweeps near session highs/lows
Timing-based bias
Correlation models with NQ

ORB + FVG + PDH/PDL ORB + FVG + PDH/PDL is an all-in-one day-trading overlay that plots:
Opening Range (ORB) high/low with optional box and extension
Fair Value Gaps (FVG) with optional “unmitigated” levels + mitigation lines
Previous Day High/Low history (PDH/PDL) drawn as one-day segments (yesterday’s levels plotted across today’s session only)
Includes presets (ORB only / FVG only / Both) and optional alerts for ORB touches, ORB break + retest, FVG entry, and PDH/PDL touches.

