RSI TREND FILTERRSI TREND Filter on Chart
RSI scaled to fit on chart instead of oscillator, Trend Analysis is easy and Hidden Divergence is revealed using this indicator. This indicator is an aim to reduce confusing RSI Situations. The Oversold and Overbought lines help to determine the price conditions so its easy to avoid Traps.
Oversold and Overbought conditions are marked on Chart to make it useful to confirm a Buy or Sell Signals.
RSI 50 level is plotted with reference to EMA50 and Oversold and Overbought Conditions are calculated accordingly.
Uptrend: RSI Cloud / Candles above RSI 50 Level
Down Trend: RSI Cloud / Candles below RSI 50 Level
Sideways : Candles in the Gray Area above and below RSI 50 Level
Default RSI (14) : is the Candlestick pattern itself
Disclaimer: Use Solely at your own Risk.
Candlestickpattern

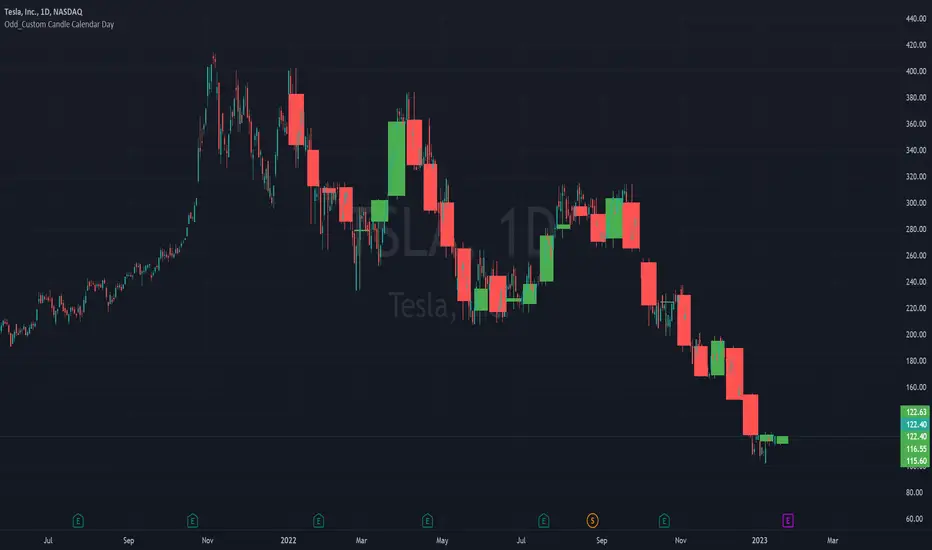
Odd_Custom Candle Calendar DayEver wonder how candles would look on a chart if they were tracked by calendar day instead of market days?
Option(s)-
📅Custom start date for candle formation
✖️Candle multiplier
🌈Up / Down Colors
Features-
📋Displays candle data with invisible plots
Use Move to Existing Pane to Overlay on chart.
Can only display a max of 500 candles!
Simple STRAT Tool by nnamWhat this Indicator Does
This indicator is a very simple tool created specifically for experienced Straters. It was created for those Straters who fully understand the 1-2-3 Strat Scenarios, are in need of an easy to use tool, and do not want or need a lot of messy markings on their chart.
The indicator simply allows the user to color code the Strat 1, 2 ,3 (Inside /Outside /Up / Down) Bars as desired and by default extends lines to the right of the chart from the Highs and Lows of the previous 2 Bars giving the user a simple reference for Strat scenario structure breaks.
As shown above, the bars are color coded, but the original bar color is maintained via the border and wick.
If a bar is an Outside Bar or an Inside Bar, it is still easy to identify whether or not the bar was a Bullish or Bearish 1 or 3.
The same goes for 2UP and 2Down Bars - It is easy to identify Bullish or Bearish UP or DOWN Bars.
Optionally, as show in the screenshot below, the user can extend the lines in both directions to get an "at a glance" better understanding of where price is currently vs previous support and resistance areas.
For Straters that prefer to trade only INSIDE BAR BREAKOUTS there is an optional input setting labeled "Trade Inside Bars ONLY".
This setting turns OFF the lines that extend from the 2nd previous bar back and only displays and extend lines from the previous bar IF and ONLY IF the current bar is an INSIDE (one) bar. .
The User Input settings allow for the following customizations:
1. Custom Outside Bar Color
2. Custom Inside Bar Color
3. Custom 2 Up Bar Color
4. Custom 2 Down Bar Color
5. Turn ON or OFF color coded bars
6. Trade only INSIDE Bar Breakouts
7. Extend Lines Both Directions
8. Hide all Lines
The customizable settings above allow the user to hide all lines and turn OFF color coding without having to fully remove the indicator from the chart. This is convenient when the user has another indicator that uses color coded bars or the lines conflict with another indicator and they need to be temporarily disabled.
If you have any questions regarding this indicator please let me know. If you have any suggestions for minor tweaks to the indicator do not hesitate to ask for them.
I hope you enjoy this indicator and get some usefulness from it... HAPPY TRADING!!
The Ganesh TrendThe Ganesh Trend is an indicator developed by Ganesh to help Traders to identify potential trend showing candle .This indicator identifies bullish and bearish candle with some specific rules. This gives fair idea of direction of market .It is very helpful if you use it on Nifty 50 index . Candlestick developed by me is my original work . It is very helpful for new traders looking for proper entry and exit . It has stop loss and target as well . red dot shows the stop loss and green dot shows the target . taking 2-3 trades a day is good . Thank You . NSE:NIFTY

Ross Hook Pattern (Expo)█ Overview
The Ross Hook pattern is one of the most consistent and successful trading patterns that have been around for years. The Ross Hook is the first correction following the breakout of the 1-2-3 formation . This means that the Ross Hook only occurs in established trends. In other words, Ross Hook is a trend continuation setup. To fully understand the Ross Hook formation, you must understand the 1-2-3 pattern .
Ross Hook Pattern (Expo) is an indicator designed to detect the Ross Hook formation automatically and in real-time in any market and timeframe. With the inbuilt alert feature, the Ross Hook Pattern (Expo) Indicator analyzes the market for you and notifies you when the Ross Hook formations have been found.
█ How to use
Use this indicator to identify the Ross Hook pattern and to find good trend continuation setups. The formation can be used to determine when a trend is confirmed and established.
-----------------
Disclaimer
The information contained in my Scripts/Indicators/Ideas/Algos/Systems does not constitute financial advice or a solicitation to buy or sell any securities of any type. I will not accept liability for any loss or damage, including without limitation any loss of profit, which may arise directly or indirectly from the use of or reliance on such information.
All investments involve risk, and the past performance of a security, industry, sector, market, financial product, trading strategy, backtest, or individual's trading does not guarantee future results or returns. Investors are fully responsible for any investment decisions they make. Such decisions should be based solely on an evaluation of their financial circumstances, investment objectives, risk tolerance, and liquidity needs.
My Scripts/Indicators/Ideas/Algos/Systems are only for educational purposes!

1-2-3 Pattern (Expo)█ Overview
The 1-2-3 pattern is the most basic and important formation in the market. Almost every great market move has started with this formation. That is why you must use this pattern to detect the next big trend. In fact, every trader has used the 1-2-3 formation to detect a trend change without realizing it.
Our 1-2-3 Pattern (Expo) indicator helps traders quickly identify the 1-2-3 Reversal Pattern automatically. By analyzing the price action data, the indicator shows the pattern in real-time. When the pattern is discovered, the 1-2-3 Pattern (Expo) Indicator notifies you via its built-in alert feature! Catching the upcoming big move can't be that much simpler.
█ How to use
The 1-2-3 pattern is used to spot trend reversals. The pattern indicates that a trend is coming to an end and a new one is forming.
-----------------
Disclaimer
The information contained in my Scripts/Indicators/Ideas/Algos/Systems does not constitute financial advice or a solicitation to buy or sell any securities of any type. I will not accept liability for any loss or damage, including without limitation any loss of profit, which may arise directly or indirectly from the use of or reliance on such information.
All investments involve risk, and the past performance of a security, industry, sector, market, financial product, trading strategy, backtest, or individual's trading does not guarantee future results or returns. Investors are fully responsible for any investment decisions they make. Such decisions should be based solely on an evaluation of their financial circumstances, investment objectives, risk tolerance, and liquidity needs.
My Scripts/Indicators/Ideas/Algos/Systems are only for educational purposes!
Candlestick - Kicker PatternNot many candlestick patterns hurt traders on the other side of the trade more than this signal, when it happens, think of it as kicking in the teeth, the pain is real.
An upwards signal is painted when you have a two-bar formation, the one on the left is a bearish one whereas the successive one is bullish, when you have fat bodies in both candles, meaning the open is close to the high and the close is close to the low for the first candle, while the open is close to the low and the close is close to the high for the adjacent candle, the pain is ever more excruciating, the other important condition is the open of the first candle must be lower than the open of the latter one.
The downwards signal is vice versa of the upwards signal.
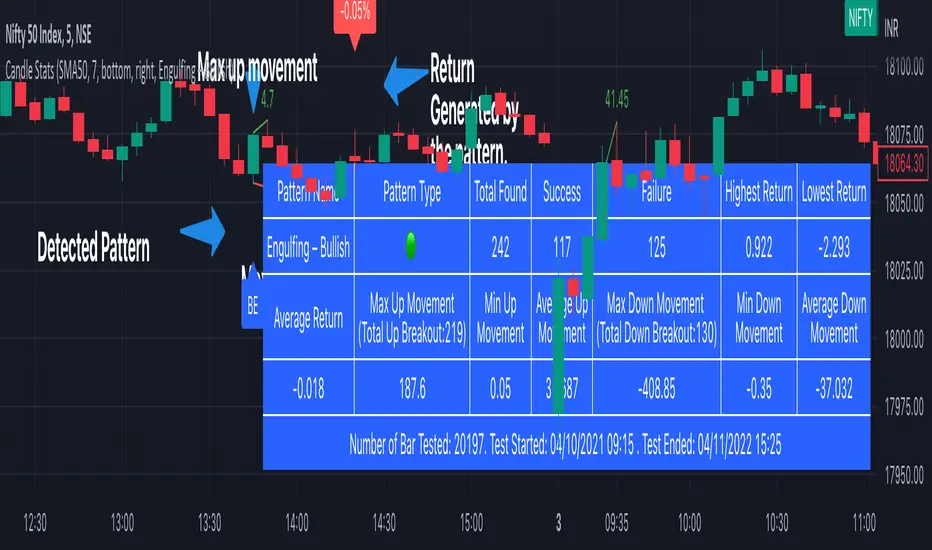
Candlestick Stats [tanayroy]The script detects candlestick patterns and stats related to the pattern. We have included 44 candle patterns to select. You can get stats for any timeframe and holding period. If a particular pattern is not available, the script will give an error.
What is available.
You can view the composite stat in the table panel.
Pattern Name: The pattern name
Pattern Type: Bullish(🟢)/ Bearish(🔴)/ Neutral(⚫)
Total Found: Number of time pattern appeared in the chart
Success: Number of time the pattern generated a positive return
Failure: Number of time the pattern generated a negative return
Highest Return: Highest return generated by the pattern (assuming trade taken at the open of the next candle and closed at the close price of the last candle of the holding period).
Lowest Return: Lowest return generated by the pattern
Average return: Average return generated by the pattern
Total Up Breakout: Number of time patterns take an up breakout(break above high).
Max Up Movement: Maximum up movement recorded by the pattern(distance between pattern high and highest high candle in given holding period).
Min up movement: Minimum up movement recorded by the pattern.
Average Up Movement: Average up movement recorded
Total Down Breakout: Number of time patterns take a down breakout(break below low).
Max Down Movement: Maximum down movement recorded by the pattern.
Min Down Movement: Minimum down movement recorded by the pattern.
Average Down Movement: Average down movement recorded
You can find the number of bars tested, start date and end date in the panel.
You can visually inspect the candle pattern performance in the chart.
Available options:
Detect Trend: You can detect trends based on SMA 50, SMA 50/200 or No detection.
Stat bars: Holding period after detecting the pattern.
Panel position: Position the stat table as per your choice.
Select pattern: Select available predefined pattern.
Label color: choose color according to your choice.
SFC Smart Money Manipulation - MTF ZonesThis indicator shows the most important manipulated zones - true support and resistance.
The indicator can show the zones from different time frames - 1H, 4H, D and the current TF.
Order Block definition - small candle or few consecutive candles, where banks place buy and sell orders in order to manipulate the price. After price is manipulated and moved in one direction, the banks are in draw down, that is why they manipulate the price one more time before the true move, retesting these candles (closing losing positions).
FU candles
FU candles are most manipulated candles and create very strong reaction zones. These are the true zones, where the banks place their orders.
Why they are so strong? The answer is very simple - these candles clear the liquidity from the previous ones. After the liquidity is cleared ( all stop losses/pending orders are triggered), price reveal the true direction and move very fast.
FU candles are type of Order Blocks - the most powerful one.
Because the most volume is in the body of the order block. The indicator shows not only the FU candle, but the body of the order block.
There are two types of FU candles :
(only full FU candles are displayed as zones, because they are much significant)
1) Full fu, where the current candle completely engulf the previous one, after taking the liquidity. (displayed as F)
2) Current candle only take liquidity from the previous one, but failed to engulf it. (displayed as A)
9 day simple moving average is also displayed. When the price form Fu candle above/under the MA, there is a better chance for reversal.
When FU candles are retested the transparency will change, showing that the zones may have less impact.
Order Blocks
Only the current order blocks are displayed. Price react very often from the 50% level, that is why this level is also displayed.
Rejections
Rejections are doji candles or candles with big wicks. These rejections very often lead to reversals or deep pullbacks. But before the true move, price test the rejection levels. The retest is not always, but very often of the 50% of the wick.
The rejections are very important price zone.
The indicator can show the zones from different time frames - 1H, 4H, D and the current TF. When wicks are retested the transparency and colour will change, showing that the wicks may have less impact or no more impact.
Settings
-The colour and transparency of the zones can be changed.
- Multi time frames zones could be disabled.
- Doji settings
- Length of the moving average
How to use
If price reach one of the displayed zones. The trader should be prepared for price reaction. This reaction could lead to reversal, pull back or trading range.
The trader should have bias from the higher time frames and watch for signs of manipulations on smaller time frames.
Candlestick OB FinderIntroduction
Hello, this here is a non-repainting candlestick indicator which is able to detect OB looking candlestick formations.
Usage
It can be used to confirm entries, but be aware that it produces a lot of false signals.
Somehow the swings tend to reverse at these points.
I recommend the 10–15 minutes timeframe.
I hope you enjoy this small indicator. :)
Pro Trading Art - Candlestick Patterns with alertAll candlestick pattern based on "Japanese candlestick charting techniques".
Currently Supported List of Candlestick Patterns :
Hammer
Hanging Man
Inverted Hammer
Shooting Star
Morning Star
Evening Star
Bullish Engulfing
Bearish Engulfing
Important Points:
1. You can create alert for all patterns.
2. You can modify multiplier(Length Of Shadow) for Hammer, Hanging Man, Inverted Hammer and Shooting Star
3. You can modify EMA length for upward and downward validation of any pattern.

Wall St. Cheat SheetThis is my best attempt to recreate the famous Wall St. Cheat Sheet BAR/CANDLE Colors. There is a lot of exotic math, oscillators, and other underlying functions that help determine the appropriate colors based on emotional sentiment.
There are some new colors like Purple that help to represent fractal patterns.
White candles help to show over-bought and over-sold conditions.

Engulfing Candles (Bullish and Bearish) + Trend | by Octopu$⛳ Engulfing Candles (Bullish and Bearish ) with Trend Recognition | by Octopu$
This Indicator identifies and plots Engulfing Candlestick Patterns.
Engulfing Candles are a combination of two bars on a price chart.
They are used to indicate/anticipate a market reversal.
The second candlestick must be bigger than the first, so it 'engulfs' the previous bar.
This indicator identifies both Price Movements:
Bullish stands for Upside
Bearish stands for Downside
These are NOT entry/exit signals to buy or sell securities*
(*The combination of your understanding and analysis as well as other Indicators and Factors as Confluence, you can improve your Charting Analysis.)
www.tradingview.com
SPY
ANY Ticker. ANY Timeframe.
( SPY 5m as an example only.)
Features:
• Engulfing Candles
• Bullish Setups
• Bearish Setups
• Symbol Signals
Options:
• Color Picker
• Symbol Selector
• Toggle On/Off
• Show name
• Trend Direction
Notes:
v1.0
Indicator release.
Changes and updates can come in the future for additional functionalities or per requests. Follow and Stay Tuned!
Did you like it? Please Support and Shoot me a message! I'd appreciate if you dropped by to say thanks! Thank you.
- Octopu$
🐙
((Bearish)) Candle Above EMASGood Morning from the UK.
Todays script is a simple vieweing of when candles close above a certain moving average - when the market is bearish conditions - candle which close above the moving average can be viewed as a bearish signal along with confluences such as price action. This script is best on the Daily and we can expect big price moves away from this area.
The below example, we have a bearish set up with a break of trendline and then a break of a base which would 1) strong area as price is unlikely to go past this area which would make this a supply zone.
This was then followed by the signal of the candle closing above the 100ema and the 50ema.
The script is likened to my one of my previous scripts which portrays the bullish ema candle closes.
I will be making a price action publish soon if that is of interest to the public.

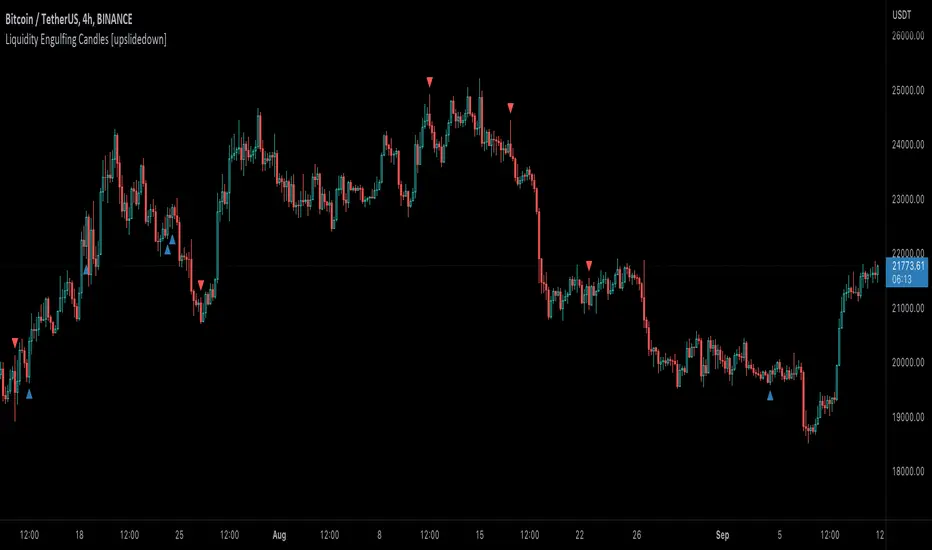
Liquidity Engulfing Candles [upslidedown]Liquidity engulfing candles (LEC) are a variant of a common candlestick pattern: engulfing candles but with a couple extra conditions applied. These conditions expect highs/lows to be taken out in order to show a continuation or reversal signal.
Filter 1: Stop Hunt Wick Filter
This filter requires the candle to wick into the prior candles high or low ( bullish = wick below prior candle lows). This is the stop hunt.
Filter 2: Close Filter
This filter requires the candle to close above or below above the prior candle ( bullish = close above prior candle high). This is the confirmation.
This idea was introduced to me by @attrk632. Thanks, mate!
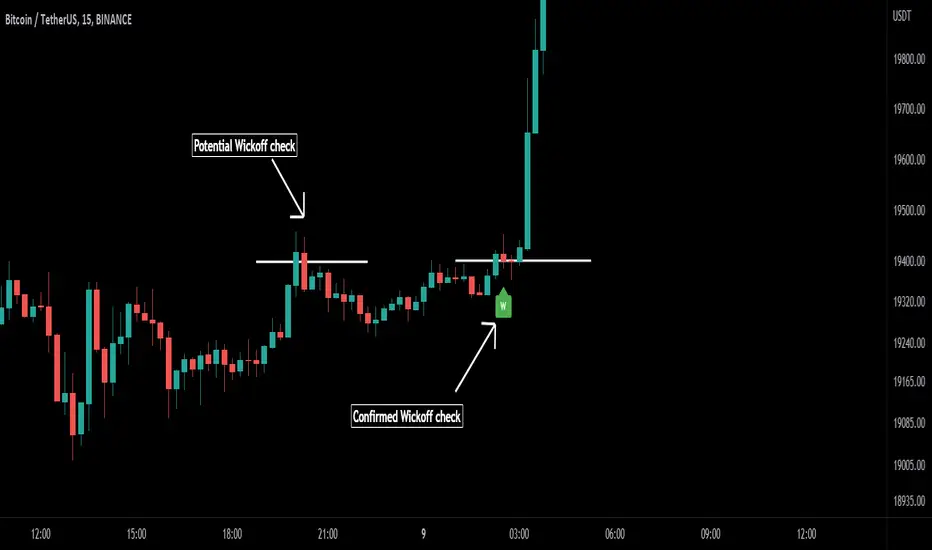
Wick-off Check Pattern [Misu]█ This Indicator shows a wick-off check pattern.
This pattern appears when a candle goes below a level (support or resistance) and closes above it OR when it goes above a level and finishes below it. This causes a wick to go through the level: a wick-off check .
This can confirm a pullback or a breakout.
█ Usages:
This indicator can be used to validate a resistance or support level.
It can also be used to validate breaking levels.
█ Parameters:
Deviation: Parameter used to calculate pivots.
Depth: Parameter used to calculate pivots.
Wickoff Mode: Mode used to detect Wickoff check pattern.
> counter pattern: only shows "pullback" wickoff check.
> breakout pattern: only shows "breakout moves" wickoff check.
> both: shows both.
Lenght Avg Body: Lenght used to calculate the average body size.
First Breakout Factor:
Lenght Avg Wick Validation: This factor multiplied by the "body avg" filters out the non-significant breakout.
Factor Avg Wick Validation: Lenght used to calculate the average wick size.
Max Bars Wickoff: This factor multiplied by the "wick avg", filters out the non-significant wickoff signals.
Candle Info by MontyThis indicator was made to help my friend.
This indicator basically calculates the MOVE in percentage and shows the OHLC of candle in a label.
-> Panel Index: How much index you want the label to be.
-> Show Candle OHLC: Shows Open High Low and Close of the candle in the panel/label
-> % Calculation Mode:
1: Calculated by Candle Wick Low to Candle Wick High for Green candle and Vice Versa for Red Candle
2: Calculated by Open of a candle to the current price.
-> Label Text Color: Used to change the color of the Label Text
-> Label Background Color: Used to change the color of Label background
Join the free Discord: discord.gg/chuffgang

Candlestick Channels [LuxAlgo]Candlestick Channels return channels whose extremities converge towards the price when a corresponding candlestick pattern is detected. This allows for us to obtain more reactive extremities in the presence of a cluster of candlestick patterns.
The detected candlestick patterns are also highlighted with labels on your chart automatically.
Settings
Trend Length: Period of the stochastic oscillator used to determine trend sentiment; this sentiment is used to detect certain candlestick patterns.
Convergence: Convergence percentage of the channel extremities used during the occurrence of a candlestick pattern. A lower value will return extremities converging more slowly toward the price.
Smooth: Determines the degree of smoothness of the channel extremities.
Patterns
This category determines which patterns are detected by the indicator. Patterns toggled off will not be detected and won't affect the channels.
Usage
Candlesticks patterns are commonly used by traders to detect potential reversals or continuation periods in the price. It can be of interest to use them as core elements in the calculation of more classical indicators, this can allow us to filter out potential false signals returned by candlestick patterns by shifting the source of interpretation towards the channel extremities instead.
In this indicator extremities converge towards the price when a corresponding pattern is detected. As such bullish patterns will make the upper extremity converge towards the price, facilitating a cross with price. Using a lower convergence percentage will require a greater number of patterns to make the extremity converge closer towards the price.
Users can use the channel like most indicators returning extremities, with an uptrend being detected when price cross over the upper extremity and a downtrend being detected when price cross under the lower extremity.
An approach solely making use of crosses between the price and the average line can be used but the user should expect further whipsaws signals.
Users can eventually use the candlestick patterns as entries and use the extremities for confirmation. For example, users can follow a candlestick pattern return an indication in accordance with the detected trend by the channels.
This approach would lead to the following of bullish patterns when they occur in an uptrend, that is when the price is above the average line (in orange). The same logic applies to bearish patterns.
The chart above highlights the candlesticks patterns in accordance with a detected trend.
Notes
- Bullish/Bearish engulfing patterns are turned off by default due their more frequent appearance.
- Candlestick patterns relying on gaps were not included, since they would be more uncommon in cryptocurrencies, thus leading to a disparity between the indicator performance on the cryptocurrency and stock market.
Price Action in action
What?
Price Action in Action is an indicator to help Price Action learners and practitioners to get everything related for Price Action in one place.
Price Action is:
Price + Volume = Action
In this indicator, we have the following features available:
Support/Resistance
Using the RSI with different periods in a multiple of 7 (7, 14, 21, 28), we first determine the overbought (above 70, customizable) and oversold (below 30, customizable) regions. Then we pick up the highest point and lowest point in the RSI values in the overbought and oversold regions, respectively. These are the point, historically supply/demand emerged for surety to push down/up the RSI indicator and the corresponding price. So, these are the most accurate way, we believe, to draw support/resistance (or demand/supply) in the chart. By default, the Support is green color and Resistance is red color. To give a visual representation, we differentiate the different shades of green and red. For example, for Level-1 (i.e. 7 by default) we use the darkest shade (0 transparency) and Level-4 (i.e. 28 by default) we use lighter shade (60 transparency). Note please: you can customize the color of support and resistance lines (say if you want resistance as green and support as red). The respective shades (transparency) will be automatically adjusted accordingly. But those shade (transparency) levels are not customizable, they are fixed (please bear with it for version-1 at least).
Strength of Support/Resistance
In the chart above/below the Resistance / Support lines you can see the tiny labels with some numbers like 1, 2.
We found out how many times a particular support/resistance is appearing across multiple RSI periods. E.g. if price P1 appears 2 times among 4 different RSI periods, the number will be 2 for that calculation, and so on.
There can be multiple presence of these numbers in a support/resistance line (i.e. multiple tiny labels). Something like: 1, 1, 2 (into different candles). This means the same support/resistance is tested so many times in different occasion (means there is a RSI max/min coincides in this level over multiple occasions) at different candles.
This will help you to intuitionally gauge the “strength” of a support/resistance line.
The more the marrier, unworthy to mention.
Candle Stick Patterns
Well: we don’t need to tell anything about the Candlestick. All of you know it better than us. And it’s a time proven, zero-lag mechanism to judge the Price-Action is unfolding in the market. We do not know if there is anything better possible than this time tested patterns to judge the prevailing sentiments of market.
Price-Action does not complete without finding out the Candlestick Patterns correctly.
And in this indicator your will get all of these: Single Candle such as Doji (default off), Marubozu, Spinner, hammers, inverted-hammer etc. ; 2 candles like Tweezer, Inside Candle, Engulfing; 3 candles like morning star/evening star.
In the multi candle patterns (2/3 candles), we are grouping the candles with a dotted rectangle such that it is clear which 2/3 candles are part of the pattern. E.g. Morning Star: 3 candles are grouped in a dotted rectangle and the Morning Star label will come to the latest candle (3rd most – as the pattern is detected reliably only on the completion of the 3rd final candle).
Of course, any program can not eliminate your trained eyes and brain to capture the patterns. But we have provided sufficient knobs to adjust various parameters to tweak the candle-pattern detection. Such as Strict Inside Candle(Harami) Boolean knob where the whole current candle including wicks will be inside the body part of the previous big candle. For non-strict mode, the current candle just inside the previous candle, possibly by wicks.
To make it better usable, for every such knobs (which are not obvious) we have added user-friendly tooltip (just mouse hover the question mark (?) besides the control/switch). There are plenty of it.
Volume
Here we have a rudimentary (yet effective) way to judge the volumes.
We find out the Volume Weighted Moving Average (VMWA) of the 20-period (default, but customizable) and the latest volume. If the latest volume is more than the 20 period vwma, we just add a grey diamond on the top of the candle to denote it’s attracting volumes. Of course, we provide a Weight coefficient (default is set to 1). So if the current bar’s volume on bar’s completion is more than the 20 period volume vmwa times the weigh-cofficient, we mark it with a tiny grey diamond.
Points to be noted:
In all places we mark the indication only on the completion of the bar (technically speaking we have checks, as far as possible, with barstate.isconfirmed). However, if you wish, you can turn it off for Candlestick (as some experts may want to check candlestick on the real time, even before the closing of bars).
In case if you see the chart looks cluttered (because of many information, specially in smaller timeframes like 5 min), there are controls given in the settings to toggle each and every features.
By default, we turn off Doji candles (all 3 types of Doji’s – normal, Gravestone & Dragonfly) as they are mainly indecision. However, you can toggle it to turn it on.
It does not give you any Buy/Sell call. The interpretation it does not have.
Why?
What’s unique in it?
As we already mentioned our intention is to include Price (in forms of Support / Resistance), Volume and Action (sentiments in terms of Candlestick patterns) into a single place. And so far, to the best of our knowledge, we could not come across a single indicator provides all of these.
There were works available to determine the RSI based support / resistance zones. Those are great piece works at that time (lets say 3 years back when PineScript was in earlier versions). To the best of our knowledge those does not cover up finding out the lowest / highest point of RSI and the corresponding price to get the simplistic and distinct support/resistance lines.
We have the intuitive support/resistance strength included which we could not found out in current set of available indicators.
To the best of our knowledge, there seems no indicator can detect 3-candle patterns which are extremely popular to detect trend reversals (such as Morning Star or Evening Star). Moreover for the multi-candle patterns we are grouping the candles part of the pattens (2-candles or 3-candles) using a dotted rectangle such that it’s visually clearly (and a well educative material for Price-Action learners also).
Mentions:
There are many works which inspire us along the way. Honestly: we sometimes forgot which all indicators we experimented with. We are sincerely apologetic in case we forgot to mention. A few note-worthy:
There is an indicator from user “repo32” named as “Candlestick Patterns Identified (updated 3/11/15)”. (We could not be able to contact “repo32”). We are inspired from his work that it’s feasible to detect Candlestick patterns.
There is an awesome work done by “RSI Based Automatic Demand and Supply” by user “shtcoinr”. The idea of consulting multiple RSI levels to find out the demand/supply zone we inspired from him. (We did contact “shtcoinr” and got his kind permission to use the concept.)
We are greatly thankful to these abovementioned wizards for their pioneering a-prior work in this front.
And of course, this TradingView platform to provide this abstraction, facilitates and felicitates collaborative contributions.
Ultimately, what’s for you?
That’s the main question. What’s for you?
Price-action comprises of following 3 tasks (at least):
Draw support/resistance lines in the chart.
Once price reaches at the support/resistance line, you fervently look out the candles’ formation to mentally map to the candle patterns. Your aim is divine: You want to judge if the price-action will continue or take a rejection/reversal.
Then you double-confirm with the volume (in a non-overlaid chart below).
Finally take a trade.
For a price-action newbie or seasoned, expert practitioner, you must be doing all the above tasks regularly and manually, in a mechanical, mundane way. There come the humanly subjectivity & the inevitable emotions . This indicator, being a piece of program/code in PineScript latest version v5 , eliminates (or at least, reduces to a great extend) that subjectivity & emotions out of the way of decision making . Thus resulting better yield.
Of course, you can argue that you draw slanted trend lines also. We recommend an already existing indicator by user LuxAlgo named as “Trendlines with Breaks ”, if you wish so.
Disclaimer:
This piece of software does not come up with any warrantee or any rights of not changing it over the future course of time.
We are not responsible for any trading/investment decision you are taking out of the outcome of this indicator.
Happy trading.

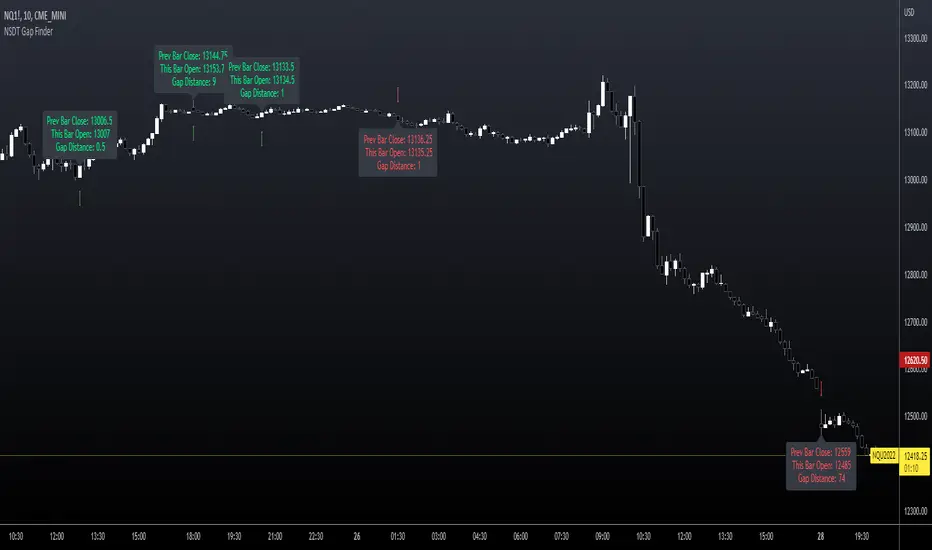
NSDT Gap FinderThis script plots gaps between candles.
It uses the "round_to_mintick" feature in the Pinescript code, so it works on any instrument out to 3 decimal places.
If there is a Gap Up (open of current candle is greater than the close of previous candle) it will plot a green arrow under the current candle and plot a label above the current candle to show the Gap Amount.
If there is a Gap Down (open of current candle is less than the close of previous candle) it will plot a red arrow over the current candle and plot a label below the current candle to show the Gap Amount.
You can turn the label and/or the arrow on and off.
I created this indicator to more easily identify gaps in the market. The probability of a gap being filled is extremely high. Some are right away (intraday candle to candle), some take a while (gap from previous day close to current day open), and some make take a long time (close at end of previous week to open at beginning of current week).
This is published free to use and open source code.
Please see my other similar Gap Indicators.
Daily Gap Range
USA Session - Previous Day Close Gap to Current Day Open
HTF Candles: 3x Multi-Timeframe Candle Boxes #Pip-Whisperer
- Modify 3 Timeframes to display Candle Boxes over your Chart
- Thats it.
- Enjoy!
- If anyone implements candlestick pattern detection to this before me, please send me link, that would be sick!

Stock Tech Bot One ViewTechnical indicators are not limited. Hence, here is another indicator with the combination of OBV, RSI, and MACD along with support, and resistance that follows the price while honoring the moving average of 200, 90 & 50.
The default lookback period of this indicator is 21 though it is changeable as per the user's desire.
The highest high and lowest low for the last 21 days lookback period proven to be the perfect Support & Resistance as the price of particular stock values are decided by market psychology. The support and resistance lines are very important to understand the market psychology which is very well proven with price action patterns and the lines are drawn based on,
Lower Extreme = 0.1 (Changeable)
Maximum Range = 21 days highest high - 21 days lowest low.
Support Line = 21 days lowest low + (Maximum Range * Lower Extreme)
Resistance Line = 21 days highest high - (Maximum Range * Lower Extreme)
RSI - Relative strength indicator is very famous to find the market momentum within the range of 0 - 100. Though the lookback period is changeable, the 14 days lookback period is the perfect match as the momentum of market movement for the last 3 weeks will always assist to identify the market regime. Here the momentum is just to highlight the indication (green up arrow under the candle for long and red down arrow above the candle for short) of market movement though it is not very important to consider if the price of the stock respect the support & resistance lines along with volume indicator (* = violet color).
OBV - Momentum:
The on-balance volume is always going indicator on any kind of tickers, which helps to identify the buying interest. Now, applying momentum on OBV with the positive movement for at least two consecutive days gives perfect confirmation for entry. A combination of the price along with this momentum(OBV) in the chart will help us to know the whipsaw in the price.
The Symbol "*" on top of each bar shows the market interest in that particular stock. If your ticker is fundamentally strong then you can see this "*" even when the market falls.
MACD:
One of the favorites and simple indicators widely used, where the thump of the rule is not to change the length even if it is allowed. It's OK to believe blindly in certain indicator and consider it while trading. That's why the indicator changes the bar color by following the MACD histogram.
Volume:
It may be the OBV works based on the open price and close price along with volume movement, it is wise to have the volume that is plotted along with price movement that should help you to decide whether the market is greedy or fearful.
The symbol "-" on top of each bar tells you a lot and don't ignore it.
Moving Average:
Moving average is a very good trend indicator as everyone considers seeing along with the price in the chart which is not omitted while we gauge the price movement alone with volume in this indicator. The 200, 90 & 50 MA's are everyone's favorite, and the same is plotted on the chart.
As explained above, the combination of all four indicators with price movement will give us very good confidence to take entry.
Candlestick Pattern:
You should admire the techniques of the candlestick pattern as you navigate the chart from right to left. Though there are a lot of patterns that exist, it is easy to enable and disable to view the signal as the label.
Further, last but not least, the exit always depends on individual conviction and how often the individual watch the price movement, if your conviction is strong then follow the down arrow red indication. If not, then exit with a trailing stop that indicates the bar with orange color.
Happy investing
Note: It is just a combination of multiple indicators and patterns to get one holistic view. So, the credit goes to all wise developers who publically published.

Impactful pattern and candles pattern AlertThe Alertion indicator!
impactful pattern:
pattern that happen near the zone or in the zone at lower timeframe and give us entry and stop limit price.
It is helpful for price action traders and those who want to decrease their risk.
There are 3 IP patterns:
Quasimodo
Head and shoulder
whipsaw engulfing
These patterns may occur near the zone or may not occur but by them, you can decrease your trading risk for example you can
trade with half lot before IP pattern and enter with other half after pattern.
how to use?
for example:
you find zone at 1h timeframe for short position
when price enter to your zone
you run this indicator and choose your lower timeframe, for example 15m and click on short position.
Then make the alert by right-click on your chart and choose the add alert and at condition box choose the impactful pattern and then click on create
now wait for message :)
Candles pattern:
like reversal bar, key reversal bar, exhaustion bar, pin bar, two-bar reversal, tree-bar reversal, inside bar, outside bar
these occur when the trend turn, so it is usable when the price enter to your zone or near your zone.
This pattern can decrease your risk.
Inside bar and outside bar:
if this pattern engulf up, it is bullish pattern and if engulf down, it is bearish pattern.
what does this indicator do?
this indicator is for making alert
it helps you to decrease your risk and failure.
You optimize it to alert you when IP pattern happen or candle pattern happen or inside bar or outside bar engulfing or all of them.
For IP pattern, it will message you entry and stop limit price.
It works at 2 different timeframes, so you can make alert for example in 1h TF for candles pattern and 15m TF for IP pattern.
Indicator will alert you for candles pattern at your chart timeframe and for IP pattern at timeframe you've chosen when you run the indicator, and it is changeable
in setting.
setting options
TIMEFRAME
IP: select the timeframe for IP patterns it means when IP pattern happen at that timeframe the indicator will alert you
example = your TF is 1h, you found the supply zone and want to trade, note that IP pattern happen in lower TF, so you select 15m TF or TF lower than 1h.
Short position: select it if you want to make short position.
BUFFERING
indicator send you entry and stop limit price
you can change it by amount of percent
it is your strategy to change your entry and stop loss or not
example= in head and shoulder pattern at short position, the stop limit is high price of head in pattern
so the indicator will message you the exact price but if you want to put
your stop limit 5 percent upper than exact price you can enter 5 in front of stop loss
or you want to enter 5 percent lower than exact high price of shoulder, you can optimize it.
ALERTION
you choose what alert you want
IP alert or candle alert or inside and outside bar alert
type your text for alert
you can write additional text for your message
ADVANCE
IP alert frequency option:
1. Once per bar : indicator will alert you for IP pattern once at your chat timeframe bar, and you should wait til next bar for next alert.
2. Once per bar close : alert you when your chart timeframe bar closed and next alert will happen when next bar is closed.
3. All: alert you all the times IP pattern happen
pivot left and right bars: lower will find smaller pattern
at the END:
this indicator is not strategy
it is part of your strategy that help you to increase your winning rate.
It is helpful for scalping and candle patterns finding.
After you make an alert, you can delete the indicator or change your timeframe or make another alert, your previous alert won’t change.
Thank you all.
