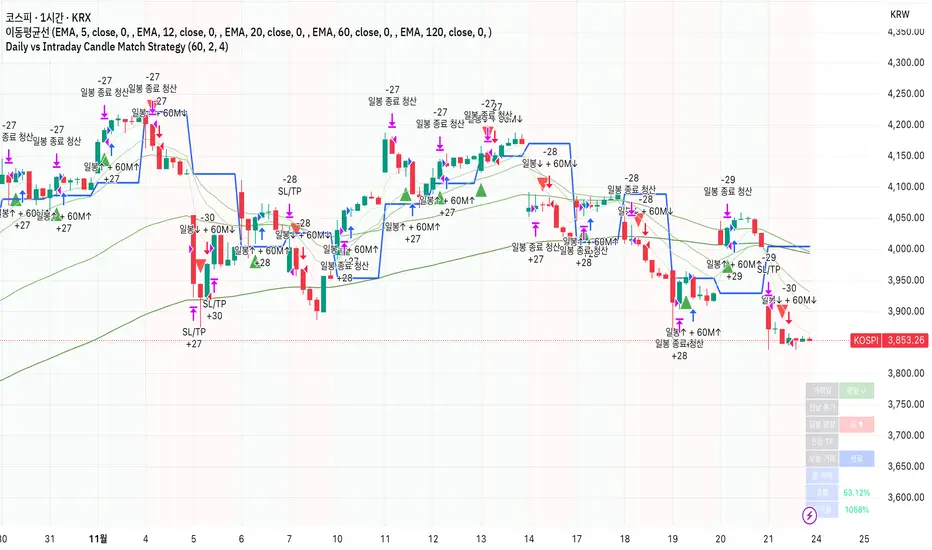
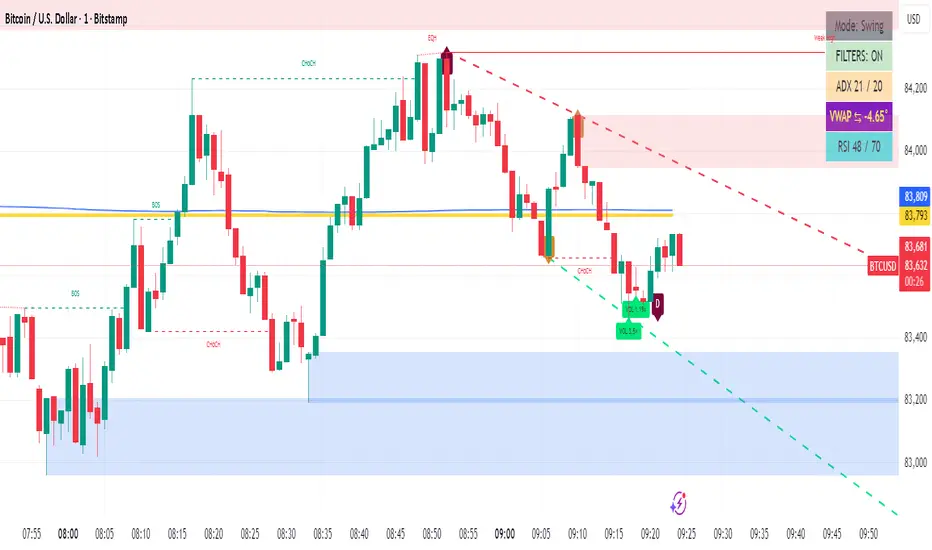
Daily vs Intraday Candle Match Strategy고죠 훈의 차트공부방
Gojo Hoon’s Trading Room
전일 종가 대비 현재 일봉 방향과 시간봉 방향이 일치할 때 진입
Trade when current daily direction (vs. previous close) matches the hourly/15-minute candle direction.
תבניות גרפים
Kill Zone Strategy - Exact Match고죠 훈의 차트공부방
Gojo Hoon’s Trading Room
Kill Zone 시간대 방향성과 일중 추세의 상관관계
The 9–10 AM Kill Zone candle on the KOSPI chart determines the day’s long or short trading direction.

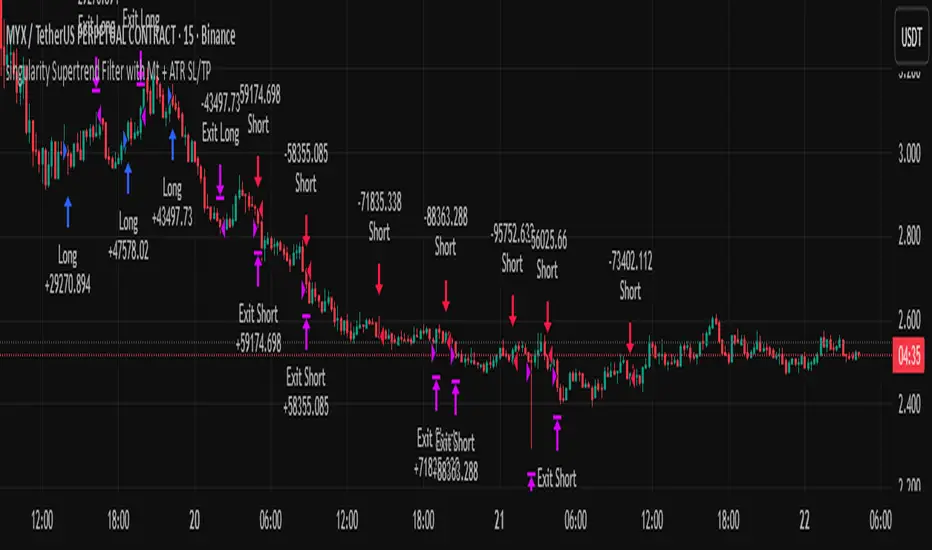
singularity crypto editionA trend following strategy that enters in a pullback of a trend . works greate on 3m to 15m timeframe. should be optimize on current market regime
Simple MA Crossover w/ SLTPPicture two cheetahs on a racetrack made of price candles. One cheetah is fast and twitchy (the short-term EMA). The other is chill, lumbering, and takes its sweet time (the long-term EMA). When the twitchy cheetah sprints ahead and crosses above the chill one → “BUY, YOU MAGNIFICENT DEGEN!” When the twitchy one gets tired, slows down, and gets lapped from above → “SELL before this turns into a horror movie!”
That, my friend, is the EMA crossover strategy in its purest, most dramatic form.

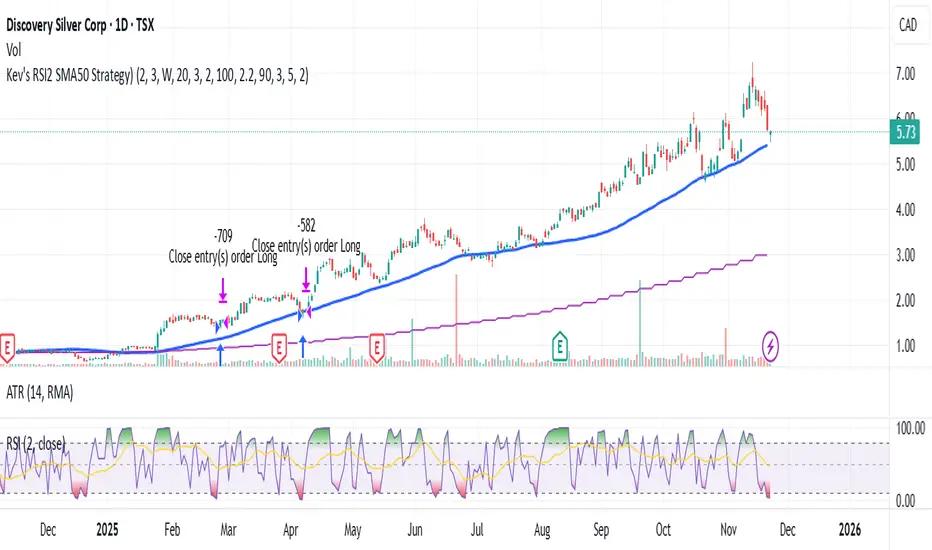
Kev's RSI2 SMA50 Strategy⭐ Kev’s RSI2 SMA50 Strategy — Institutional Edition (TSX Optimized + RR Filter)
A professional swing-trading system based on Larry Connors’ RSI(2) mean-reversion framework, optimized for TSX equities. Designed for Daily timeframe trading with institutional trend alignment, volatility filtering, and strict risk-reward controls.
📌 Overview
This strategy enhances the classic RSI(2) setup with:
• Strong trend confirmation (SMA50 + Weekly SMA50)
• Deep pullback detection (RSI2 < 3)
• Structural swing-based stop-loss
• Fixed 2R profit target (non-repainting)
• Optional Connors RSI (CRSI) confirmation
• Volatility filtering via ATR range
• Mechanical, deterministic, no-discretion rules
Works best on TSX large & mid-caps, ETFs, and liquid equities.
🔍 Core Philosophy
Buy strong stocks on pullbacks → Price must be above SMA50 + Weekly SMA50.
Pullback must be statistically meaningful → RSI(2) < 3.
R:R must justify the trade → Swing-low SL + 2R target with structural room to hit TP.
🧠 Entry Conditions (Non-Repainting)
• RSI(2) < 3 → Identifies extreme short-term oversold dips.
• SMA50 Filter → Ensures uptrend alignment.
• Weekly HTF Filter (Default = 1W) → Confirms broader trend direction.
• ATR Filter → Rejects volatile bars (range < ATR(14) × 2.2).
• Optional:
– SMA50 Slope (positive trend strength)
– Bullish Reversal Candle
– Connors RSI < 20 (deep pullback confirmation)
🎯 Risk Management
All levels are locked at entry and never repaint.
• Swing-Low SL (last 5 bars)
• 2R Profit Target = Entry + (Risk × 2)
• R:R Feasibility Filter → Only enters if recent swing high is above TP.
• Optional RSI Exit → Exit when RSI2 > 90 (enabled by default).
• Optional SMA Exit (disabled by default) → Conservative early exit.
📈 Visuals
The script plots:
• SMA50
• Weekly SMA50
• Swing-Low SL (fixed)
• 2R TP (fixed)
• Optional SMA exit line
All are non-repainting and update only on confirmed bars.
🔔 Alerts
Buy Signal → All entry filters aligned (RSI2, SMA50, HTF, ATR, RR check).
Exit Signal → 2R hit, SL hit, RSI exit, or SMA exit (if enabled).
🧭 Recommended Usage
• Timeframe: Daily
• HTF: Weekly (default)
• Best For: TSX equities, mid/large-cap stocks, ETFs
• Style: Short-term swing trading (1–10 bars)
• Avoid: Low-volume tickers, microcaps, crypto, biotech, news-driven spikes.
🛑 Notes
• All HTF data uses lookahead_off → non-repainting.
• Rules are fully mechanical and deterministic.
• Position sizing uses % equity by default.
• This script is for educational purposes only and not financial advice.
• Always forward-test before using live capital.
黃金5KCompelling Sales Description:
Unlock the Treasure of Consistent Profits!
Want to know where the market's hidden opportunities lie?
Go find them—with our powerful RSI + BB + Channel Automated Trading Strategy!
Tired of guessing when to enter or exit trades? Let our advanced algorithm do the heavy lifting for you. This strategy seamlessly combines:
RSI (Relative Strength Index) to identify overbought or oversold conditions.
Bollinger Bands (BB) to track volatility and pinpoint potential breakouts.
Channel Trading to capitalize on trending markets and price boundaries.
Fully automated, this system executes trades with precision, eliminating emotional decisions and saving you time. Whether you're a beginner or an experienced trader, this strategy adapts to market shifts to help you stay ahead.
Don't just chase profits—unlock the treasure of disciplined, data-driven trading.
Ready to transform your trading journey?
Contact us for details at: kbocc123@gmail.com
Seize the strategy. Secure your success. 🚀
Mir Khans QQQThis strategy is built around how I actually trade QQQ intraday: Opening-Range continuation, VWAP trend reads, OI magnets, and a simple but strict risk framework. It’s designed to keep you on the right side of the session theme (trend vs fade), then only take trades when multiple pieces of confluence line up.
The strategy is tuned for QQQ on intraday timeframes, but the logic is generic enough to experiment with other liquid index products. It’s not financial advice—use it as a structured framework for reading OR, VWAP, and trend strength, and then layer your own execution rules and risk management on top.
Macketings 1min ScalpingThis is a hyper-reactive scalping strategy designed for the 1-minute chart. It utilizes a strict four-EMA hierarchy (80/90/340/500) to ensure trades are only taken in the strongest aligned market trend. The strategy is built to be extremely tight on risk and focuses on capturing the immediate, high-momentum swing that follows a confirmed EMA retest or breakout.
Key Mechanics (How it Works):
Strict Trend Alignment: Entry is only permitted when the faster EMA band (80/90) and the price action are correctly aligned with the slow trend (340/500).
Long: EMA 80/90 must be above EMA 340/500, AND EMA 340 must be above EMA 500. (And vice-versa for Short.)
Expanded Retest Entry: The strategy waits for the price to retest or briefly enter the 80/90 band, then immediately enters upon the confirmed momentum breakout from that band.
Dynamic Risk Management (Tight Ride): The strategy is engineered to ride the wave aggressively while protecting capital immediately:
Extremely Tight Initial Stop Loss (0.2% default): Limits initial risk instantly.
Break-Even Security: Once profit hits 0.3%, the Stop Loss is automatically trailed to secure 0.2% profit (a risk-free trade).
Aggressive Exit Logic: Positions are closed not only upon hitting the Take Profit target (2.5%) but also immediately if the 80/90 EMA band crosses the 340 EMA, signaling a critical loss of momentum.
Disclaimer:
This strategy requires high-liquidity instruments and is best used on low timeframes (1-minute) due to its dependency on fast momentum shifts and tight stops. Backtesting and forward testing are crucial before deployment.

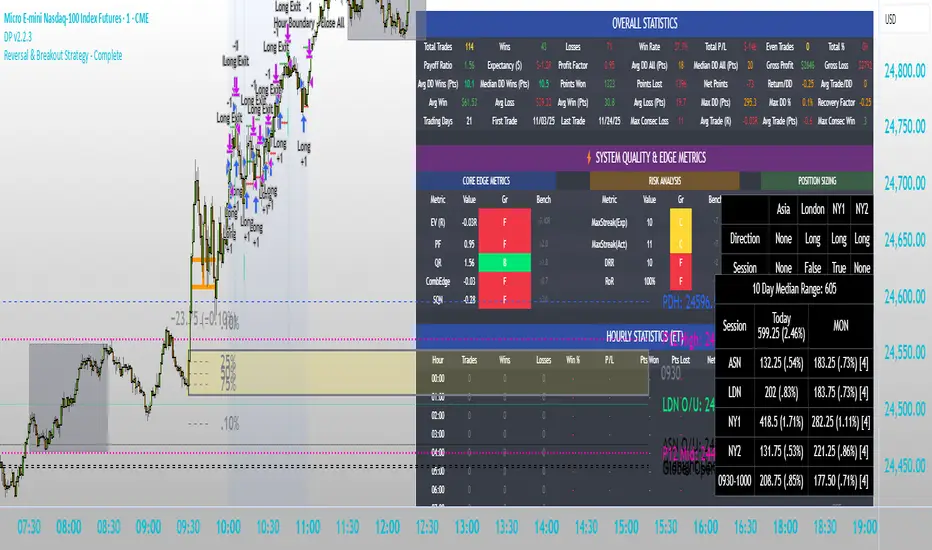
Intraday Market Structure Research Tool (Reversal + Breakout)This script is a fully rule-based intraday strategy designed for research and backtesting purposes, not financial advice. It is intended to help traders study market behavior, time-based price patterns, and statistical trade outcomes under realistic trading assumptions.
What the Strategy Does
This strategy operates in two selectable trade modes:
1. Reversal Mode
Identifies statistically large candles relative to recent volatility
Enters counter-direction trades when price shows exhaustion behavior
Designed to study fade-type behavior around session extremes
2. Breakout Mode
Tracks recent swing highs/lows over a user-defined lookback
Executes trades only after confirmed price expansion beyond these levels
Designed to test momentum continuation behavior
Time & Session Filtering
Trades are only taken during user-defined market sessions, including:
New York 1
New York 2
London
Asia
This allows users to analyze performance differences between global trading sessions.
9:30 AM Opening Range Logic
The script captures the 9:30 AM (Eastern) one-minute candle high/low and uses that as an Opening Range:
Breakout trades can be confirmed above or below this range
The range is visualized for clarity
Risk Management & Realism Controls
This script includes realistic execution mechanics:
Fixed stop-loss and take-profit defined by the user (points or ticks)
Built-in slippage modeling
Commission assumptions included
Position sizing designed to keep risk per trade under 5–10% of account equity when used with realistic account sizes
Users are responsible for choosing realistic account sizes and risk values when running backtests.
Statistical Performance Tracking
The strategy records and displays performance data including:
Win rate
Average win and loss
Maximum drawdown per trade series
Expectancy
Trade distribution by:
Time of day
Session
Market classification
This allows users to study market tendencies and structural behavior over large sample sizes.
Visual Tools
The script displays:
Entry and exit markers
Blocked trade labels (when conditions are not met)
Opening range box
Breakout levels
Use Case Disclaimer
This script is designed for:
Backtesting
Market structure research
Statistical study
It is not guaranteed to be profitable, and results depend heavily on user-selected settings, market conditions, and realistic brokerage assumptions.
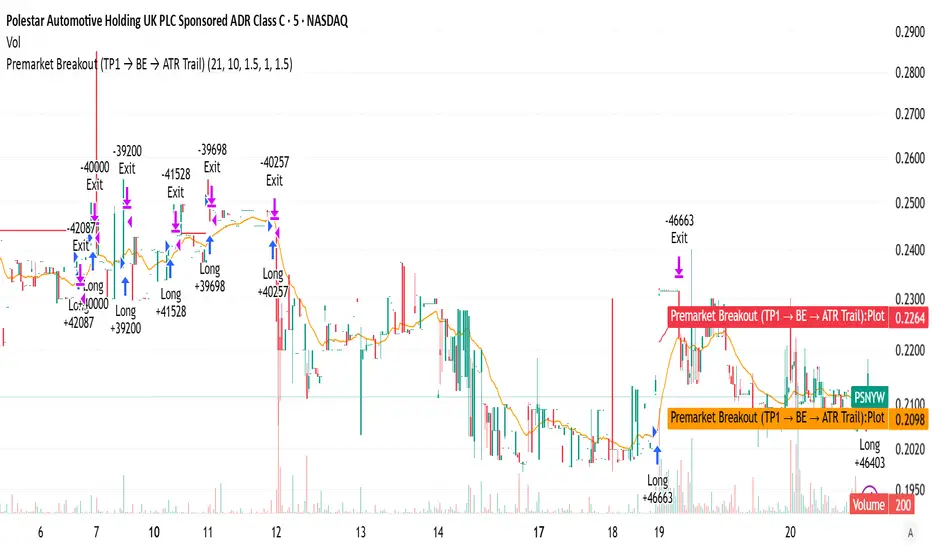
Premarket Breakout (TP1 → BE → ATR Trail)this is the best ever you will really like i t and it does a lot its a really good scirpt please use it to make trades

Premarket Breakout (TP1 → BE → ATR Trail)the best one you can find a very good indicator and strategy to help with al l trading needs in every way
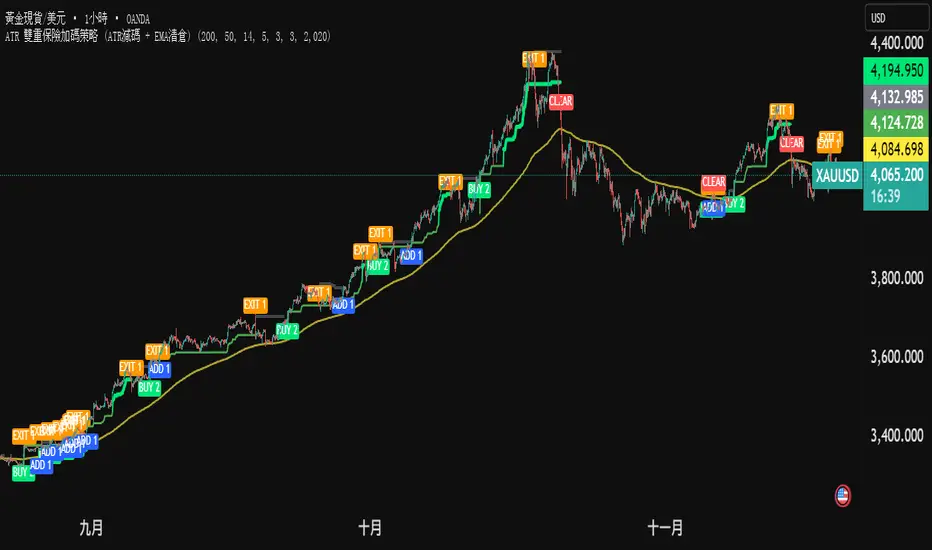
ATR 雙重保險加碼策略 (ATR減碼 + EMA清倉) (三寶爸黃金版)黃金雙保險戰法 (兩口單策略)
核心概念: 進場買兩口。一口賺了就跑(保本),一口死抱到底(拚大賺)。
1. 進場 (買 2 口):
只要價格站上黃線,而且突破前高。
別猶豫,直接買 2 口。
2. 減碼 (賣 1 口):
價格回檔碰到綠線。
代表短線轉弱,先賣掉 1 口。
好處: 錢先放口袋,心裡踏實。
3. 加碼 (買回 1 口):
如果你手上只剩 1 口,結果行情沒死,又創新高。
代表剛才賣錯了,趕快買回 1 口 (補回滿倉)。
好處: 繼續跟著趨勢賺錢。
4. 清倉 (全跑):
價格跌破黃線。
代表趨勢真的結束了,不管剩幾口,全部賣掉。
一句話總結: 「震盪時先賣一半保命,趨勢噴出時永遠滿倉在車上。」
Gold Dual-Insurance Tactic (2-Lot System)
Core Concept: Enter with 2 lots. Sell one early to lock in profits (Play Safe), and hold the other to catch the big wave (Go Big).
1. Entry (Buy 2 Lots):
When price is above the Yellow Line AND breaks the previous High.
Don't hesitate. Buy 2 lots immediately.
2. Scale Out (Sell 1 Lot):
When price pulls back and hits the Green Line.
This means short-term weakness. Sell 1 lot.
Benefit: Put money in your pocket. Peace of mind.
3. Add Position (Buy Back 1 Lot):
If you have only 1 lot left, but the market hits a New High.
It means the trend is alive. Quickly Buy back 1 lot (refill to full position).
Benefit: Continue maximizing profits with the trend.
4. Clear All (Exit Everything):
When price falls below the Yellow Line.
The trend is officially over. Sell everything, no matter what.

CyberG TestTesting the ability to test scripts. I have been working on multiple scripts I want to show my stats for, for possible interests in my scripts

MACD + KD Crossover Strategy (20% TP/10% SL )MACD + KD Crossover Strategy is my first try in tradingview, so it have a lot of space to improve, every can give me suggestion.

ILM & IFVG StrategyPlease feel free to adjust in any way possible. Let me know if you can create something better from this initial coding.
//═══════════════════════════════════════════════════════════════════════
// Inverted Liquidity Model (ILM) – Strategy
//═══════════════════════════════════════════════════════════════════════
//
// The **Inverted Liquidity Model (ILM)** is a liquidity-based algorithm
// built to capture high-probability reversals after:
//
// • A liquidity sweep (SSL/BSL taken)
// • Rejection back inside the range
// • A Fair Value Gap (FVG) forms
// • That FVG becomes invalidated → becomes an IFVG entry zone
//
// ILM combines:
// • LTF BOS / CHOCH structure confirmation
// • HTF structure (expansion) filtering
// • Premium / Discount filter (17:00 CST session midline)
// • Optional ATR volatility filter
// • Optional trading session restrictions
// • Optional partial profit-taking + runners
//
// When all conditions align, the strategy enters:
// ✔ Long after sweep of SSL + valid long IFVG + trend confirmation
// ✔ Short after sweep of BSL + valid short IFVG + trend confirmation
//
// Stops are placed at the sweep wick.
// Full target is set at the next structural high/low.
// Optional partial TP sends a runner to full target.
//
// Visual tools (labels, sweep lines, IFVG boxes, midline) assist
// with review and forward testing.
//
//───────────────────────────────────────────────────────────────────────
// USER CONFIGURABLE FEATURES
//───────────────────────────────────────────────────────────────────────
//
// • **Liquidity & Structure**
// - pivotLen → swing length for pivots / liquidity
// - htfOn → toggle higher-timeframe pivots
// - htfTF → timeframe for HTF structure/liquidity
// - useStructureFilter → enforce LTF BOS/CHOCH trend
// - useHtfExpansionFilter → enforce HTF trend
// - showStructureLabels → show BOS/CHOCH labels
// - showHtfStructureLabels → show HTF BOS/CHOCH labels
//
// • **Premium / Discount Midline**
// - usePremiumDiscountFilter → only long in discount / short in premium
// - pdSession → session used for midline (default 17:00 CST)
// - showPdMidLine → show 50% midline
//
// • **FVG / IFVG Detection**
// - useBodyGapFVG → FVG uses candle bodies instead of wicks
// - useDisplacementFVG → require displacement bar
// - dispAtrMult → minimum ATR threshold for displacement
// - showIFVG → draw IFVG boxes
//
// • **ATR / Volatility / Sessions**
// - useRangeFilter → require minimum ATR%
// - atrLen → ATR period
// - minAtrPerc → minimum ATR% of price
// - useSessionFilter → restrict trading hours
// - sessionTimes → allowed trading session
//
// • **Sweep Visualization**
// - showSweepLines → draw sweep lines at SSL/BSL sweeps
// - sweepLineWidth → thickness of sweep lines
//
// • **Exits: Partial Targets & Runners**
// - usePartialTargets → enable partial TP logic
// - tp1QtyPercent → percent closed at TP1
// - tp1FractionOfPath → TP1 relative to path to full target
//
// • **Formatting / Visibility**
// - labelFontSizeInput → tiny / small / normal / large / huge
// - showEntries → entry markers
// - showTargets → target lines
//
//═══════════════════════════════════════════════════════════════════════
// END OF STRATEGY DESCRIPTION
//═══════════════════════════════════════════════════════════════════════

Crude Oil Time + Fix Catalyst StrategyHybrid Workflow: Event-Driven Macro + Market DNA Micro
1. Macro Catalyst Layer (Your Overlays)
Event Mapping: Fed decisions, LBMA fixes, EIA releases, OPEC+ meetings.
Regime Filters: Risk-on/off, volatility regimes, macro bias (hawkish/dovish).
Volatility Scaling: ATR-based position sizing, adaptive overlays for London/NY sessions.
Governance: Max trades/day, cool-down logic, session boundaries.
👉 This layer answers when and why to engage.
2. Micro Execution Layer (Market DNA)
Order Flow Confirmation: Tape reading (Level II, time & sales, bid/ask).
Liquidity Zones: Identify support/resistance pools where buyers/sellers cluster.
Imbalance Detection: Aggressive buyers/sellers overwhelming the other side.
Precision Entry: Only trigger trades when order flow confirms macro catalyst bias.
Risk Discipline: Tight stops beyond liquidity zones, conviction-based scaling.
👉 This layer answers how and where to engage.
3. Unified Playbook
Step Macro Overlay (Your Edge) Market DNA (Jay’s Edge) Result
Event Trigger Fed/LBMA/OPEC+ catalyst flagged — Volatility window opens
Bias Filter Hawkish/dovish regime filter — Directional bias set
Sizing ATR volatility scaling — Position size calibrated
Execution — Tape confirms liquidity imbalance Precision entry
Risk Control Governance rules (cool-down, max trades) Tight stops beyond liquidity zones Disciplined exits
4. Gold & Silver Use Case
Gold (Fed Day):
Overlay flags volatility window → bias hawkish.
Market DNA shows sellers hitting bids at resistance.
Enter short with volatility-scaled size, stop just above liquidity zone.
Silver (LBMA Fix):
Overlay highlights fix window → bias neutral.
Market DNA shows buyers stepping in at support.
Enter long with adaptive size, HUD displays risk metrics.
5. HUD Integration
Macro Dashboard: Catalyst timeline, regime filter status, volatility bands.
Micro Dashboard: Live tape imbalance meter, liquidity zone map, conviction score.
Unified View: Macro tells you when to look, micro tells you when to pull the trigger.
⚡ This hybrid workflow gives you macro awareness + micro precision. Your overlays act as the radar, Jay’s Market DNA acts as the laser scope. Together, they create a disciplined, event-aware, volatility-scaled playbook for gold and silver.
Antonio — do you want me to draft this into a compile-safe Pine Script v6 template that embeds the macro overlay logic, while leaving hooks for Market DNA-style execution (order flow confirmation)? That way you’d have a production-ready skeleton to extend across TradingView, TradeStation, and NinjaTrader.
Antonio — do you want me to draft this into a compile-safe Pine Script v6 template that embeds the macro overlay logic, while leaving hooks for Market DNA-style execution (order flow confirmation)? That way you’d have a production-ready skeleton to extend across TradingView, TradeStation, and NinjaTrader.

Liquidity Sweep + BOS Retest System — Prop Firm Edition🟦 Liquidity Sweep + BOS Retest System — Prop Firm Edition
A High-Probability Smart Money Strategy Built for NQ, ES, and Funding Accounts
🚀 Overview
The Liquidity Sweep + BOS Retest System (Prop Firm Edition) is a precision-engineered SMC strategy built specifically for prop firm traders. It mirrors institutional liquidity behavior and combines it with strict account-safe entry rules to help traders pass and maintain funding accounts with consistency.
Unlike typical indicators, this system waits for three confirmations — liquidity sweep, displacement, and a clean retest — before executing any trade. Every component is optimized for low drawdown, high R:R, and prop-firm-approved risk management.
Whether you’re trading Apex, TakeProfitTrader, FFF, or OneUp Trader, this system gives you a powerful mechanical framework that keeps you within rules while identifying the market’s highest-probability reversal zones.
🔥 Key Features
1. Liquidity Sweep Detection (Stop Hunt Logic)
Automatically identifies when price clears a previous swing high/low with a sweep confirmation candle.
✔ Filters noise
✔ Eliminates early entries
✔ Locks onto true liquidity grabs
2. Automatic Break of Structure (BOS) Confirmation
Price must show true displacement by breaking structure opposite the sweep direction.
✔ Confirms momentum shift
✔ Removes fake reversals
✔ Ensures institutional intent
3. Precision Retest Entry Model
The strategy enters only when price retests the BOS level at premium/discount pricing.
✔ Zero chasing
✔ Extremely tight stop loss placement
✔ Prop-firm-friendly controlled risk
4. Built-In Risk & Trade Management
SL set at swept liquidity
TP set by user-defined R:R multiplier
Optional session filter (NY Open by default)
One trade at a time (no pyramiding)
Automatically resets logic after each trade
This prevents overtrading — the #1 cause of evaluation and account breaches.
5. Designed for Prop Firm Futures Trading
This script is optimized for:
Trailing/static drawdown accounts
Micro contract precision
Funding evaluations
Low-risk, high-probability setups
Structured, rule-based execution
It reduces randomness and emotional trading by automating the highest-quality SMC sequence.
🎯 The Trading Model Behind the System
Step 1 — Liquidity Sweep
Price must take out a recent high/low and close back inside structure.
This confirms stop-hunting behavior and marks the beginning of a potential reversal.
Step 2 — BOS (Break of Structure)
Price must break the opposite side swing with a displacement candle. This validates a directional shift.
Step 3 — Retest Entry
The system waits for price to retrace into the BOS level and signal continuation.
This creates optimal R:R entry with minimal drawdown.
📈 Best Markets
NQ (NASDAQ Futures) – Highly recommended
ES, YM, RTY
Gold (XAUUSD)
FX majors
Crypto (with high volatility)
Works best on 1m, 2m, 5m, or 15m depending on your trading style.
🧠 Why Traders Love This System
✔ No signals until all confirmations align
✔ Reduces overtrading and emotional decisions
✔ Follows market structure instead of random indicators
✔ Perfect for maintaining long-term funded accounts
✔ Built around institutional-grade concepts
✔ Makes your trading consistent, calm, and rules-based
⚙️ Recommended Settings
Session: 06:30–08:00 MST (NY Open)
R:R: 1.5R – 3R
Contracts: Start with 1–2 micros
Markets: NQ for best structure & volume
📦 What’s Included
Complete strategy logic
All plots, labels, sweep markers & BOS alerts
BOS retest entry automation
Session filtering
Stop loss & take profit system
Full SMC logic pipeline
🏁 Summary
The Liquidity Sweep + BOS Retest System is a complete, prop-firm-ready, structure-based strategy that automates one of the cleanest and most reliable SMC entry models. It is designed to keep you safe, consistent, and rule-compliant while capturing premium institutional setups.
If you want to trade with confidence, discipline, and prop-firm precision — this system is for you.
Good Luck -BG

Faraz Perfect Structure XL / XS (Trend-Filtered)Faraz’s Perfect Structure XL/XS identifies premium trend continuation and reversal setups using a three-filter system:
structural breakouts using dynamic swing-based support/resistance,
trend confirmation via 200-EMA slope,
momentum validation through RSI and MACD.
Signals only trigger when all factors align, eliminating noise, chop, and false signals.
Designed for traders who want clean, high-probability long (XL) and short (XS) entries.

Intellect TBTS V02 [Strategy]📌 Intellect V01 TBO – Trend Breakout Options Strategy
Intellect V01 TBO is an intraday trend-breakout strategy designed for index traders who follow Nifty, BankNifty, and FinNifty.
It identifies trend shifts using structural pivots, adaptive trendlines, and volatility-adjusted breakout zones.
The strategy provides automatic Long/Short signals, optional stop-loss and target projections, and allows users to generate alert messages that include index-option strike information.
🔍 How the Strategy Works
1. Pivot-Based Structure
The script identifies short-term high and low pivots using a user-defined period.
These pivots become anchor points for constructing directional trendlines.
2. Dynamic Trendline Projection
For each pivot, the script builds:
A projected trendline
Two offset lines above/below
A volatility band based on ATR
These help detect potential breakout zones.
3. Breakout Signal Logic
A trade signal is generated when price crosses the projected trendline:
Long Signal – detected when price breaks above a pivot-derived trendline.
Short Signal – detected when price breaks below a pivot-derived trendline.
Users may optionally restrict entries to a specific time window.
🎯 Stop-Loss & Target Zones
When a trade is active:
SL and TP levels are set using ATR-based volatility distance
Levels appear visually on the chart if enabled
Exits occur automatically when TP/SL is hit
The strategy also closes open trades near the end of the session (default 3:10 PM)
These levels are for visual and backtesting support only.
📝 Index Option Strike Calculation (For Alert Text Only)
The strategy can dynamically compute:
ATM strike (with optional bias)
Correct expiry day for Nifty (weekly) and BankNifty/FinNifty (monthly Tuesday)
CE strike for Long signals
PE strike for Short signals
This strike information is only included in alert text for users who configure external automation.
It does not affect backtesting results inside TradingView.
⏱️ Time Window Filter (Optional)
Users may define:
Start time
End time
Outside this window, no new trades are generated.
🎛️ User Adjustable Inputs
Pivot lookback period
Trendline style and extension
Display of target/stop-loss
Expiry selection mode
Strike-bias
Lot size (for alert formatting only)
Time filter settings
🔔 Alert Messages
Alerts include:
Direction (Long/Short)
Strike details
Option type (CE/PE)
Quantity
A formatted JSON message
TradingView does not execute these orders.
Users are responsible for managing external automation independently.
⚠️ Important Notes
This script does not integrate with any broker by default.
It does not place trades automatically; alerts only send text.
Backtests simulate index movement, not live option pricing.
We recommend using realistic slippage and commission settings.
✔️ This strategy is intended for educational and analytical use. Adjust settings as needed.
✅ 2. CLEAN CHART BEFORE PUBLISHING
To avoid moderator flags:
Do This Before Publishing:
✔ Remove all manual drawings
✔ Hide any other indicators on the chart
✔ Use light or clean background
✔ Keep only signals/SL/TP from your script
If you leave extra drawings, moderators may hide the script again.
✅ 3. FINAL PUBLISHING CHECKLIST
Before you click Publish, verify:
✔ Description matches the one above
✔ No broker names anywhere
✔ No "algo trading" or "automation" advertising
✔ Backtest settings are realistic
Commission enabled
Slippage > 1
Reasonable lot assumption
✔ Chart is clean
✔ Script is set to “Strategy” and compiles without warnings

Seawolf Pivot Hunter [Strategy]Overview
Seawolf Pivot Hunter is a practical trading strategy that enhances the classic pivot-box breakout system with a structured risk-management framework. Using ATR-based stop loss and take-profit calculations, position sizing, multi-layer filtering, and daily loss-limit protection, it provides a stable and sustainable trading environment. It preserves the strengths of the original version while adding systems designed to manage real-market risks more effectively.
Core Philosophy
The most important element in trading is not generating profits but controlling losses. Even the best entry signals cannot compensate for a single large loss that wipes out accumulated gains. This strategy precisely calculates the risk exposure for every trade and includes multiple layers of protection to safeguard the account under worst-case scenarios.
Indicator Setup Link
kr.tradingview.com
Example of Optimal Parameter Settings
Asset (Exchange): ETH/USDT (Binance)
Timeframe: 15-minute chart
Pivot Detection Length: 5
Upper Box Width: 2
Lower Box Width: 2
Enable Risk Management: False
Use Trailing Stop: False
Use Volume Filter
-Min Buy Volume % for Long: 50
-Min Sell Volume % for Short: 50
Use Trend Filter (EMA): False
Enable Max Loss Protection
-Max Daily Loss ($): 200
-Max Trades Per Day: 10
Calculated Bars: 50,000
Risk-Management System
Every trade automatically receives a stop-loss level at the moment of entry. The stop is calculated using ATR, adjusting dynamically to market volatility. When volatility increases, the stop widens; in stable conditions, it tightens to reduce unnecessary exits. The default distance is set to twice the ATR.
The standard take-profit level is set to four times the ATR, providing a 1:2 risk-reward structure. With this ratio, even a 50 percent win rate can produce profitability—while the typical trade structure aims for small losses and larger gains to support long-term performance.
A trailing-stop option is also available. Once the trade moves into profit, the stop level automatically trails behind price action, protecting gains while allowing the position to expand when momentum continues.
Position size is calculated automatically based on the selected risk percentage. For example, with a 2 percent risk setting, each stop-loss hit would result in exactly 2 percent of the account balance being lost. This ensures a consistent risk profile regardless of account size.
The daily loss-limit function prevents excessive drawdown by halting new trades once a predefined loss threshold is reached. This helps avoid emotional decision-making after consecutive losses.
A daily trade-limit feature is included as well. The default is 10 trades per day, protecting traders from overtrading and unnecessary fees.
Filtering System
The volume filter analyzes buying and selling pressure within the pivot box. Long trades are allowed only when buy volume exceeds a specified percentage; shorts require sell-volume dominance. The default threshold is 55 percent.
The trend filter uses an EMA to determine market direction. When price is above the 200-EMA, only long signals are permitted; when below, only shorts are allowed. This ensures alignment with the broader trend and reduces counter-trend risk.
Each filter can be toggled independently. More filters generally reduce trade frequency but improve signal quality.
Real-Time Monitoring
A real-time statistics panel displays daily profit/loss, the number of trades taken, the maximum allowed trades, and whether new trades are currently permitted. When daily limits are reached, the panel provides clear visual warnings.
Entry Logic
A trade is validated only after a pivot-box breakout occurs and all active filters—volume, trend, daily loss limit, and daily trade limit—are satisfied. Position size, stop loss, and take-profit levels are then calculated automatically. Entry arrows and labels on the chart help with later review and analysis.
Setup Guide
Risk percentage is the most critical setting. Beginners should start at 1 percent. Anything above 3 percent becomes aggressive.
ATR stop-loss multipliers should reflect asset volatility.
ATR take-profit multipliers determine reward ratio; 4.0 is the standard.
Volume thresholds are typically set between 50–60 percent depending on market conditions.
Daily loss limits are typically 2–5 percent of the account.
Trading Strategy
This strategy performs best in trending environments and works especially well on the 4-hour and daily charts. New users should begin with all filters enabled and trade conservatively. A minimum of one month of paper trading is recommended before committing real capital.
Suitable Users
The strategy is ideal for beginners who lack risk-management experience as well as advanced traders seeking a customizable structure. It is particularly helpful for traders who struggle with emotional decision-making, as pre-defined limits and rules enforce discipline.
Backtesting Guide
Use at least 2–3 years of historical data that includes bullish, bearish, and sideways conditions.
Target metrics:
Sharpe ratio: 1.5 or higher
Maximum drawdown: below 25 percent
Win rate: 40 percent or higher
Total trades: at least 100 for statistical relevance
Optimization Precautions
Avoid over-fitting parameters. Always test values around the “best” setting to verify stability.
Out-of-sample testing is essential for confirming robustness.
Test across multiple assets and timeframes to ensure consistency.
Live Deployment Roadmap
After successful backtesting, follow a gradual rollout:
Paper trading for at least one month
Small-account live testing
Slow scaling as performance stabilizes
Continuous Improvement
Keep a detailed trading journal and evaluate performance each quarter using recent data.
Adapt settings as market conditions evolve.
Conclusion
Seawolf Pivot Hunter aims to provide more than simple trade signals—it is designed to create a stable and sustainable trading system built on disciplined risk management. No strategy is perfect, and long-term success depends on consistency, patience, and strict adherence to rules. Start small, verify results, and scale progressively.
Disclaimer
This strategy is for educational and research purposes only. Past performance does not guarantee future results. All trading decisions are the responsibility of the user.
개요
Seawolf Pivot Hunter는 기본 피봇 박스 브레이크아웃 전략에 전문적인 리스크 관리 시스템을 더한 실전형 트레이딩 전략입니다. ATR 기반의 손절매와 목표가 설정, 포지션 사이징, 다층 필터링 시스템, 일일 손실 제한 기능을 통해 안정적이고 지속 가능한 트레이딩 환경을 제공합니다. 기본 버전의 장점은 유지하면서 실제 시장에서 발생할 수 있는 위험을 체계적으로 관리할 수 있도록 설계되었습니다.
핵심 철학
트레이딩에서 가장 중요한 것은 수익이 아니라 손실 관리입니다. 아무리 훌륭한 진입 조건이 있어도 한 번의 큰 손실로 모든 수익이 사라질 수 있습니다. 이 전략은 각 거래마다 감수할 리스크를 명확히 계산하고, 최악의 상황에서도 계좌를 보호하기 위한 다양한 안전장치를 제공합니다.
지표 적용 링크 공유
kr.tradingview.com
최적 조건값 설정(예시)
"종목(거래소): ETH/USDT(Binance)", "15 분봉 기준"
-Pivot Detection Length: 5
-Upper Box width: 2
-Lower Box width: 2
-Enable Risk Management: False
-Use Trailing Stop: False
-Use Volume Filter
-Min Buy Volume % for Long: 50
-Min Buy Volume % for Long: 50
-Use Trend Filter(EMA): False
-Enable Max Loss Protection
-Max Daily Loss($): 200
-Max Trades Per Day: 10
-Calucated bars: 50000
리스크 관리 시스템
모든 거래는 진입과 동시에 손절매 주문이 자동 설정됩니다. 손절가는 ATR을 기준으로 계산되며, 시장의 변동성에 따라 자동으로 조정됩니다. 변동성이 큰 시장에서는 넓은 손절폭을, 안정적인 시장에서는 좁은 손절폭을 사용해 불필요한 청산을 줄입니다. 기본값은 ATR의 2배입니다.
목표가는 ATR의 4배를 기본값으로 설정하여 손익비 1:2 구조를 유지합니다. 승률이 50퍼센트만 되어도 수익성이 가능하며, 실제로는 손절은 짧고 이익은 길게 가져가는 방식으로 장기 성과를 확보합니다.
트레일링 스톱 기능도 제공됩니다. 포지션이 수익 구간에 들어서면 손절가가 자동으로 함께 움직이며 수익을 보호합니다. 이 기능은 사용자가 켜거나 끌 수 있습니다.
포지션 크기는 리스크 퍼센트 기반으로 자동 계산됩니다. 예를 들어 리스크를 2퍼센트로 설정하면 손절 시 계좌 자산의 2퍼센트만 잃도록 수량이 조절됩니다. 계좌 크기와 무관하게 항상 일정한 비율의 리스크만 감수하게 되는 방식입니다.
일일 손실 제한 기능은 하루에 허용 가능한 최대 손실을 초과하지 않도록 합니다. 지정 금액에 도달하면 당일 거래는 더 이상 실행되지 않습니다. 감정적 거래를 막고 일정한 규율을 유지하도록 돕습니다.
일일 거래 횟수 제한 기능도 제공됩니다. 기본값은 하루 10회로, 과매매와 수수료 증가를 방지합니다.
필터링 시스템
볼륨 필터는 박스 구간 내 매수·매도 압력을 분석해 진입 신호를 검증합니다. 롱은 매수 볼륨이 일정 비율 이상일 때, 숏은 매도 볼륨이 우세할 때만 진입합니다. 기본값은 55퍼센트입니다.
추세 필터는 EMA를 사용하며, 가격이 200EMA 위에 있을 때는 롱 신호만, 아래에서는 숏 신호만 허용합니다. 큰 추세 방향에만 거래하여 역추세 리스크를 줄입니다.
필터는 독립적으로 켜고 끌 수 있으며, 필터가 많을수록 거래 횟수는 줄지만 신호 품질은 향상됩니다.
실시간 모니터링
화면에 실시간 통계 테이블이 표시되며, 일일 손익, 거래 횟수, 최대 허용 횟수, 현재 거래 가능 여부가 즉시 확인됩니다. 손실 제한 또는 거래 제한 도달 시 시각적으로 표시됩니다.
진입 로직
피봇 박스 브레이크아웃 발생 후 볼륨 필터, 추세 필터, 일일 손실·거래 제한을 모두 통과하면 포지션 크기를 계산하고 손절·목표가를 설정한 뒤 진입합니다. 진입 지점에는 화살표와 레이블이 표시되어 분석에 도움을 줍니다.
설정 가이드
리스크 퍼센트는 가장 중요한 설정입니다. 초보자는 1퍼센트를 추천하며 3퍼센트 이상은 위험합니다.
손절 ATR 배수는 자산 특성에 맞게 조절합니다.
목표가 ATR 배수는 손익비를 결정하며 기본값은 4.0입니다.
볼륨 비율은 시장 상황에 따라 50~60퍼센트 내외로 조정합니다.
일일 손실 제한은 계좌의 2~5퍼센트 수준이 적절합니다.
사용 전략
추세가 명확한 시장에서 가장 효과적이며, 4시간봉 또는 일봉을 추천합니다. 초반에는 모든 필터를 켜고 보수적으로 시작하며, 최소 한 달간 페이퍼 트레이딩을 권장합니다.
적합한 사용자
리스크 관리 경험이 부족한 초보자부터, 커스터마이징을 원하는 경험자까지 폭넓게 적합합니다. 감정적 트레이딩을 억제하는 기능이 있어 규율 유지가 어렵던 트레이더에게 특히 유용합니다.
백테스트 가이드
최소 2~3년 데이터로 테스트하며, 상승·하락·횡보 모두 포함해야 합니다.
샤프비율 1.5 이상, 최대 낙폭 25퍼센트 이하를 목표로 합니다.
승률은 40퍼센트 이상이면 충분합니다.
최소 100회 이상 거래가 있어야 통계적으로 의미가 있습니다.
최적화 주의사항
과최적화를 피하고 주변 값도 테스트해야 합니다.
샘플 외 기간 검증은 필수입니다.
여러 자산·여러 시간대에서 테스트하여 일관성을 확인해야 합니다.
실전 적용 로드맵
백테스트 후 바로 실전 투입하지 말고, 한 달 이상의 페이퍼 트레이딩 → 소액 실전 → 점진적 확대 순으로 진행합니다.
지속적 개선
일지를 기록하고 분기마다 최신 데이터로 점검합니다.
시장 변화에 따라 유연하게 조정해야 합니다.
마치며
Seawolf Pivot Hunter는 단순 신호 제공을 넘어, 안전하고 지속 가능한 트레이딩 환경 구축을 목표로 합니다. 어떤 전략도 완벽할 수 없으며, 장기적 성공을 위해서는 규칙 준수와 인내가 가장 중요합니다. 충분한 검증을 거쳐 작은 금액으로 시작하고 점진적으로 확장해나가는 접근을 추천합니다.
면책 조항
이 전략은 교육 및 연구 목적이며, 과거 성과는 미래를 보장하지 않습니다. 모든 투자 결정은 본인의 판단과 책임 하에 이루어져야 합니다.

CongTrader Strategy V1📈 CongTrader Strategy V1 — Official Overview
CongTrader Strategy V1 is a precision-built algorithm designed for intraday and swing traders who want a structured, rules-driven approach to capturing directional momentum while avoiding low-quality market conditions.
This strategy combines volatility-based logic, trend confirmation filters, and a market-conditioning engine to produce high-probability long and short signals with strictly candle-close confirmed entries (no intrabar repainting).
🔍 Core Philosophy
Modern markets move in bursts of volatility that are often preceded by subtle shifts in momentum and structure.
CongTrader V1 is engineered to:
identify emerging directional pressure early
filter out noise, consolidation, and choppy environments
only execute when multiple conditions align
maintain consistent, disciplined trade management
The result is a strategy that aims to trade quality over quantity, focusing on clear, structured setups rather than impulsive, intrabar signals.
🧠 Key Components (High-Level Explanation)
1️⃣ Directional Signal Engine (Trigger System)
The strategy uses a custom momentum-oscillation model to detect potential turning points and trend continuations.
This engine smooths price action, measures pressure extremes, and generates trigger crossovers that signal potential long or short opportunities.
(The exact formula and coefficients are proprietary and not displayed.)
2️⃣ ATR-Based Risk Management
Each trade is automatically paired with:
a volatility-adaptive stop loss, and
a volatility-adaptive profit target
This allows the strategy to adjust position management dynamically based on current market movement rather than fixed pip or dollar distances.
3️⃣ Trend Confirmation Filter (EMA)
A long-term EMA trend filter prevents counter-trend entries by ensuring:
Long positions trade only above trend
Short positions trade only below trend
This keeps signals aligned with higher-timeframe momentum.
4️⃣ VWAP Institutional Bias Filter
VWAP is used as a dynamic market fair-value reference.
The strategy only trades when price action shows favorable positioning relative to VWAP—helping avoid false moves and mean-reversion traps.
5️⃣ Range & Volatility Filter
A volatility/range filter avoids entering during tight consolidations.
If the market is not moving or lacks range expansion, the strategy waits patiently.
This significantly reduces chop and whipsaw trades.
6️⃣ RTH (Regular Trading Hours) Protection
Optionally limits trades to regular exchange hours for traders who avoid low-liquidity overnight sessions.
⏳ Candle-Close Entry Confirmation (No Repainting)
All entries are strictly confirmed after the bar closes, which means:
No intrabar fakeouts
No signal disappearance
No repainting
Cleaner, more realistic backtesting
This ensures the strategy behaves the same in backtests and in live charts.
🎯 Trade Logic Summary
A trade is only taken when:
✔ A directional trigger signal occurs
✔ Price meets VWAP bias conditions
✔ Price aligns with the long-term trend
✔ Sufficient volatility/range is present
✔ (Optional) Within regular trading hours
✔ The candle has fully confirmed
Every trade is managed automatically with ATR-based stop loss and take profit placement.
📊 Who This Strategy Is For
CongTrader V1 works well for:
Intraday traders (1–15m)
Swing traders (30m–4h)
Momentum and trend-followers
Algorithmic traders looking for disciplined, rules-based entries
Traders who want cleaner signals and less noise
Anyone who wants to avoid low-quality, choppy markets
🔔 Alerts Included
Built-in alerts notify you instantly when conditions for long or short entries are met, making it suitable for:
Manual execution
Automated trading systems
Signal services
🧩 Important Note
This strategy is designed for educational purposes and is not financial advice. Performance may vary depending on market conditions, broker feed, and instrument volatility. Always backtest thoroughly and use risk management.

Cognex Fibonacci Breakout StrategyTHE COMPLETE TRADE LOGIC (What We Want):
Step 1: Morning Session (9:30-10:30)
Track session high and low
Step 2: After 10:30 - Wait for Breakout
Bullish: Close above session high
Bearish: Close below session low
Step 3: Track Extreme After Breakout
Keep updating highest_after_breakout or lowest_after_breakout
This continuously updates as price makes new extremes
Step 4: Detect 28% Retracement (THE LOCK)
When price retraces to 28%, set last_extreme_for_retracement to the current extreme
This LOCKS the extreme for fibonacci calculations
fib_100 should use this locked value
Step 5: Place Limit Order EARLY (at 20% retracement)
When price retraces to 20%, place limit order at 28% entry
This is so the order is ready when price hits 28%
Step 6: Cancel & Recalculate if New Extreme
If price makes a NEW extreme AFTER the order is placed
Cancel the old order
Wait for new 20% retracement to place new order
Step 7: One Trade Per Day
Only ONE order placement attempt per day
Even if cancelled, don't try again
