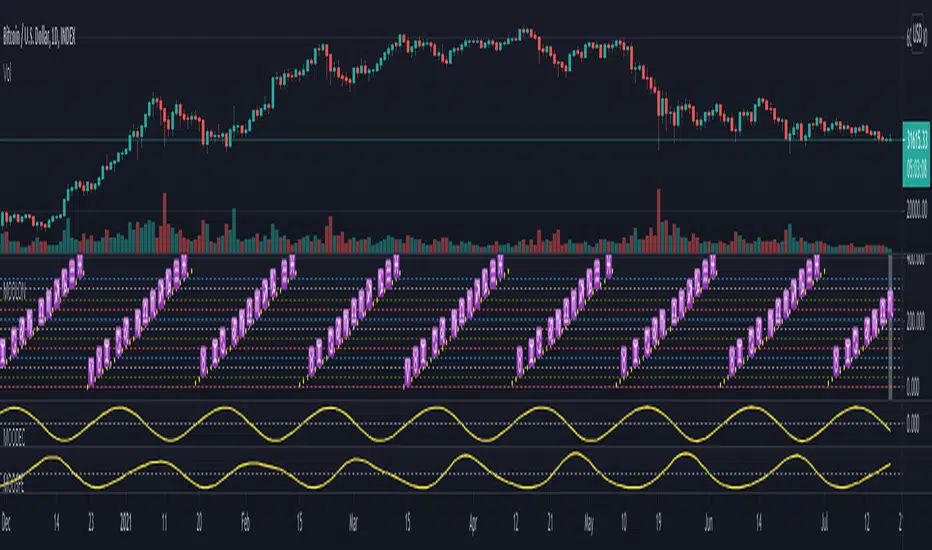
Financial Astrology Moon LongitudeMoon energy represent the masses, crowds, public places, children and emotions. The transit of the Moon through the zodiacal signs will color the crowd emotional responses that fluctuate based on the elemental qualities of the signs: fire (energetic and impulsive), earth (rigid, static, patient), water (assimilation, transformation, humor fluctuations), air (expansion, fervent, germination).
The daily average speed of the Moon is 13 degrees, for this reason the emotional elemental energy is transforming in average every 2 days and few hours, this mood fluctuations produces the short term instinctive and emotional actions performed by traders that forget the precise mathematical / statistical approach in favor of irrational and emotional impulses.
Based on statistical buy/sell frequency analysis we discovered that for BTC-USD, the Moon is usually bullish in zodiac signs: Aries, Libra, Scorpio, Aquarius and Pisces, the most relevant bullish sign is "Aquarius", from 206 observations in all the BTC-USD price history where Moon was in this sign the 60% of those days the price increased compared to the previous day. The bearish zodiac signs for BTC-USD are: Taurus, Cancer, Leo, Sagittarius and Capricorn, the most relevant bearish sign is "Capricorn".
Interestingly this zodiac sign locations tends to fluctuate during some periods of time and from the last 10 observations of the Moon transiting through Aries we noted that 7 of the 10 observations coincide with a dip, sometimes the Moon in Aries indicate the reversal of the short term trend, this is kind of expected considering that when Moon approaches Taurus the fall becomes more likely due to the fact that Moon in Taurus is a bearish signal.
With this indicator there is unlimited possibilities to explore across different markets and complementing with Moon phases this may be the perfect financial astrology indicator for those intraday traders that keep positions only for few hours.
We encourage you to analyze the Moon zodiac sign cycles in different markets and share with us your observations, leave us a comment with your research outcomes. Happy trading!
Note: The Moon longitude indicator is based on an ephemeris array that covers years 2010 to 2030, prior or after this years the longitude is not available, this daily ephemeris are based on UTC time so in order to align properly with the price bars times you should set UTC as your chart reference timezone.
סחורות
NPetro V10.12 for CL, ZL and ZC (Delayed Graph)NPetro V10.12
There are 6 key point in this indicator which are :-
•Lines
•Ticks Status
•Volume Strength
•ACV+ & Arrows
•Gap Remover
•Entry Point
Lines
There are 5 lines that represent Support and Resistant as the guidance in determining market direction.
Purple line, Blue line, Green line, Yellow line and Bollinger band line.
•Purple line represent volume base SnR .
•Blue line represent short term SnR .
•Green line represent long term SnR .
•Yellow line represent current market movement.
•Bollinger Band is to identify sideway market.
Ticks status
Ticks status is a status label that shows todays movement from the lowest and movement from the highest
•Going Up - total movement from the lowest of the day to current price.
•Going Down - total movement from the highest of the day to current price.
Volume Strength
Strong Volume Strength is shown as Purple or Blue candle.
•Purple Candle - shows strong volume pushing the price down.
•Blue Candle - shows strong volume pushing the price up.
ACV+ & Arrows
Accumulated Volume + is a tools that combine Relative Strength of volume and price together to evaluate Overbought and Oversold conditions.
•Purple Arrow - Displayed when Purple candle appeared and Relative Strength of volume changes in ACV+ move above Overbought value.
•Blue Arrow - Displayed when Blue candle appeared and Relative Strength of volume changes in ACV+ move below Oversold value.
Recommended Timeframe
TF 3min (Confirmation TF)

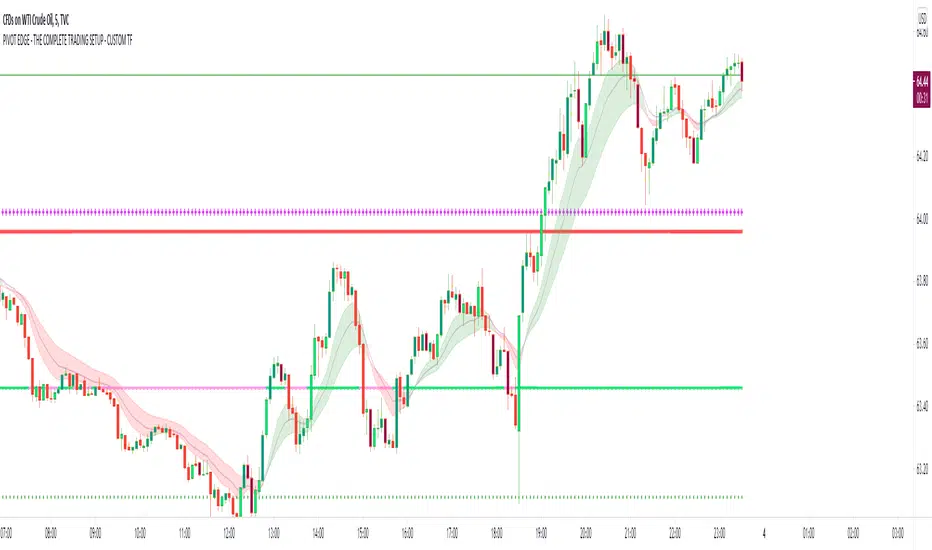
PIVOT EDGE - THE COMPLETE TRADING SETUP - CUSTOM TFIntroduction to the Indicator " PIVOT EDGE - The complete trading setup - CUSTOM TF " It means custom timeframe
The Foundation layout for this indicator is based on PIVOT's which are nothing but the most important levels that the price has respected in the past. The values for the pivots are derived from the key attributes of the price in any timeframe such as the OPEN, HIGH, LOW and CLOSE. These define the mood of the price and where it intends to move in relation to the previous range formed. Earlier HIGH - LOW i.e the RANGE indicates the possible movement that a stock can make in the current session and as per the calculated pivots we can possible find out the tentative supports and resistances. In addition to this indicator, It is advisable to use the price action theory which helps in taking a right decision for entries.
This indicator by itself is complete in nature, i.e it guides the user for possible entry levels and the projected targets that we can achieve and also the likely stop loss limit in case the price reverses. So beforehand even before entering into a trade position, the user can ascertain what can be his loss or max profit and then he can chose an optimum position size for favorable results.
The beauty of this Indicator lies in the fact that it can be used for all types of trading like Scalping, Intra day, Swing or Positional and Investments also. It works on all timeframes and across all market segments like EQUITY, COMMODITIES , FUTURES , OPTIONS , FOREX etc.
This indicator can be used for any exchange and any time zone also without any changes or adjustments needed.
Now let us understand the features of this Indicator in detail.
TIMEFRAME - It has options to choose between Day, week and month as timeframe. By default it is set to Day timeframe
DISPLAY MAJOR LEVELS - These are the important support and resistance levels calculated based on the past price data. Most important ones are marked in BOLD RED and BOLD GREEN between which the price tends to move generally.
Apart from these, We have breakout level marked in light green and if price breaks this level we can expect targets upto extended levels and beyond marked in blue.
we also have breakdown level marked in light red and if price breaks this level we can expect targets down up to extended levels and below it marked in blue.
In addition I have coded intermediate target levels that appear in light gray between the extended levels or blue lines. Sometimes when the gap between these targets are huge, price cannot reach the targets and reverses at these intermediate targets. You can use them as targets or trailing stop loss based on your plan
DISPLAY HIDDEN LEVELS - These levels are intermediate supports and resistances that can be used whenever the present day indicated range is very wide. Whenever we have an explosive moments in market the range of that day is very huge and so he next day support and resistance band becomes very wide indicating the sideways movement day within that range. And on those days we can switch on the hidden levels and the price respects these levels and most of the days it is inside this range only.
DISPLAY PREVIOUS HIGH / LOW / CLOSE - I have included Daily / Weekly and monthly levels. It is important to know the earlier highs / lows and close since price respects it very must just like support and resistance .
PEMA - This is an important EMA based indicator which potentially indicates curves of support and resistance during retracements or pullbacks. If the curves are breached then the trend is reversed and the price will tend to move to the next pivots .
IMPORTANT NOTE : This indicator does not guarantee any favorable results nor protect your from any loss. You own the complete risk of your trades. It is suggested that you use this indicator and do back testing for considerable period to understand how it works the the potential win rate it can give. If you have any doubts or need any clarifications of assistance in understanding, you can message me and I will try to help.
Happy and Safe trading - Mohan from PIVOT EDGE
Swing or scalping GOLD [RickAtwood] Swing or scalping - automatically determine the currently active trends. Various moving averages are used. It is also designed for any type of trader from scalping to swing.
The key 3 moving averages are designed to identify support and resistance. If the price bounces off them, boldly open and place a stop of 10-20 pips(currency pairs)
Functional
buy ---> green candles
sell ----> red candles
There are alerts for buy and sell based on crossovers
If the price is above the cloud then buy. If the price is below the cloud then sell. The main thing is to open deals only at the very beginning when the price starts to leave the cloud. Also, your stops will be minimal.
When testing this system, we opened 750 trades manually. Success rate of 71% for currency pairs and for gold
P.s If you have any questions about how to open, how to close deals. Always write to me, I will help you) Success to all.

T3 Gold Sniper [RickAtw]Gold Sniper based on support and resistance looks for a sniper entry for trades. Used together with EMA
Key signal
Buy ------> Green Line
Sell ------> Red Line
Functional
The system was made for gold and everything is tuned for it.
I am a professional investor and I test each system for how long. If the system makes an income, it gets to my page. Use it for gold, cryptocurrencies and pairs AUD/USD GBP/USD
Full CRYPTO pack macd, rsi, obv, ema alert versionThis is the indicator version of a simple, yet very efficient crypto strategy, adapted to 4h time frame, on big coins like ETH and BTC . However it can be adapted to other markets, timeframes etc
For this strategy I use a combination of a trend line , an oscillator, price action and volume .
This study has alert for both long and short entries/exit.
The rules are the next ones:
Long : we check that current candle is ascending and above the moving average, the macd is in positive range, rsi is below overbought level and volume is bigger than the moving avg of volume .
For short, we have the opposite long rules.
If you have any questions, please let me know !

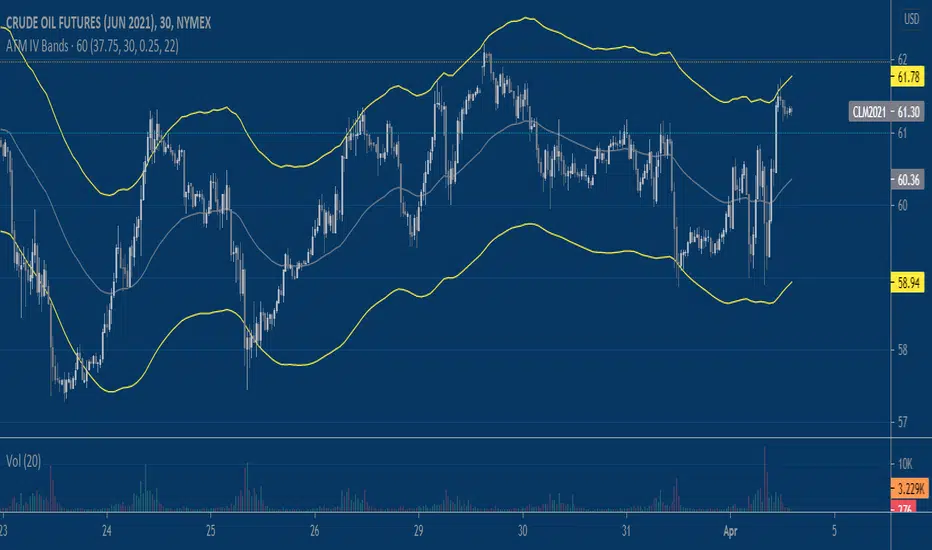
Implied Volatility BandsThis script produces price bands around an EMA based on a manually inputted Implied Volatility. The idea builds on my previous "Implied Move" script which helps visualize the distribution of prices that the market is 'pricing in' via options/implied volatility. It's up to the user to determine the implied volatility level they use, I like using the free version of QuikStrike that you can access via the CME Group website and then update the script's input daily. Another way to use the script is to input the implied volatility based on a forecast that you produce independently. Say implied volatility on June 2021 Crude Oil is 30% and you think it's rich by 2%, you can input 28% into the script to tweak the bands for a declining vol regime.
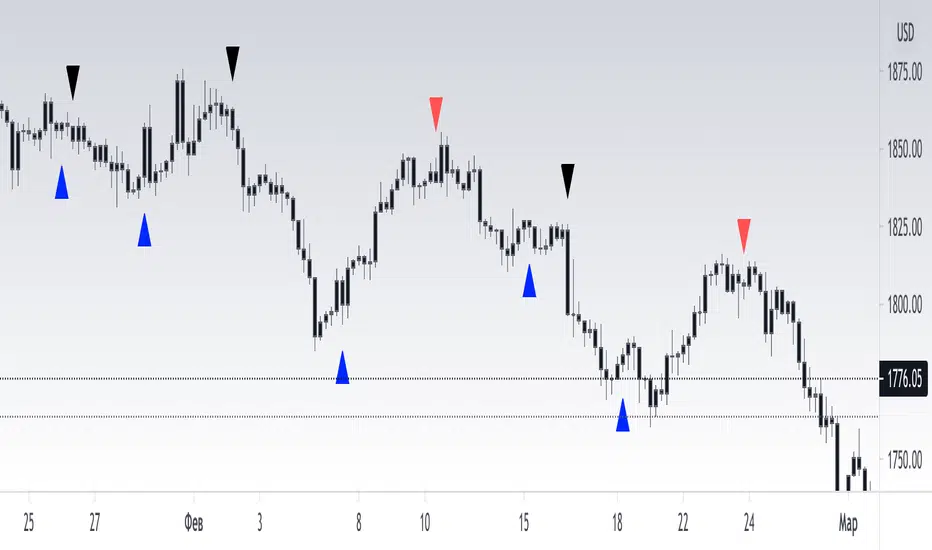
[RickAtw] T2 Trend Signal GOLDTrend gold signal Ema strategy
The system finds the best entries for a trade. Use in gold, all numbers have been customized for it.
Functional
T2 trend gold is the second version of my trading system. Be sure to check out the first part! This system gives a signal earlier.
Key signals
Buy -----> Blue triangle to buy
Sell -----> Red triangle to sell
Remarks
I personally tested this system on my own trading and it helps me find entries for deals. The main thing is, if consolidation has begun, turn off the system, because the trading range is small at this moment, use oscillators
Thanks to everyone who supports me. Good luck to you friends
MasterChartsTrading Price Action Indicators-6.0These are upgraded MasterChartsTrading Price Action Indicators with future projections
---
How to understand price action.
It is very easy to read price action if you have a reference point. These support/resistance lines are there to help you read where the buyers and sellers are likely to make a stand.
You can also think of these indicators as moving pivot points .
MasterChartsTrading Price Action Indicators show good price levels to enter or exit a trade.
The Blue indicator line serves as a Bullish Trend setter.
If your instrument closes above the Blue line, we think about going Long (buying).
For commodities and Forex, when your trading instrument closes below the Red line, we think about Shorting (selling).
For Stocks, I prefer to use the Yellow line as my Bearish Trend setter (on Daily charts ). A stock has to close below the Yellow line first, then rally towards the Red line and top out there. This is where I would short it.

[astropark] Volume AnalyzerDear Followers,
today another awesome Analysis Tool, that you can use for day scalping: Volume Analyzer !
This indicator
works on every market, pair and timeframe
lets you see analysis of a different timeframes using the resolution parameter
has an optional trend colored background (I suggest to disable it if you use a different resolution)
integrates a tape profit strategy based on RSI (you can config it and enable/disable it)
lets you setup alarms on bull/bear signal as well as on TP RSI-based signals
I prefer to use this indicator in my day trading on low timeframes , like 5m - 15m - 1h, as you can have access to a more detailed volume information, but it works on high timeframes too as you can see in examples at the bottom of the description.
I truly think that Volume says a lot about future price action, as stated in my Cumulative Volume Delta (CVD) indicator, which you can find here below:
In this indicator, I'm much more interested in the bullish or bearish effect of volume generated by traders and following price action.
Be sure to understand that at current status this is not a complete automated strategy, but an analysis tool which aims to give you a positive bias, a profitable hedge in your trading journey.
As I always say, all tools are great if you use them correctly: this is not the "Holy Grail", so always use proper money and risk management strategies.
This indicator quite often calls bottoms and tops , most of the times it announces a coming reversals , sometimes it fails too of course.
Check this screenshot to have a clear idea of what I'm talking about:
You are supposed to discard signals of the same type that comes later and at a worse price (related to the trend) or you can use to re-fill your still-open position, using it as a re-entry.
You are supposed to act at first signals and average up/down if price goes against you when a new bear/bull signal appears at a better price.
Here it is another element you must consider: price action can deny a reversal stated by volume analysis .
In these cases, you must apply a stop loss in your trade and reverse your position. Don't average up/down your entry.
The reason in this screenshot below:
As you can see, the local downtrend was broken, as it was a simple pullback, previous bull trend was restored and price went up a lot!
The indicator here detected bears rejecting the run-up as much violently as they could, but that was a pullback, nothing more than that: main bull trend was still intact.
Another important advice: don't be greedy, always remember to take profits ! Avoid turning a winning trade into a losing one, which is a common mistake traders do.
That's why I decided to include an RSI based Take Profit algorithm inside:
when background is colored by green (and you can't see any bull signal), then you are in over bought region: start taking profits on you buy/long position or close it or set a trailing stop or a stop loss in profit!
when background is colored by red (and you can't see any bear signal), then you are in over sold region: start taking profits on you sell/short position or close it or set a trailing stop or a stop loss in profit!
when price is in a big overbought or oversold region, then you can see a "ob" label or a "os" label respectively
if you are in a bullish trend (you can see it from the trend colored green background as last signal was a "bull" one), "ob" becomes a clear "tp" - Take Profit advice
if you are in a bearish trend (you can see it from the trend colored red background as last signal was a "bear" one), "os" becomes a clear "tp" - Take Profit advice
Here some examples how you can use the signals produced by the indicator in order to be a successful trader.
I circled with pink signals you as supposed to take, then with a "$" pink backgrounded region where you are supposed to take profits, I finally put an X on failing signals, where you would theoretically have been stopped-out.
GBPUSD, 15m
ETHUSD, 1h
TSLA, 5m
BTCUSD, 15m
XAGUSD, 1h
EURUSD, 15m
SPX500, 1h
ETHUSD, 1D
ETHBTC, 6h
This is a premium indicator , so send me a private message in order to get access to this script.

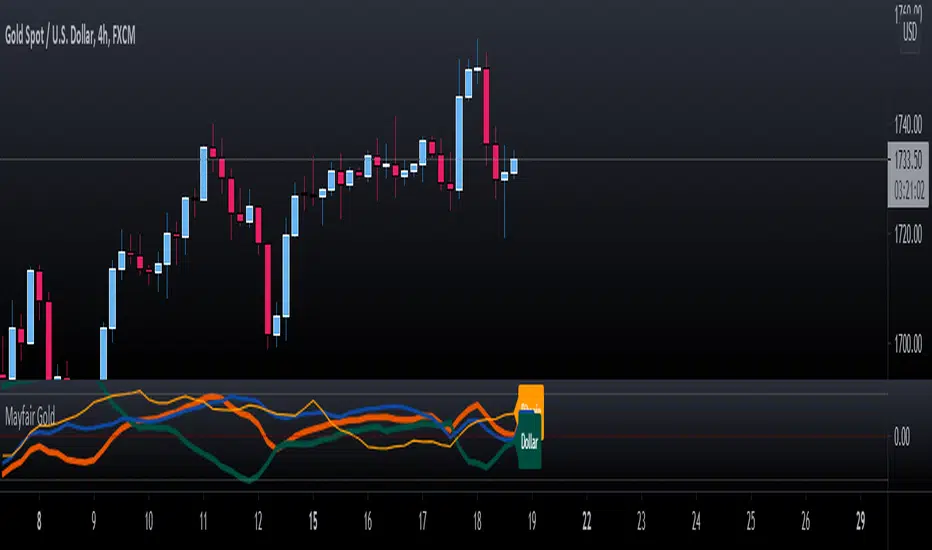
Mayfair GoldGold Oscillator using SPX & DXY to measure the moving average cross of the 3.
Gold in Orange
DXY in Green
SPX in Blue
To use this indicator, you need to see the strength (Orange above the 50%) line, use your own configurations and settings for the two MA's as a cross.
The idea is not to enter trades but to know when either SPX or/and DXY is getting stronger or weaker to help with profit-taking of gold positions.
As per any Oscillator - look for patterns, cross-overs and momentum shifts. (Treat like a MACD, RSI or Stochastic).

Rate ConverterThis is a simple rate converter that can convert almost anything into almost anything else. It supports cryptocurrencies, currencies and most commodities.
On the chart we see the following:
USD (US Dollar) into EUR (Euro) as a candle stick chart
WTICO (West Texas Intermediate Crude Oil) into ISK (Icelandic Krona) as a bar chart
ADA (Cardano) into JMD (Jamaican Dollar) as a line chart
XPT (Platinum) into XAG (Silver) as a scatter plot
It supports plotting the rates as japanese candlesticks, bars, lines, or as a scatter plot.

[astropark] Fast Supply Demand Order Blocks FinderDear Followers,
today another awesome Analysis Tool, that you can use both for Swing and Scalping Trading: Fast Supply Demand Order Blocks Finder !
Every time it finds a bullish Order Block (Demand) or a bearish OB (Supply), it shows it immediatelly and when the OB is touched by price, an alert is triggered and a circle is displayed.
Keep in mind that trading Supply and Demand is quite easy:
short/sell at Supply (Bearish OB)
long/buy at Demand (Bullish OB)
short/sell if Demand (Bullish OB) gets broken
long/buy if Supply (Bearish OB) gets broken
This indicator has the resolution option , so you can checkout higher timeframes OBs, whatever timeframe you are.
Also you can refine the OBs finder algo fine tuning some filter options or you can just disable them all.
The indicator keeps track of all previous historic Supplies and Demands , but if too much are shown and you don't like it, you can just cut them by defining a specifc Analysis Starting Date/Time using the specific input options in the indicator settings.
Optionally you can also change lines' color and width, as well as enable/disable the OB hits circles.
Here below you can see some charts that shows how the indicator works on many timeframes, resolutions and markets.
XAUUSD 1h, using 6h resolution - part 1
XAUUSD 1h, using 6h resolution - part 2
XAUUSD 1h, using 6h resolution - part 3
BTCUSD 1h, without using resolution
EURUSD 5m, using 30m resolution
SPX500 5m, using 30m resolution
As I always says, all tools are great if you use them correctly: this is not the "Holy Grail", so always use proper money and risk management strategies.
This is a premium indicator , so send me a private message in order to get access to this script.

[astropark] Trend Skywalker V1 [alarms]Dear Followers,
today another awesome Swing and Scalping Trading Strategy indicator: Trend Skywalker !
It shows a trend cloud that reacts very fast to price action, so it's perfect for trending markets: it helps a lot to find out
when a trend is going to end and a new is going to start
when to enter again within a trending market
where to put your stoploss
In this example below you can see the three points above:
In fact in a trending market it will highlight that:
price consolidation within the could is a trend weakening signal , so you can easily spot when a trend is going to end and a new is going to start
bullish/bearish trend cloud retests are nice opportunity to re-enter within a trending market, especially if cloud is thick
where to put your stoploss ( below the cloud and/or recent low in a buy scenario , above the cloud and/or recent high in a sell scenario )
This strategy/indicator has the following options:
change analysis window (the lower, the more reactive; the higher, the less reactive)
enable/disable signals on chart
enable/disable "more confirmations" signals filter
enable/disable bars and background coloring based on trend
enable/disable an automatic Trailing Stop strategy option (Automatic Stops)
enable/disable a peak profit tracker (the max percentage profit labels)
enable/disable highlights of trend cloud retests
enable/disable highlights of trend cloud price breakouts
Here below some examples how the indicator works on many markets and timeframe.
ETH/USD 4h
EUR/USD 15m
LTC/BTC 1h
This strategy only trigger 1 buy (where to start a long trade) or 1 sell (for short trade).
Keep in mind that proper risk management and money management strategies are very important to manage your trades (DM me if you need any clarification on these points).
This script will let you set all notifications you may need in order to be alerted on each triggered signals.
The one for backtesting purpose can be found by searching for the astropark's "Trend Skywalker" and then choosing the indicator with "strategy" suffix in the name, or you can find here below:
This is a premium indicator , so send me a private message in order to get access to this script.

MACD Crossover with signalsMACD Crossover with signals - a simple trading indicator based on classic MACD.
It shows crossovers and plots them on chart as "Long" or "Short".
The MACD itself is not plotted in order to keep your charts cleaner.
By default, all the crossovers are displayed on the chart.
However, you can use only trend-based ones. They are filtered according to the trend (which is plotted and colored using 200 period EMA) and the "zero-line rule" of the MACD.
So if you consider using only trend-based signals, the indicator will only show Long signals on an uptrend and Short signals on a downtrend.
All signals/lines can be turned on/off and styled in the settings menu.
It can be used with all major timeframes and assets (crypto, fx, cfd, stocks, commodities etc).
Consider using it with respect to your trading style, money- and risk-management as well as other strategies and indicators.
If it was useful for you – hit the Like button and share it with your friends - it's free 😉

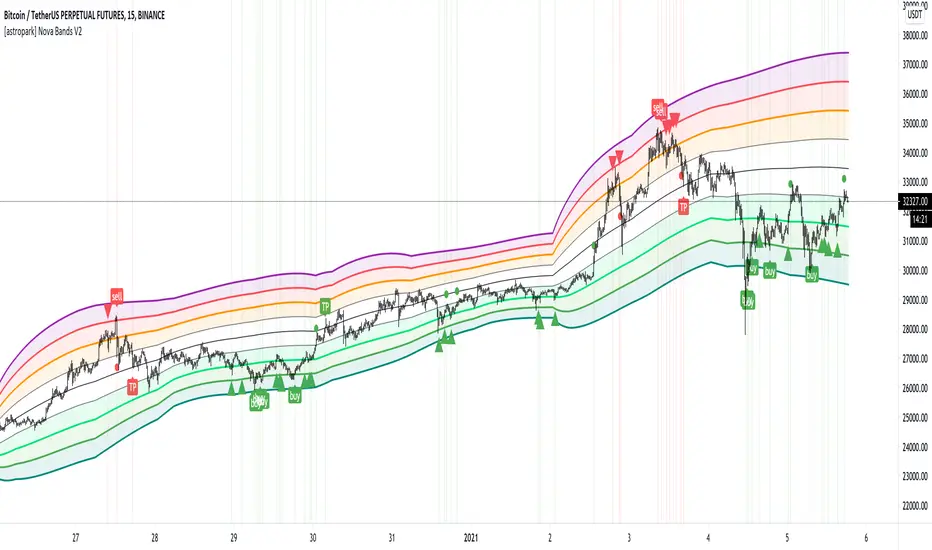
[astropark] Nova Bands V2Dear followers,
today an upgraded version of Nova Bands indicator, here below the previous V1
This is a great analysis and scalping tool for day trading on low timeframes (5-15 minutes) or to plan swing trades on hourly timeframes. It can be used also on high timeframes just for analysis current market trend.
The indicator plots a series of levels which create a nice bands flow.
The slope of levels make you easily understand when price is in consolidation, in uptrend or in downtrend.
The golden rule is always the same: buy low and sell high .
This indicator plots:
3 "price is low here" levels (from dark green to light green)
3 "price is average here" levels
3 "price is high here" levels (from purple to orange)
You can find more details on how to use the indicator in the description of V1.
Please, always remember that:
when bands are flat, price is in consolidation and this is best condition to trade with nova bands
when bands get nearer and nearer is called "Bands Squeeze": price is next to a main breakout move, volatility is coming!
The basic improvement in V2 is a different way to calculate the bands based on different timeframe resolution, default is setup to daily timeframe for example.
A trader who wants to be a winner must understand that money and risk management are very important, so manage your position size and always have a stop loss in your trades.
This is a premium indicator , so send me a private message in order to get access to this script.
gold price levels denominated in usd/gramsPlots the gold price (USD) for the quantities (grams) identified as support or resistance in the indicator settings. Default values are:
75 gold grams
300 gold grams
500 gold grams
1000 gold grams
5000 gold grams
More context: The purchasing power of Bitcoin

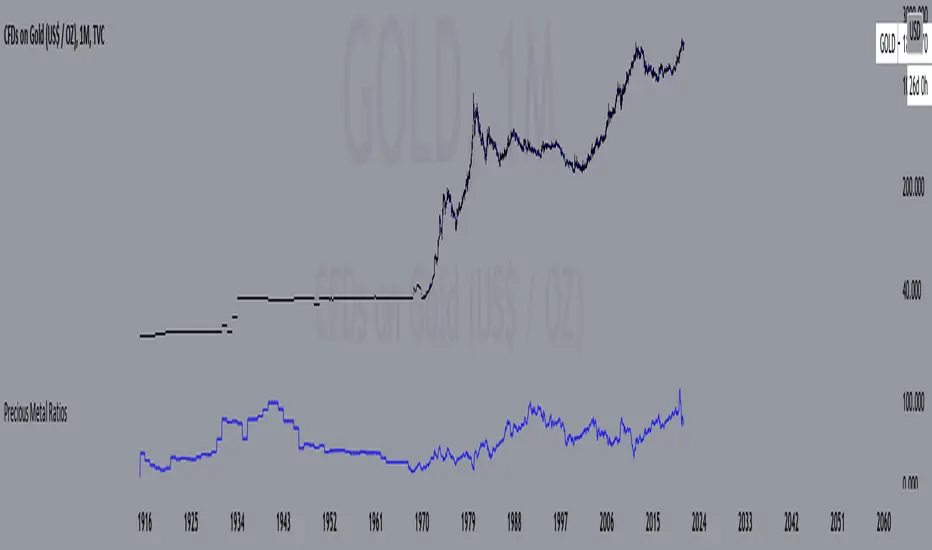
Precious Metal RatiosThis is a script that shows the ratios of precious metals, including Gold, Silver, Platinum, Palladium, Copper, Aluminum, and Steel.
You can choose your desired base currency and quote currency. The default ratio is Gold/Silver, where Gold is the base currency and Silver is the quote.
To use, just select your current timeframe from the menu.
Includes an option for repainting -- default value is true, meaning the script will repaint the current bar.
False = Not Repainting = Value for the current bar is not repainted, but all past values are offset by 1 bar.
True = Repainting = Value for the current bar is repainted, but all past values are correct and not offset by 1 bar.
In both cases, all of the historical values are correct, it is just a matter of whether you prefer the current bar to be realistically painted and the historical bars offset by 1, or the current bar to be repainted and the historical data to match their respective price bars.
As explained by TradingView,`f_security()` is for coders who want to offer their users a repainting/no-repainting version of the HTF data.
BE - Volume v2.8Volume´s Indicator Draft
Intend to determinate the volume strengh (whales movements) for comodities and forex
Defaults Set for a regular Volume indicator
Not so Obvious Inputs...
AV = Absolute values (if not, show as negatives, weak´s vol movements)
MA Source = Volume, Positive Vol, Negative Vol. (Identifies Upcommings Price changes)
As already said..
Its a Draft, comments will be appreciated

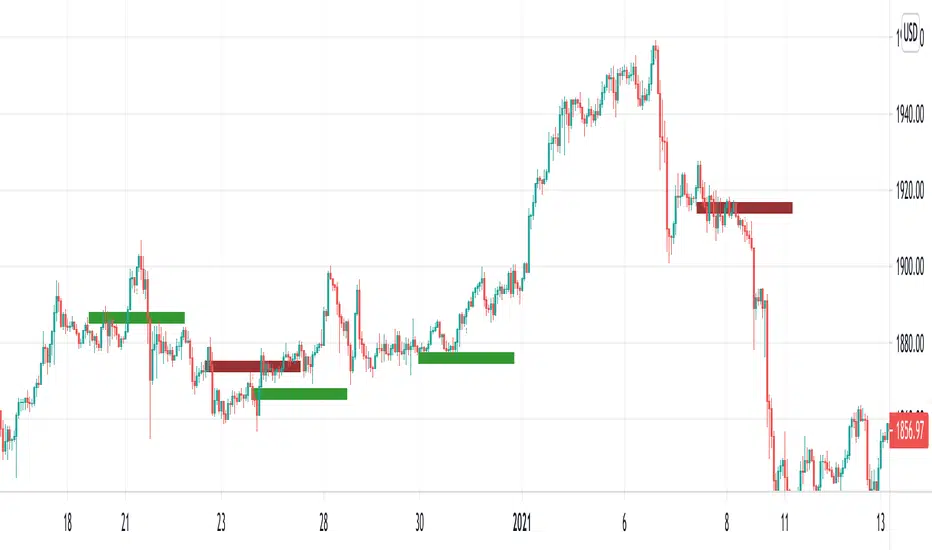
Buy/Sell ZonesEN:
This indicator is made to display main buy/sell zones of an asset. The core parameters are: Price, Volume and Donchian Channels.
It is more trend-based and may be suitable for swing traders or those who trade higher timeframes (1D and above).
The plotted colors display the dominance of buyers, sellers or indecision on the market at the current timeframe.
If the zone is green - consider opening Long/Buy positions.
If the zone is red - consider opening Short/Sell or scale out your position.
The white zone displays indecision between Bulls and Bears - consider not to take any trades within white zone.
RU:
Этот индикатор показывает зоны покупателя/продавца выбранного актива. Основные параметры расчета: Цена, Объем и Каналы Дончиана.
Он является индикатором трендового анализа и больше подходит для свинг-трейдеров или тех, кто торгует на старших таймфреймах (от 1Д).
Отображаемые цвета показывают доминацию продавца, покупателя или неопределенность на рынке в конкретный временной период.
Зеленая зона указывает на преобладание покупателя - возможно открытие длинных позиций/покупок .
Красная зона указывает на преобладание продавца - потенциальный момент для открытия коротких позиций/продаж или сокращения своих длинных позиций/покупок .
Белая зона указывает на неопределенность на рынке - в этой зоне лучше не предпринимать никаких торговых решений .
EN: This indicator may be used for Crypto markets
RU: Этот индикатор можно использовать для криптовалютных рынков
BITSTAMP:BTCUSD
BITSTAMP:ETHUSD
COINBASE:COMPUSD
EN: Stocks, CFD and commodities
RU: Акций, CFD и рынков сырьевых товаров
FOREXCOM:SPXUSD
NASDAQ:TSLA
NYSE:BA
NASDAQ:EBAY
FOREXCOM:XAUUSD
EN: Consider using it with respect to Your trading style, money- and risk-management as well as other indicators
RU: Используйте этот индикатор в соответствии со своим стилем торговли, риск-, мани-менеджментом и другими индикаторами.

[astropark] DMI/ADX strategy [alarms]Dear Followers,
today I'm happy to share with you my DMI / ADX Strategy .
It provides directional trend information, so if a bullish or a bearish trend is going to start. Statistically it works better on lower timeframes (from 5 minutes to 1 hour).
It is both a Swing and Scalping Strategy indicator , based on a simple trend following theory , good for trading FOREX, Indexes, Stocks, Commodities and Cryptocurrencies.
To help in Taking Profits, the strategy integrates 2 special other than bull/bear signals:
Overbought and Oversold RSI Signals , which appear both as darker background (the darker the color, the more the price is in overbought/oversold) and green "ob"-"tp" / red "os"-"tp" labels (they optionally pop up only on a configurable stronger overbought/oversold condition) (you can enable/disable it optionally)
Peak Profit Tracker , which resets every time a new trade starts and keeps track of price fluctuation during the trade: the message is don't be too greedy and take profits or lock them with a stoploss in profit (you can enable/disable it optionally)
You can edit many options in order to
have more/less bull/bear signals
enable/disable showing bull/bear signals
enable/disable showing RSI TP signals (you can edit RSI length, overbought (OB) and oversold (OS) levels)
enable/disable showing peak profits on each trade
The user who wants to use this strategy, especially via an automated bot, must always set a stoploss (example 150$ from entry on bitcoin ) or use a proper risk management strategy .
This is not the "Holy Grail", so use it with caution. It's highly suggested to use a proper money management .
This script will let you set all notifications you may need in order to be alerted on each triggered signals.
You can find the strategy version for backtesting here below:
Here there are some examples how this DMI / ADX strategy works on many markets:
LTC/USDT 15m
BTC/USD 15m
BNB/BTC 15m
ETH/USD 15m
GOLD (XAU/USD) 15m
GOLD (XAU/USD) 1h
FB 15m
AAPL 15m
TSLA 1h
BANKNIFTY Index 5m
NIFTY 50 Index 5m
This is a premium indicator , so send me a private message in order to get access to this script .

Total Inflation ModelMeasure of the total economy wide inflation of the US Dollar.
Total Inflation = growth rate of money supply / economic output
