Williams %R & RSI with Multiple PeriodsDESCRIPTION
1. Calculates %R and RSI with multiple period lengths.
1 period length value is defined by User.
8 period length values follow User's selection of classic number sequences, e.g. Fibonacci, Leonardo, Lucas, Narayana, etc.
2. User selects which indicator and periods to display or hide.
DEFAULTS
%R default custom period: 10.
RSI default custom period: 14.
%R & RSI default number sequence periods: Lucas numbers 11, 18, 29, 47, 76, 123, 199, 322.
CALCULATIONS
%R = (period high - most recent period's close price)/(period high - period low)
RSI = 100 - 1 / (100 + RS), where RS = SMMA(up, period) / SMMA(down, period)
PURPOSE
1. Identify price trends.
CREDITS
1. Williams %R technical analysis momentum oscillator by Larry Williams.
2. Wilder's Relative Strength Index technical analysis momentum oscillator by J. Welles Wilder.
3. "Solarized" color scheme by Ethan Schoonover.
מדד ערוץ סחורות (CCI)
RSI & CCi SIGNAlUsing the RSA cross-indicator at points 70 and 30
Using the CCI cross indicator at points 100 and -100
Simultaneous use of RSA or CCI signal or both
Exit at 0.5% profit

3RSI 3CCI BB 5orders DCA strategy+This strategy is just an attempt to find the indicator values for the trading bot service that I use (link in profile). Due to the use of the “request.security” function in the code, the indicators can be redrawn, but this is not important in history. The strategy used only 5 orders for the "DCA" - bot, located at the same distance in the price overlap range. I only use this strategy when trading in pairs against bitcoin.
Эта стратегия – просто попытка подобрать значения индикаторов для сервиса торговых ботов, который я использую (ссылка в профиле). Из-за использования в коде функции «request.security» возможна перерисовка индикаторов, но на истории это не важно. В стратегии использовано всего 5 ордеров для «DCA» - бота, находящихся на одинаковом расстоянии в диапазоне перекрытия цены. Я использую данную стратегию только при торговле в парах к биткоину.

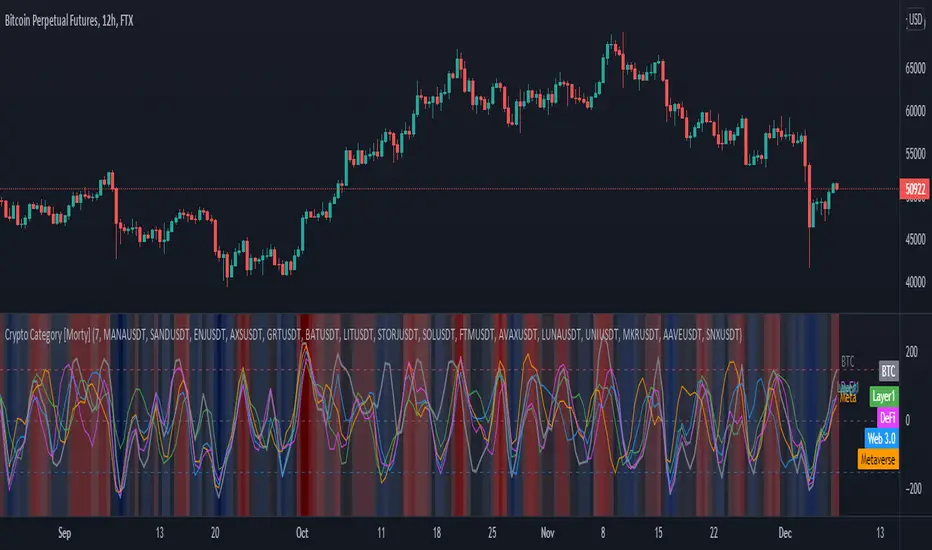
Crypto Category [Morty]This Crypto Category indicator shows an index oscillator for each cryptocurrency category.
Currently there are four categorys, include Metaverse, Web3, Layer1 and DeFi.
Each category index has four compoments and you can custom the input symbols.
The index is a Hull moving avarage of the compoments CCI. You can set the avarage period.
It also show a background heatmap based on the market sentiment which is calculated from the avarage of four indices.
Oversold / OverboughtMy first script. Based on RSI , CCI , RVI, and MFI . You can customize overbought or oversold thresholds for any indicator.
If you have any ideas - welcome.
Disclaimer
This is not financial advice. Trade on your own risk.

Dual Commodity Channel IndexThis simple script is a modification of the built-in CCI that adds a second CCI indicator of independent length. It also provides a Zero line for reference in addition to the built-in Upper/Lower Band.

ADX Screener// Identify potential trend reversals using ADX on up to 40 crypto assets.
// ADX shows the strength of a trend, not the direction.
// By monitoring the difference of ADX values between candles, you can potentially identify reversals before they happen.
// A strong trend has a 14 period ADX slope increasing .5 or more from the prior candle.
// At a minimum, a weak trend has a 14 period ADX slope of +.25 or less, and strictly it would be decreasing.
// This indicator prints one row for each asset with three columns for ADX differences one candle back each.
// The asset name is colored green or red dependent on whether +DI > -DI or not.
The market was in a down trend (-DI > +DI).
A bullish wave moved price up to EMA 8 resistance with strong ADX momentum (ADX diff of prior candle >= 0.5).
A Spinning Top showed that the trend was losing momentum (ADX diff lower than previous candle, showed the bullish wave losing momentum).
A Morning Star bearish reversal pattern draws resistance at the high of the pattern. (ADX Bullish momentum exhausted).
Symbol: -DI > +DI
2: Strong momentum
1: Losing momentum (spinning top)
0: Trend reversal (bearish engulfing pattern)

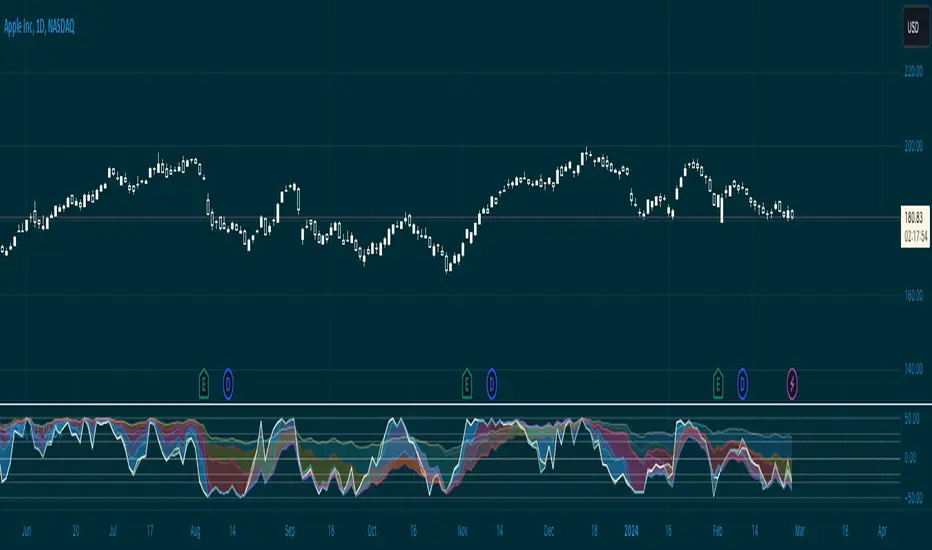
Multi Oscillators Price LevelsThis script draws price levels corresponding to the highest price reached in overbought situations, and the lowest price reached in oversold situations, depending on the oscillator and the timeframe the user has configured.
These levels correspond, most of time, to good supports and resistances prices.
Price levels drawings can be based on the following indicators:
Stochastic RSI (default)
Stochastic CCI
RSI
CCI
You can customize this indicator with the following options:
Source: The candle source to use in indicators calculation
Source Indicator: The indicator on which you cant to base your levels
Timeframe: The timeframe on which you want to apply the selected indicator, and calculate levels
Show supports/resistances: enable/disable price levels, depending on there status (overbought - resistances) / (oversold - supports)
Lines width: width of price levels. (set to 10 by default in order to draw "zones")
Supports/Resistances source: Select the candle data you cant to use to draw supports and resistances levels
Extend levels: Select the line extension for price levels
Levels color: Select the desired color for price levels
And of course , all parameters corresponding to the supported indicators (Stoch, RSI, CCI)
Here are a few examples of different configurations:
This script will probably be modified in the future, don't hesitate to suggest any improvement.

Baekdoo multi OverSold OverBuy colored CandleHi forks,
I'm trader Baekdoosan who trading Equity from South Korea. This Baekdoo multi OverSold OverBuy colored candle will give you the idea of
multiple indicators in one shot with colored candle. Those indicators tell us that oversold or overbuy statistically. For the color, you can freely change
based on your comfort. For me, in Korea white candle has red color and black candle has blue color. So somewhat confusing for you. Anyway you can
easily modify color in the script. Please refer this line.
barcolor(open<close and result_pos == 4 ? color.new(color.red, 0) : open<close and result_pos == 3 ? color.new(color.red, 25) : open<close and result_pos == 2 ? color.new(color.red, 50) : open<close and result_pos == 1? color.new(color.red, 75) : na)
you can see I put different transparency at color.new() function with color code. Let me divide and conquer to explain for up candle
white candle and black candle.
1. White candle
with 4 oversold signal case with white candle tells us it is almost reached real bottom and try to rebound. In this case, I put vivid color (no transparency) on the candle. And all 4 signal case, I put text on "OverSold". It will not happen frequently. Then 2 approaches can be made.
(a) short term approach
You can buy on this time. and you set stop loss with open price. This is mainly aimed for technical rebound.
(b) long term approach
You can accumulate based on your budget with 5 times dividing. At that day might not be the very bottom but those period will most probably real bottom. You can put more weight on latter buy. Let say, 1 : 1.25 : 1.5 : 1.75 : 2.5. So for example, if you have $8,000 to investigate then, buy $1,000 and then $1,250, $1,500, accordingly. If price rebound then don't adding weight on accumulation but with the first amount that you buy(i.e., $1,000 with above example). With this approach, you will not have much stress and you will get profit well. If this is grand bottom case, then you can HODL this long term. What you needs is stick to the plan. :)
with 3 signals the color is less vivid, 2 signals is much less vivid, accordingly.
2. Black candle
The approaches are opposite to above. The signal will tells us for 4 overBuy signals, then vivid blue candle will be shown. Our strategy is distribute to sell. Please do not sell in one shot. As Newton said, "I can calculate the motions of the heavenly bodies, but not the madness of the people". Strong buy phase, we don't know how far will it go. But indicators will tell us it is quite overSold situation. So what I can suggest you is sell it 10% to 20% on resistance price, and put 50% of lower than certain support price. Remember, accumulation and distribution will always better than one shot trading if you want to survive long time on this war field.
Hope this will help your trading on equity as well as crypto. I didn't try it on futures. Best of luck all of you. Gazua~!

Baekdoo arrows (white : long term CCI trend changing signal)Hi forks,
I'm trader Baekdoosan who trading Equity from South Korea. This long term CCI trend changing signal will gives you good buy point for a long term trading.
As you know, CCI ( Commodity Channel Index ) is the indicator of how difference from MA(Moving Average). If CCI (period) value is 0 then it is the same value of the SMA (price, period). Indication of overselling or overbuying will be counted by -100 and 100 value of CCI . What I chose value is 240. which is almost a year of period. My signal will be plotted this long term CCI indicator cross over -100. But I don't want it to be marked in case of long term CCI value fluctuating from -101 to -99 which will be marked frequently. Thus I put candle counter of 60 days after cross under -100 then only I count for cross over -100. By this I have very good signal to mark on the chart. Please enjoy my signal and have good profit from it~! Gazua~!

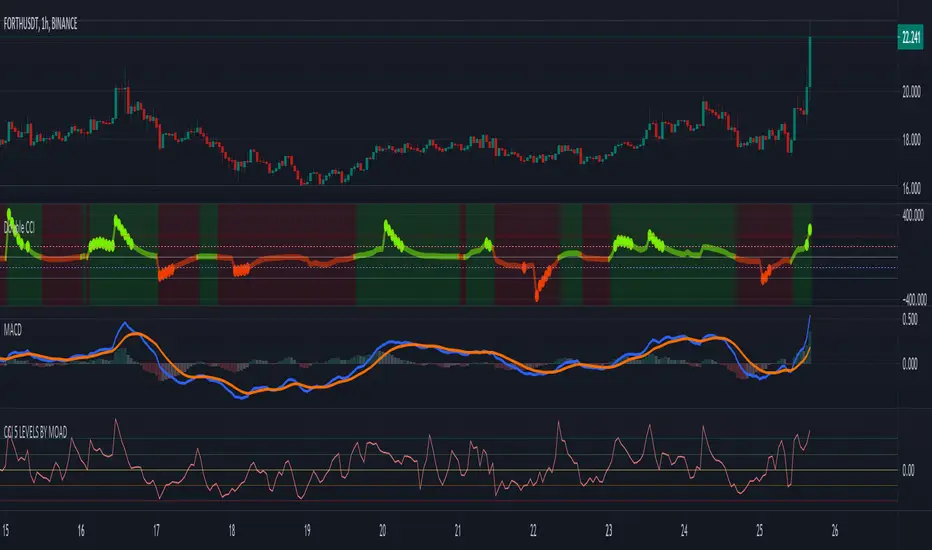
CCI 5 LEVELS BY MOADThe Commodity Channel Index ( CCI ) is a momentum oscillator used in technical analysis primarily to identify overbought and oversold levels by measuring an instrument's variations away from its statistical mean. Besides overbought/oversold levels, CCI is often used to find reversals as well as divergences. Originally, the indicator was designed to be used for identifying trends in commodities , however it is now used in a wide range of financial instruments.
There are several steps involved in calculating the CCI . The following example is for a typical 14 Period CCI:
CCI = (Typical Price - 14 Period SMA of TP) / (.015 x Mean Deviation)
Typical Price (TP) = (High + Low + Close)/3
Constant = .015
The Constant is set at .015 for scaling purposes. By including the constant, the majority of CCI values will fall within the 100 to -100 range.
Mean Deviation:
1) Subtract the most recent 14 Period Simple Moving from each typical price (TP) for the Period.
2) Sum these numbers strictly using absolute values.
3) Divide the value generated in step 2 by the total number of Periods (14 in this case).
Overbought and Oversold conditions can be used in their more traditional sense to identify future reversals. Remember true overbought/oversold thresholds values can and often do vary between instruments.
During a Bullish Trend, price crossing above the overbought threshold may indicate strong confidence in the move and price will continue to rise.
During a Bearish Trend, price crossing below the oversold threshold may indicate strong confidence in the move and price will continue to fall.
The first option is a modified CCI indicator that uses the "Arnaud Legoux Moving Average" instead of the SMA , and the source uses the VWAP instead of the HLC3. Added to this version an option to calculate CCI with different types of moving averages:
Green dots mean they are overbought
Orange dots mean they are oversold
Added a "SuperTrend Background" based on the modified CCI indicator:
Bull event = CCI crossing over the 0 line
Bear event = CCI crossing below the 0 line
Added a signal as EMA (modified CCI , signal length)
The second option is a standard CCI indicator that shows a coloured histogram of important levels, giving a good visual of the CCI levels. Added to this version is an extra coloured level +/-200 and an option to use Traditional CCI calculations according to user @JustUncleL
LEVELS:
Aqua: Greater than 200.
Lavender: Greater than 100 and less than 200.
Dark Lavender: Greater than 0 and less than 100.
Dark Coral: Less than 0 and greater than -100.
Coral: Less than -100 and greater than -200.
Light Red: Less than -200.
RSI CCI Correlating Oscillator (RCCO) by empowerTRCCO is pronounced "ree-koh" or "rico".
The RCCO is simply the plot of the values of both the RSI and CCI added together.
The RCCO makes some adjustments though, so that both the RSI and the CCI will fit correctly on the same scale - and so that these adjustments for scale allow reversals to be detected at crossings.
When the CCI crosses from underneath to up above the RSI, this is usually a bullish reversal. Alternatively, when the CCI crosses from above to back under the RSI, that usually signals a bearish trend. Look for the widest swings you can find to ensure good momentum. The larger the volume, the clearer and more decisive the trends. Low volume will lead to ranging and lazy momentum. High volume will create clear and forceful trends. The lowest negative RCCO in a timeframe, and then add some high volume... and you have yourself a good setup for a successful trade.
Because the RSI and CCI are adjusted, you may not recognize their values from having used the respective indicators on their own. The RSI and CCI values are less important. What matters with this indicator are the crossings and the RCCO value. The RCCO value should be negative, preferably, a deeply negative value. Look at the historical chart for the target per your selected timeframe and decide what values work for you.
I hope you enjoy the RCCO and that it can help you become a little más RICO!

ExpertToken Buy/Sell SignalExpertToken Buy/Sell Signal เป็นอินดิเคเตอร์ที่สามารถบอกสัญญาณการซื้อขาย และบอกแนวโน้มของราคาได้
หลักการทำงาน
สัญญาณ Buy/Sell ถูกกำหนดโดยการใช่ CCI วัดโมเมนตัมการซื้อขาย หาก CCI ส่งสัญญาณว่าแรงขายเยอะเกินไป และมีแนวโน้มราคาจะกลับตัวสูงขึ้น ก็จะส่งสัญญาณ Buy แต่หาก CCI ส่งสัญญาณว่าแรงซื้อเยอะเกินไป และมีแนวโน้มราคาจะกลับตัวต่ำลง ก็จะส่งสัญญาณ Buy
เส้นสีน้ำเงินเป็นเส้น EMA 200 ไว้ใช้บอกแนวโน้มระยะยาว
เมฆขาว ประกอบไปด้วย เส้นสีเขียว(เส้น EMA เคลื่อนที่เร็ว) และเส้นสีแดง(เส้น EMA เคลื่อนที่ช้า) โดยให้ทั้งสองเส้นตัดกันเพื่อบอกสัญญาณการกลับตัว ค่าเริ่มต้นของทั้งสองเส้นเป็น 20, 50
วิธีการใช้อินดิเคเตอร์
ขั้นตอนแรก ให้ดูเส้นสีน้ำ หากราคาอยู่เหนือเส้นสีน้ำเงิน อาจมีแนวโน้มที่ราคาจะขึ้น
ขั้นตอนที่สอง ให้ดูเมฆ ที่ถูกสร้างขึ้นโดยการน้ำเส้น EMA 2 เส้น สีเขียวและสีแดง หากเส้นสีเขียวอยู่เหนือเส้นสีแดง ราคาอาจมีแนวโน้มที่ขึ้น หากเส้นสีแดงอยู่เหนือเส้นสีเขียว ราคาอาจจะลง แต่ถ้าหากราคาอยู่ในโซนเมฆขาว(ราคาอยู่ระหว่างเส้นเขียวกับสีแดง) ราคาอยู่ในช่วงเป็นกลาง
สุดท้าย หากมีข้อความบอกสัญญาณบอกว่า Buy หรือ Sell ให้พิจารณาจากสองขั้นตอนก่อนหน้านี้ หากมันสอดคล่องกับสองขั้นตอนก่อนหน้านี้ ให้พิจารณาการเปิดตำแหน่งตามสัญญาณ
################################################################################################
ExpertToken Buy/Sell Signal is an indicator that can give you trading signals. and tell the trend of the price
How it works
Buy/Sell signals are determined by using CCI to measure trading momentum.
If CCI signals too much selling pressure and there is a tendency for the price to reverse higher It sends a buy signal, but if CCI signals that it is overbought and the price tends to reverse lower will send signal Buy
The blue line is the EMA 200 line to indicate a long-term trend.
The white cloud consists of a green line (fast moving EMA line) and a red line (slow moving EMA line), with the two lines intersecting to signal a reversal. The default values for both lines are 20, 50.
How to use the indicator
The first step is to look at the watercolor lines. If the price is above the blue line There may be a tendency for prices to go up.
The second step is to look at the clouds that are created by watering the 2 EMA lines, green and red. If the green line is above the red line The price may tend to go up. If the red line is above the green line, the price may go down, but if the price is in the white cloud zone (the price is between the green and red line), the price is in the neutral range.
Finally, if there is a signal to say Buy or Sell, consider the previous two steps. If it complies with the previous two steps Consider opening a position based on a signal.

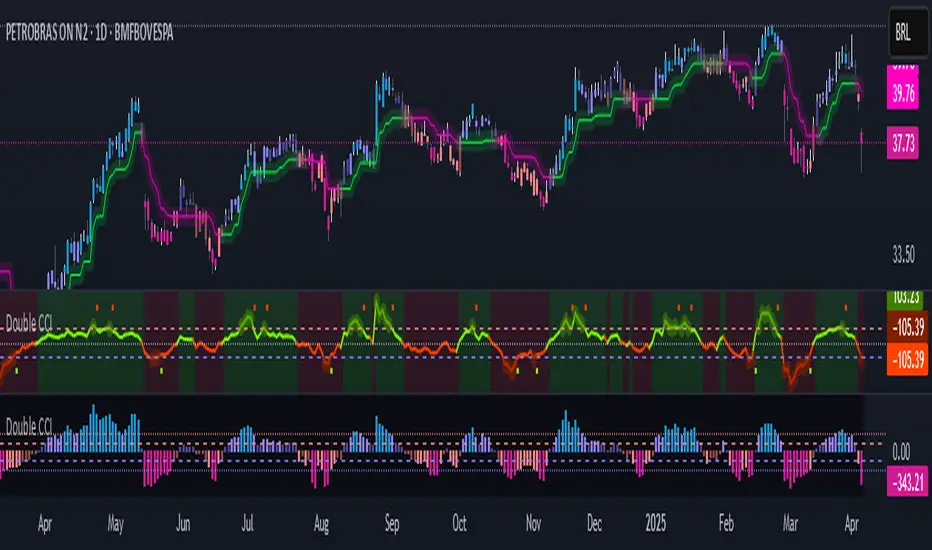
Double CCIThe Commodity Channel Index (CCI) is a momentum oscillator used in technical analysis primarily to identify overbought and oversold levels by measuring an instrument's variations away from its statistical mean. Besides overbought/oversold levels, CCI is often used to find reversals as well as divergences. Originally, the indicator was designed to be used for identifying trends in commodities, however it is now used in a wide range of financial instruments.
There are several steps involved in calculating the CCI. The following example is for a typical 14 Period CCI:
CCI = (Typical Price - 14 Period SMA of TP) / (.015 x Mean Deviation)
Typical Price (TP) = (High + Low + Close)/3
Constant = .015
The Constant is set at .015 for scaling purposes. By including the constant, the majority of CCI values will fall within the 100 to -100 range.
Mean Deviation:
1) Subtract the most recent 14 Period Simple Moving from each typical price (TP) for the Period.
2) Sum these numbers strictly using absolute values.
3) Divide the value generated in step 2 by the total number of Periods (14 in this case).
Overbought and Oversold conditions can be used in their more traditional sense to identify future reversals . Remember true overbought/oversold thresholds values can and often do vary between instruments.
During a Bullish Trend , price crossing above the overbought threshold may indicate strong confidence in the move and price will continue to rise.
During a Bearish Trend , price crossing below the oversold threshold may indicate strong confidence in the move and price will continue to fall.
The first option is a modified CCI indicator that uses the "Arnaud Legoux Moving Average" instead of the SMA, and the source uses the VWAP instead of the HLC3. Added to this version an option to calculate CCI with different types of moving averages:
Green dots mean they are overbought
Orange dots mean they are oversold
Added a "SuperTrend Background" based on the modified CCI indicator:
Bull event = CCI crossing over the 0 line
Bear event = CCI crossing below the 0 line
Added a signal as EMA (modified CCI, signal length)
The second option is a standard CCI indicator that shows a coloured histogram of important levels, giving a good visual of the CCI levels. Added to this version is an extra coloured level +/-200 and an option to use Traditional CCI calculations according to user @JustUncleL
LEVELS:
Aqua: Greater than 200.
Lavender: Greater than 100 and less than 200.
Dark Lavender: Greater than 0 and less than 100.
Dark Coral: Less than 0 and greater than -100.
Coral: Less than -100 and greater than -200.
Light Red: Less than -200.
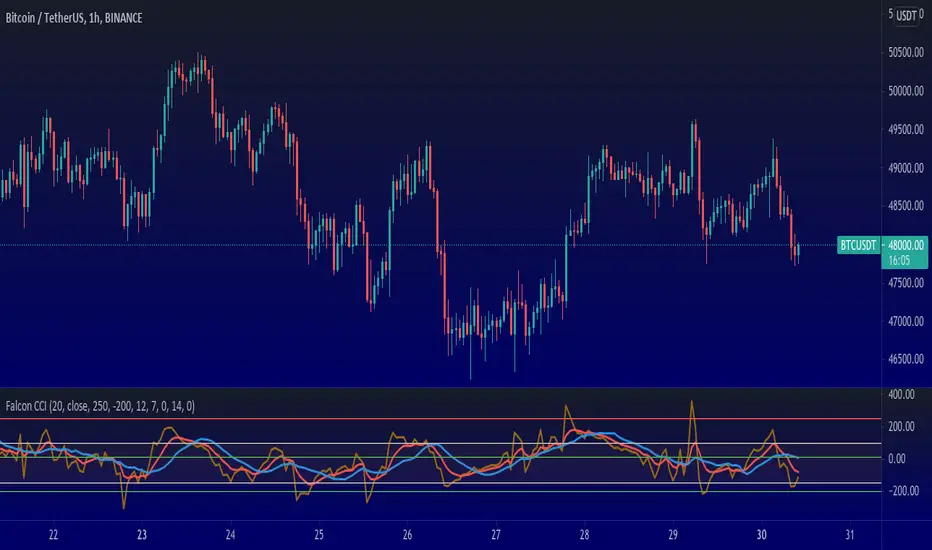
Falcon Commodity Channel IndexFalcon CCI indicator is a superb indicator for anyone who wants to dig deep and still float. The trading lifestyle requires you to be one step ahead of everyone else, while doing so, you want to manage risk, enter at correct positions and perhaps exit at correct positions too.
Exiting at correct positions is so over rated, people tend to forget that exit is as important as entry and therefore we need to make sure that we use a good indicator setup that helps us to do that.
Falcon CCI Indicator is a receipe developed by me during recent Bitcoin slump, where we really needed something more to help us get pass through ups and downs, sudden movements and volatility in the market.
This indicator is perfect even for the swing and trend traders, intra day and day traders who want a quick win, rather than invest for long term.
Here are entry and exit plans based on this indicator:-
Setup: I keep CCI at 20, MA at 14 and EMA at 7 but I change it depending on the stock or crypto. Truth is, you can play with it and find what is best for your trading setups, but once you are done, it really works.
Buy: Buy when CCI crosses above MA or EMA , but CCI should be below 50
Sell: Sell when CCI crosses below MA or EMA (You need to choose), CCI should be above 150
There can be other entry and exit based on just CCI values, and therefore I have added some max and min inputs too in the indicator, e.g. Buy when CCI is -180 and sell when CCI is 300.
Trading is a long process.
To all my friends who have lost in futures , or anywhere else in the market, don't worry, just follow the process and follow your own rules. Don't break them.
You can connect with me on Trading View, message me to discuss this further. Happy to take your questions.
P.S you can also add linear regression to this to give you certain price points, for market tops or bottoms within the time frame.
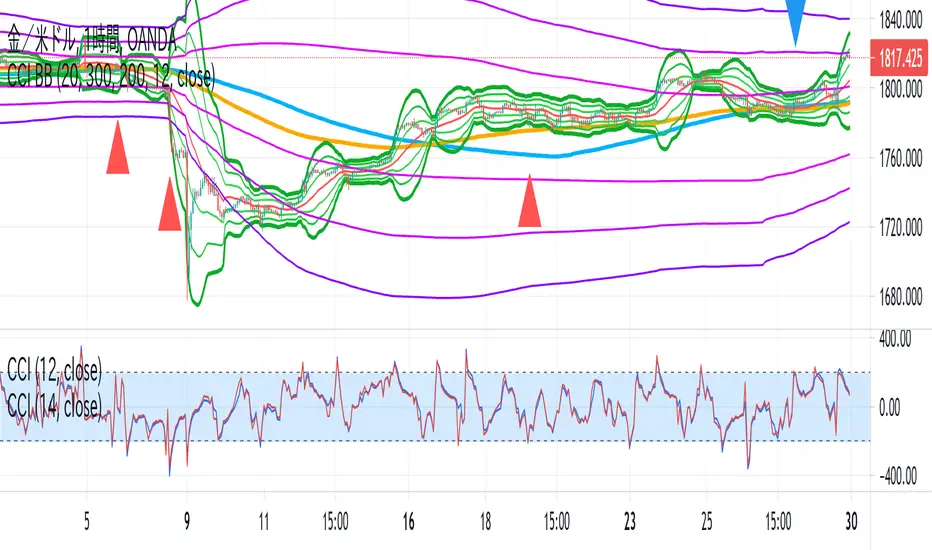
CCI BBThis indicator is the idea of giorno_4_16 .
It shows some indicator lines in your main chart as following:
SMA300, EMA200
BB 20 1,2,3sigma and middle
BB 300 1,2,3sigma and middle
You should put CCI (12, 14) into your separated chart to use the idea.
It shows arrows for registance trading when:
CCI(12) crossovers -200 or corssunders 200 in recent 6bars,
and the price crosses indicator line of SMA200, EMA200 and BB300 1,2,3sigma.
When CCI crossovers -200, you can condisider buying.
When CCI crossunders 200, you can condisider selling.
You should use this indicator in 1H or 4H.
When an arrow appears in 1H, change timeframe to 4H and check the slope of BB20.
If the slope is gentle, take-profit target is MA20 of 1H.
If the slope is steep(ex. CCI crossovers -200 and 4H BB20 go up steeply), take-profit target is BB20 2sigma of 1H.
3CCI & 3RSI for botsThis script is for trading grid bots. Only CCI and RSI are used, but there are three different timeframes available for each. When using it, you must select a chart with a period equal to or less than the minimum in the indicator settings. For example, the following periods are selected in the settings: 1 hour, 15 minutes, 5 minutes, so we use a 5-minute chart. A buy or sell signal will be received if the settings of all 6 indicators match. The default settings do not carry any information, use your own. The code is quite simple and may be of interest to a beginner like me.

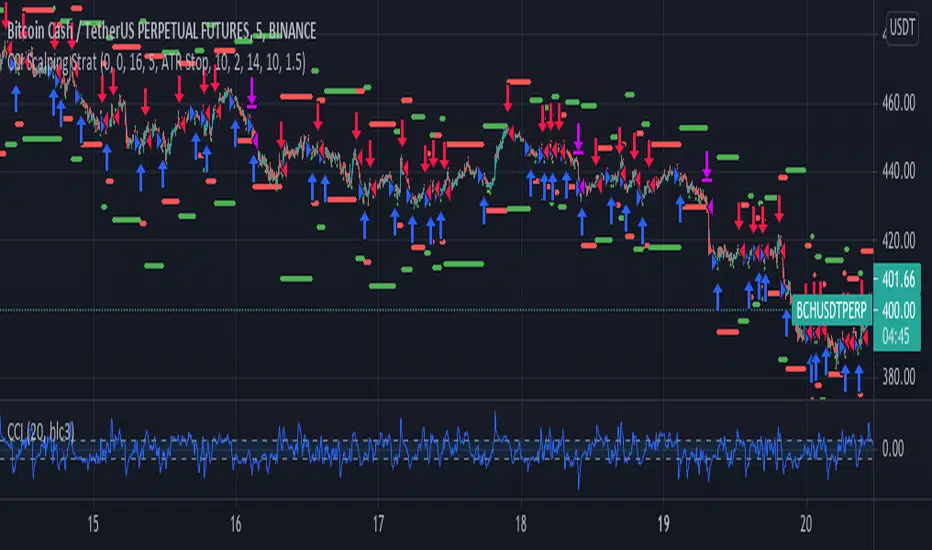
CCI Scalping Strategy---From the "Bitcoin Trading Strategies" book, by David Hanson---
After testing, works better with an ATR stop instead of the Strategy Stop. This parameter
can be changed from the strategy Inputs panel.
"CCI Scalping Strategy
Recommended Timeframe: 5 minutes
Indicators: 20 Period CCI, 20 WMA
Long when: Price closes above 20 WMA and CCI is below -100, enter when CCI crosses above -100.
Stop: Above 20 WMA"
CCI & EMA strategy by TradeswithashishThis strategy is extremely useful for positional traders or traders using timeframe 15-minute of higher. It uses following combo of values:
VWAP, CCI, Volume and Moving average (simple and exponential)
Caution:
Avoid taking trade if candle size is greater than twice the average candle size. for that wait for the retracement to near trailing stoploss

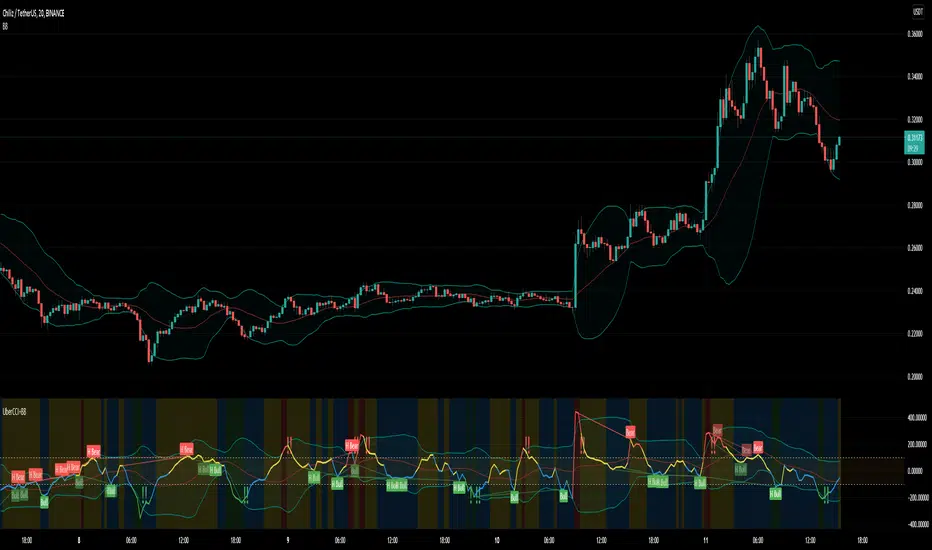
Uber Dank CCI + Captain Beefheart Bollinger Bands ExtraordinareIntroducing, the Uber Dank CCI + Captain Beefheart Bollinger Bands Extraordinaire
Its bollinger bands, CCI and CCI Bollinger Bands all in one.
The color of the CCI shows the condition of the bollinger band on chart.
Close > upper band = red
Close > basis = yellow
Close < basis = blue
Close < lower band = green
Then a bollinger band is printed on the CCI itself,
The background color displays the condition of the CCI bollinger band by the same logic as the CCI color.
CCI > upper band = red
CCI > basis = yellow
CCI < basis = blue
CCI < lower band = green
The exclamation marks tell you when the conditions are coming to an end. They check the last two bars to see if both the CCI and the closing price are under their bollinger bands at the same time for at least one of those bars, and they check the current bar that at least one of those conditions has ended. That is why they will most often print two exclamation marks in a row.
Technicals Rating Strategy v420Ichimoku, HMA, RSI, Stoch, CCI, MACD, Technicals Rating Strategy is a trading Bot that looks at these chosen indicators and assigns a value to each, then calculates the result of adding each indicators result value to a overall rating, which is then compared to a user set level. Here seen on Bitcoin, it has the broker fee included in the testing result. If you choose to use it on Forex etc, perhaps remove the broker fee which is unrealistic for FX trading.
It has a Win/Loss ratio of only 40% wins, but it catches the big moves and thats the main thing, so if ELON MUSK had of used this strategy instead of BUY and HOLD, he could of made 700% instead of 7% (as is, may, 2021)
Mainly intended for use as Automated TRADE BOT.
(imagine if Elon Musk did use this bot with his 1.3 billion $ worth of BTC, the drawdown would be like, half a billion or something haha (p.s.- use smaller lotsize % to get smaller drawdown, but then smaller profit....) )
For use with any pair and timeframe. In fact there is a timeframe setting to set the strategy to look at alternative timeframe from chart, but as default will just be set to charts timeframe.

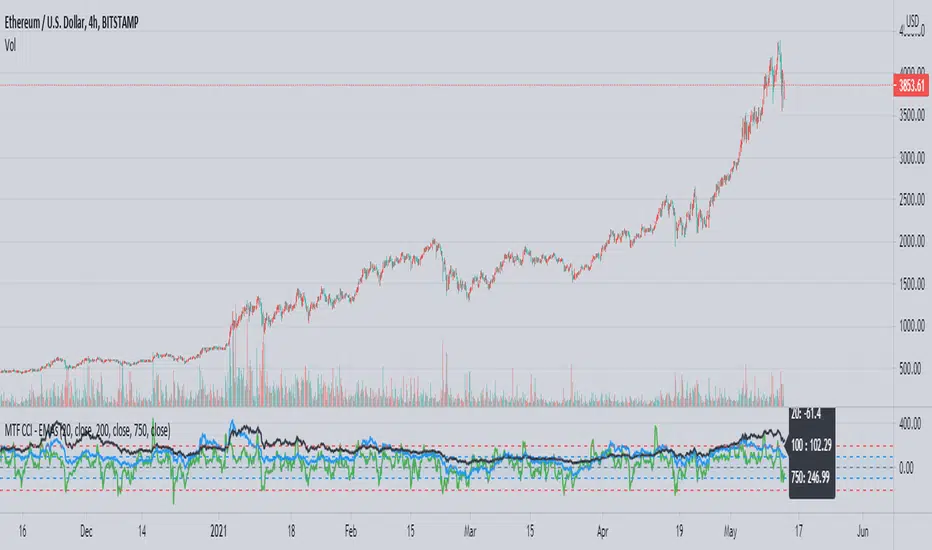
MTF CCI using EMAsThis is a CCI script adapted from 'CCI w EMA by Rick3712' which removes the EMA of the CCI and adds different sized CCI results to the same plot. An info box is also added for easy reference of current values.
CCI is a useful way to see the price's relation to moving averages in a different way, and being able to see the trend strength over time using the larger CCI allows a trader to make better informed decisions when reaching oversold or overbought conditions in relation to the shorter EMAs, such as the 20. You can also see patterns in a trend's strength easier by comparing the movements and levels to find likely areas of a pullback or buying opportunity.
In the example you can see a common level in ETH's parabolic movement on the 4h 750 EMA and 200 EMA that indicates a likely correction area.
CCI45/SMA50 indy for 30 min SP500SPCFD:SPX
The script determines entry points using 45 period CCI and 50 period SMA.
Long condition: When CCI crosses up 150 treshold while price above 50 period SMA
Short condition: When CCI crosses down -150 treshold while price below 50 period SMA
Trades are executed above/below 1 point of high/low for long/short positions. Stops are just 1 point below/above of SMA. After 4 points of profit stops should be tightened. If you do not plan to hold the position for a long time, it can produce quick profit within 5-6 bars namely 2.5-3 hour. Otherwise you can manage the trade using SMA as trailing stop. This can be treated as a strategy of scalping which turns out a trend trading eventually if conditions good.
Have a nice trading
