Reentry BUY SELL OnlyReentry BBMA tapi per 4 jam sekali,, Entri di time frame m15 folow buy dan sellnyaאינדיקטור Pine Script®מאת raycore9062
Kinetic RSI [Vel + Accel] + AlertsThe Problem with Standard RSI Most traders use the Relative Strength Index (RSI) to see if a market is "Overbought" (above 70) or "Oversold" (below 30). The problem? A strong trend can stay overbought for days, burning short sellers, or an asset can stay oversold while price continues to crash. Standard RSI tells you where the price is, but it doesn't tell you how hard it is moving. The Solution: Kinetic RSI This script reimagines RSI by applying basic physics concepts: Velocity and Acceleration. Instead of asking "Is RSI below 30?", this indicator asks: "Is RSI below 35 AND did it just make a violent, high-speed turn upwards?" It filters out lazy, drifting price action and only signals when momentum is accelerating in a new direction. How It Works (The Math) Velocity: We calculate the speed of the RSI change (Current RSI - Previous RSI). Acceleration: We calculate if that speed is increasing (Current Velocity - Previous Velocity). The Trigger: A signal is only generated if the RSI is in an extreme zone (<35 or >65) AND it has high Velocity AND positive Acceleration. How to Trade It 1. The "Kick" Signals (Background Highlights) 🟢 Green Background (Bullish Kick): The RSI was low, but buyers stepped in aggressively. The momentum is not just positive; it is accelerating upward. This is often a "V-Bottom" catch. 🔴 Red Background (Bearish Kick): The RSI was high, but sellers slammed the price down. Momentum is accelerating downward. 2. The Line Color Lime Line: Velocity is positive (Momentum is rising). Fuchsia Line: Velocity is negative (Momentum is falling). Usage: If the background flashes Green (Buy Signal), but the line turns back to Fuchsia (Red) a few bars later, the move has failed—exit the trade. Settings & Alerts RSI Length: Standard 14 (Adjustable). Velocity Threshold: Controls sensitivity. Lower (e.g., 2-3): More signals, catches smaller reversals. Higher (e.g., 5+): Fewer signals, catches only massive "shocks" to the price. Alerts Included: You can set alerts for "Bullish Kick," "Bearish Kick," or "Any Kick" to get notified of volatility spikes. Best Practices Wait for the Close: This indicator measures the closing velocity. Always wait for the bar to close to confirm the background color signal. Trend Filtering: This works best as a "Reversal" indicator. If the market is in a super-strong uptrend, ignore the Bearish (Red) signals and only take the Bullish (Green) dips.אינדיקטור Pine Script®מאת MonkeyPhone8
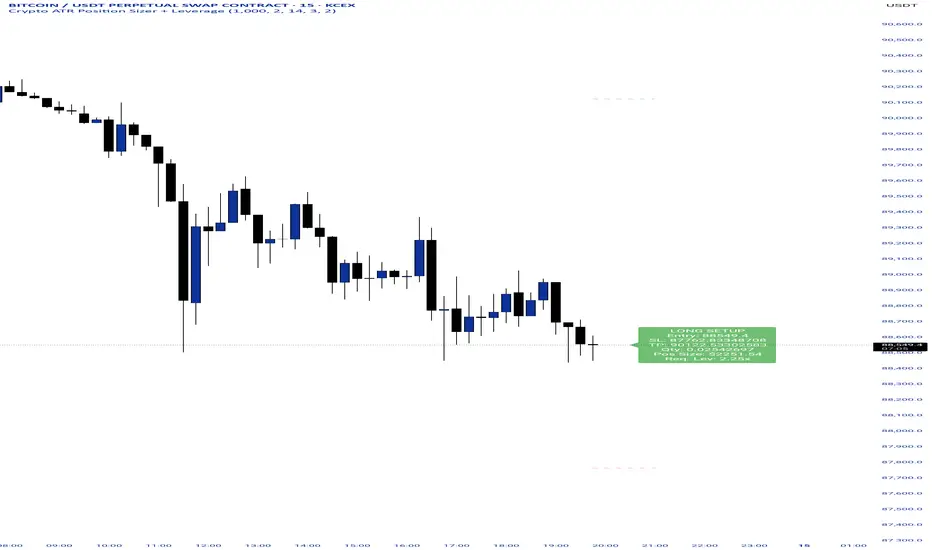
Crypto ATR Position Sizer + LeverageThis indicator is a "heads-up display" for crypto traders who need real time risk management without manually calculating position sizes. It uses Average True Range (ATR) to dynamically place Stop Losses based on current market volatility and automatically calculates the exact position size needed to respect your risk percentage. Key Features: Dynamic Risk Management: Stop Loss and Take Profit levels adjust automatically based on market volatility (ATR). Auto-Position Sizing: Calculates the exact Quantity (in coins) and Position Value (in $) to ensure you never risk more than your defined percentage (e.g., 1% or 2%). Leverage Calculator: Instantly sees the "Required Leverage" needed to execute the trade size relative to your account balance. Crypto Precision: Displays up to 8 decimal places, making it compatible with both Bitcoin and low-sat altcoins. Toggable Direction: Switch between Long and Short biases instantly via the settings menu. How to Use: Add the indicator to your chart. Open Settings and input your Account Balance and Risk %. Choose your direction (Long or Short) using the checkboxes. The label will display your Entry, SL, TP, Coin Quantity, and Required Leverage in real-time.אינדיקטור Pine Script®מאת MonkeyPhone13
EngulfingCandle NR (v5)This script non repainting and signal generating .this is simpleאינדיקטור Pine Script®מאת jeyachan026
Impulse %Impulse % — Liquidation Cascade Detector (BTC · 1H) Impulse % identifies sharp impulsive price moves and liquidation cascades by measuring how much a candle’s range deviates from its historical average in percent. How it works Calculates the candle range (in %) relative to price and compares it to the average over N periods. When the range exceeds the upper band, an Impulse is detected. Inside each 1H candle, the indicator checks lower timeframes (1m / 5m) to classify the impulse phases: PANIC — the first minutes of a violent move (forced liquidations, stop hunts). CAUTION (Cascade) — continuation and “cleanup” phase with elevated risk. Determines whether the impulse is against the trend using EMA 50 / EMA 200 — the most dangerous scenario. Highlights risk zones to protect positions and filter new entries. What it’s for Avoid entering during liquidation cascades. Exit at break-even or partially take profit during risky phases. Recommended Settings — BTC (1H) Calculation Calculation TF: (empty = current) Average Mode: By N bars N (bars): 100 Range Type: High–Low Bands Upper Band (% of average): 130 Lower Band: Auto (same %) Cascade (First Minutes) Enable Cascade Filter: ON When to trigger safety: Only against trend PANIC (minutes): 3 CAUTION (minutes after PANIC): 15 Trend (EMA) Use EMA Trend: ON Fast EMA: 50 Slow EMA: 200 Lower TF Detection Lower TF: 1m (or 5m if you prefer smoother signals) Visualization Style: Columns Show Bands: ON Show Band Lines & Mean: ON How to read it (BTC · 1H) Purple (PANIC): first minutes of liquidation — do not enter. Yellow (CAUTION): cascade phase — high risk, manage/exit. Normal color: no active cascade — strategy allowed. Best practice: 1m/5m → real-time cascade detection 1H → decision level 4H → market context אינדיקטור Pine Script®מאת yulche02מעודכן 16
Neosha Concept V4 (NY Time) Imagine the financial market as a huge ocean. Millions of traders throw orders into it every second. But beneath all the noise, there is a powerful current that quietly controls where the waves move. That current is not a person, not a trader, and not random—it is an algorithm. This algorithm is called the Interbank Price Delivery Algorithm (IPDA). Think of it as the “navigation system” that guides price through the market. IPDA has one job: to move prices in a way that keeps the market efficient and liquid. To do this, it constantly looks for two things: 1. Where liquidity is hiding Liquidity is usually found above highs and below lows—where traders place stop losses. The algorithm moves price there first to collect that liquidity. 2. Where price became unbalanced Sometimes price moves too fast and creates gaps or imbalances. IPDA returns to those areas later to “fix” the missing orders. Once you start looking at the charts with this idea in mind, everything makes more sense: Why price suddenly spikes above a high and crashes down Why big moves leave gaps that price later fills Why the market reverses right after taking stops Why trends begin only after certain levels are hit These are not accidents. They are the algorithm doing its job. Price moves in a repeating cycle: Gather liquidity Make a strong move (displacement) Return to fix inefficiency Deliver to the next target Most beginners only see the candles. But once you understand IPDA, you see the intention behind the candles. Instead of guessing where price might go, you begin to understand why it moves there. And once you understand the “why,” your trading becomes clearer, calmer, and far more accurate. אינדיקטור Pine Script®מאת jasiremailמעודכן 2240
MTF Alignment & Key Levelsso this one is specifically for the 1hr and 4hr time frame. but what it does is alert you once the monthly weekly and daily timeframes align with a trend in a certain direction wether its bearish or bullish but then it will mark out key levels on the 1hr and 4hr time frame to indicate when price breaks through that level to enter a trade in the direction of the higher timeframes alignment. אינדיקטור Pine Script®מאת wateriskey66891117
CRT CandleCRT Candle CRT Candle CRT Candle CRT Candle CRT Candle CRT Candle CRT Candle CRT Candleאינדיקטור Pine Script®מאת unknown-lI1i10
Ashok 07 Dec 25 updated scriptTried to fix the bugs in previous script. Even now improvements are needed, but for now it looks reasonably profiting.אסטרטגיית Pine Script®מאת ashokkkkkk13
10 AM OPEN/12 AM OPENIt shows the opening candles for 10am and 12 am openאינדיקטור Pine Script®מאת realalexingram11
Obsidian Flux Matrix# Obsidian Flux Matrix | JackOfAllTrades Made with my Senior Level AI Pine Script v6 coding bot for the community! Narrative Overview Obsidian Flux Matrix (OFM) is an open-source Pine Script v6 study that fuses social sentiment, higher timeframe trend bias, fair-value-gap detection, liquidity raids, VWAP gravitation, session profiling, and a diagnostic HUD. The layout keeps the obsidian palette so critical overlays stay readable without overwhelming a price chart. Purpose & Scope OFM focuses on actionable structure rather than marketing claims. It documents every driver that powers its confluence engine so reviewers understand what triggers each visual. Core Analytical Pillars 1. Social Pulse Engine Sentiment Webhook Feed: Accepts normalized scores (-1 to +1). Signals only arm when the EMA-smoothed value exceeds the `sentimentMin` input (0.35 by default). Volume Confirmation: Requires local volume > 30-bar average × `volSpikeMult` (default 2.0) before sentiment flags. EMA Cross Validation: Fast EMA 8 crossing above/below slow EMA 21 keeps momentum aligned with flow. Momentum Alignment: Multi-timeframe momentum composite must agree (positive for longs, negative for shorts). 2. Peer Momentum Heatmap Multi-Timeframe Blend: RSI + Stoch RSI fetched via request.security() on 1H/4H/1D by default. Composite Scoring: Each timeframe votes +1/-1/0; totals are clamped between -3 and +3. Intraday Readability: Configurable band thickness (1-5) so scalpers see context without losing space. Dynamic Opacity: Stronger agreement boosts column opacity for quick bias checks. 3. Trend & Displacement Framework Dual EMA Ribbon: Cyan/magenta ribbon highlights immediate posture. HTF Bias: A higher-timeframe EMA (default 55 on 4H) sets macro direction. Displacement Score: Body-to-ATR ratio (>1.4 default) detects impulses that seed FVGs or VWAP raids. ATR Normalization: All thresholds float with volatility so the study adapts to assets and regimes. 4. Intelligent Fair Value Gap (FVG) System Gap Detection: Three-candle logic (bullish: low > high ; bearish: high < low ) with ATR-sized minimums (0.15 × ATR default). Overlap Prevention: Price-range checks stop redundant boxes. Spacing Control: `fvgMinSpacing` (default 5) avoids stacking from the same impulse. Storage Caps: Max three FVGs per side unless the user widens the limit. Session Awareness: Kill zone filters keep taps focused on London/NY if desired. Auto Cleanup: Boxes delete when price closes beyond their invalidation level. 5. VWAP Magnet + Liquidity Raid Engine Session or Rolling VWAP: Toggle resets to match intraday or rolling preferences. Equal High/Low Scanner: Looks back 20 bars by default for liquidity pools. Displacement Filter: ATR multiplier ensures raids represent genuine liquidity sweeps. Mean Reversion Focus: Signals fire when price displaces back toward VWAP following a raid. 6. Session Range Breakout System Initial Balance Tracking: First N bars (15 default) define the session box. Breakout Logic: Requires simultaneous liquidity spikes, nearby FVG activity, and supportive momentum. Z-Score Volume Filter: >1.5σ by default to filter noisy moves. 7. Lifestyle Liquidity Scanner Volume Z-Scores: 50-bar baseline highlights statistically significant spikes. Smart Money Footprints: Bottom-of-chart squares color-code buy vs sell participation. Panel Memory: HUD logs the last five raid timestamps, direction, and normalized size. 8. Risk Matrix & Diagnostic HUD HUD Structure: Table in the top-right summarizes HTF bias, sentiment, momentum, range state, liquidity memory, and current risk references. Signal Tags: Aggregates SPS, FVG, VWAP, Range, and Liquidity states into a compact string. Risk Metrics: Swing-based stops (5-bar lookback) + ATR targets (1.5× default) keep risk transparent. Signal Families & Alerts Social Pulse (SPS): Volume-confirmed sentiment alignment; triangle markers with “SPS”. Kill-Zone FVG: Session + HTF alignment + FVG tap; arrow markers plus SL/TP labels. Local FVG: Captures local reversals when HTF bias has not flipped yet. VWAP Raid: Equal-high/low raids that snap toward VWAP; “VWAP” label markers. Range Breakout: Initial balance violations with liquidity and imbalance confirmation; circle markers. Liquidity Spike: Z-score spikes ≥ threshold; square markers along the baseline. Visual Design & Customization Theme Palette: Primary background RGB (12,6,24). Accent shading RGB (26,10,48). Long accents RGB (88,174,255). Short accents RGB (219,109,255). Stylized Candles: Optional overlay using theme colors. Signal Toggles: Independently enable markers, heatmap, and diagnostics. Label Spacing: Auto-spacing enforces ≥4-bar gaps to prevent text overlap. Customization & Workflow Notes Adjust ATR/FVG thresholds when volatility shifts. Re-anchor sentiment to your webhook cadence; EMA smoothing (default 5) dampens noise. Reposition the HUD by editing the `table.new` coordinates. Use multiples of the chart timeframe for HTF requests to minimize load. Session inputs accept exchange-local time; align them to your market. Performance & Compliance Pure Pine v6: Single-line statements, no `lookahead_on`. Resource Safe: Arrays trimmed, boxes limited, `request.security` cached. Repaint Awareness: Signals confirm on close; alerts mirror on-chart logic. Runtime Safety: Arrays/loops guard against `na`. Use Cases Measure when social sentiment aligns with structure. Plan ICT-style intraday rebalances around session-specific FVG taps. Fade VWAP raids when displacement shows exhaustion. Watch initial balance breaks backed by statistical volume. Keep risk/target references anchored in ATR logic. Signal Logic Snapshot Social Pulse Long/Short: `sentimentEMA` gated by `sentimentMin`, `volSpike`, EMA 8/21 cross, and `momoComposite` sign agreement. Keeps hype tied to structural follow-through. Kill-Zone FVG Long/Short: Requires session filter, HTF EMA bias alignment, and an active FVG tap (`bullFvgTap` / `bearFvgTap`). Labels include swing stops + ATR targets pulled from `swingLookback` and `liqTargetMultiple`. Local FVG Long/Short: Uses `localBullish` / `localBearish` heuristics (EMA slope, displacement, sequential closes) to surface intraday reversals even when HTF bias has not flipped. VWAP Raids: Detect equal-high/equal-low sweeps (`raidHigh`, `raidLow`) that revert toward `sessionVwap` or rolling VWAP when displacement exceeds `vwapAlertDisplace`. Range Breakouts: Combine `rangeComplete`, breakout confirmation, liquidity spikes, and nearby FVG activity for statistically backed initial balance breaks. Liquidity Spikes: Volume Z-score > `zScoreThreshold` logs direction, size, and timestamp for the HUD and optional review workflows. Session Logic & VWAP Handling Kill zone + NY session inputs use TradingView’s session strings; `f_inSession()` drives both visual shading and whether FVG taps are tradeable when `killZoneOnly` is true. Session VWAP resets using cumulative price × volume sums that restart when the daily timestamp changes; rolling VWAP falls back to `ta.vwap(hlc3)` for instruments where daily resets are less relevant. Initial balance box (`rangeBars` input) locks once complete, extends forward, and stays on chart to contextualize later liquidity raids or breakouts. Parameter Reference Trend: `emaFastLen`, `emaSlowLen`, `htfResolution`, `htfEmaLen`, `showEmaRibbon`, `showHtfBiasLine`. Momentum: `tf1`, `tf2`, `tf3`, `rsiLen`, `stochLen`, `stochSmooth`, `heatmapHeight`. Volume/Liquidity: `volLookback`, `volSpikeMult`, `zScoreLen`, `zScoreThreshold`, `equalLookback`. VWAP & Sessions: `vwapMode`, `showVwapLine`, `vwapAlertDisplace`, `killSession`, `nySession`, `showSessionShade`, `rangeBars`. FVG/Risk: `fvgMinTicks`, `fvgLookback`, `fvgMinSpacing`, `killZoneOnly`, `liqTargetMultiple`, `swingLookback`. Visualization Toggles: `showSignalMarkers`, `showHeatmapBand`, `showInfoPanel`, `showStylizedCandles`. Workflow Recipes Kill-Zone Continuation: During the defined kill session, look for `killFvgLong` or `killFvgShort` arrows that line up with `sentimentValid` and positive `momoComposite`. Use the HUD’s risk readout to confirm SL/TP distances before entering. VWAP Raid Fade: Outside kill zone, track `raidToVwapLong/Short`. Confirm the candle body exceeds the displacement multiplier, and price crosses back toward VWAP before considering reversions. Range Break Monitor: After the initial balance locks, mark `rangeBreakLong/Short` circles only when the momentum band is >0 or <0 respectively and a fresh FVG box sits near price. Liquidity Spike Review: When the HUD shows “Liquidity” timestamps, hover the plotted squares at chart bottom to see whether spikes were buy/sell oriented and if local FVGs formed immediately after. Metadata Author: officialjackofalltrades Platform: TradingView (Pine Script v6) Category: Sentiment + Liquidity Intelligence Hope you Enjoy! אינדיקטור Pine Script®מאת officialjackofalltrades46
Linda Raschke 5 SMA Reversal [LuciTech]How This Indicator Works: -5 SMA Tracking: Calculates a 5-period simple moving average and plots it on the chart. -Extension Counter: Counts consecutive bars where price closes above or below the 5 SMA. -BUY Signals (Green Up Arrow): Triggers when price closes BELOW the 5 SMA after 7+ consecutive closes ABOVE it—indicates a reversal opportunity into dynamic support. -SELL Signals (Red Down Arrow): Triggers when price closes ABOVE the 5 SMA after 7+ consecutive closes BELOW it—indicates a reversal bounce setup. -No Repainting: Signals only plot on confirmed bar closes; no repainting issues. Linda Raschke's Core Principles: -Extended Run = Imbalance: When price stays above/below the 5 SMA for 7+ bars, it's a one-sided market; mean reversion is likely. -First Cross = Trigger: The first close back across the SMA after an extension is the reversal signal, not every touch. -No Setup? No Trade: Without a prior extension or "three-bar balance" filter, a 5 SMA tag is noise. The model requires the prior momentum condition. -Uptrend Buys: In uptrends, buy dips to the SMA (dynamic support) as long as the weekly/monthly trend is intact. -Downtrend Fades: In downtrends, treat first rallies above the SMA as bounce fades into lower lows (especially after 14+ bars below).אינדיקטור Pine Script®מאת TradesLuci16
LJ Parsons Harmonic Time StampsPurpose of the Script This script is designed to divide a specific time period on a market chart (from startDate to endDate) into fractional segments based on mathematically significant ratios. It then plots vertical lines at the first candle that occurs at or after each of these fractional timestamps. Each line is labeled according to an interval scheme, as outlined by LJ Parsons "Structured Multiplicative, Recursive Systems in Financial Markets" papers.ssrn.com Providing a symbolic mapping of time fractions zenodo.org Start (00) and End (00): Marks the beginning and end of the period. Intermediate labels (m2, M2, m3, M3, …): Represent divisions of the time period that correspond to specific fractions of the whole. This creates a visual “resonance map” along the price chart, where the timing of price movements can be compared to mathematically significant points. Parsons Market Resonance Theory proposes that markets move in patterns that are not random but resonate with underlying mathematical structures, analogous to logarithmic relationships. The key ideas reflected in this script are: Temporal Fractional Resonance By marking fractional points of a defined time period, the script highlights potential moments when market activity might “resonate” due to cyclical patterns. These points are analogous to overtones in music—certain times may have stronger market reactions. Mapping Market Movements to "Just Intonation" Intervals Assigning Interval labels to fractional timestamps provides a symbolic framework for understanding market behaviour. For example, the midpoint (P5) may correspond to strong market turning points, while minor or major intervals (m3, M6) might correspond to subtler movements. Identifying Potentially Significant Points in Time The plotted lines do not predict price direction but rather identify temporal markers where price movements may be more likely to display structured behaviour. Traders or researchers can then study price reactions around these lines for correlations with market resonance patterns. In essence, the script turns a period of time into a harmonic structure, with each line and label acting like a “note” in the market’s temporal symphony. It’s a tool to visualize and test whether price behaviour aligns with the resonant fractions hypothesized in MRT.אינדיקטור Pine Script®מאת wallabimba2
Focus On Work time (Tehran)If you only want to analyze the market during specific working hours and ignore the rest, this indicator is for you. It lets you hide or highlight non-working times on your chart, so you can focus only on the sessions that matter to you. Just set your start time and end time for the work session. By default, the time is set to UTC+3:30 (Tehran time), but you can change it to any timezone you like.אינדיקטור Pine Script®מאת msadeghjoveini10
XAUUSD 9/1 and 6/4 zone lane chart (BUY zone and SELL zone)XAUUSD 9/1 and 6/4 zone lane chart (BUY zone and SELL zone)אינדיקטור Pine Script®מאת usarov1987_212236
RSI Forecast Colorful [DiFlip]RSI Forecast Colorful Introducing one of the most complete RSI indicators available — a highly customizable analytical tool that integrates advanced prediction capabilities. RSI Forecast Colorful is an evolution of the classic RSI, designed to anticipate potential future RSI movements using linear regression. Instead of simply reacting to historical data, this indicator provides a statistical projection of the RSI’s future behavior, offering a forward-looking view of market conditions. ⯁ Real-Time RSI Forecasting For the first time, a public RSI indicator integrates linear regression (least squares method) to forecast the RSI’s future behavior. This innovative approach allows traders to anticipate market movements based on historical trends. By applying Linear Regression to the RSI, the indicator displays a projected trendline n periods ahead, helping traders make more informed buy or sell decisions. ⯁ Highly Customizable The indicator is fully adaptable to any trading style. Dozens of parameters can be optimized to match your system. All 28 long and short entry conditions are selectable and configurable, allowing the construction of quantitative, statistical, and automated trading models. Full control over signals ensures precise alignment with your strategy. ⯁ Innovative and Science-Based This is the first public RSI indicator to apply least-squares predictive modeling to RSI calculations. Technically, it incorporates machine-learning logic into a classic indicator. Using Linear Regression embeds strong statistical foundations into RSI forecasting, making this tool especially valuable for traders seeking quantitative and analytical advantages. ⯁ Scientific Foundation: Linear Regression Linear regression is a fundamental statistical method that models the relationship between a dependent variable y and one or more independent variables x. The general formula for simple linear regression is: y = β₀ + β₁x + ε where: y = predicted variable (e.g., future RSI value) x = explanatory variable (e.g., bar index or time) β₀ = intercept (value of y when x = 0) β₁ = slope (rate of change of y relative to x) ε = random error term The goal is to estimate β₀ and β₁ by minimizing the sum of squared errors. This is achieved using the least squares method, ensuring the best linear fit to historical data. Once the coefficients are calculated, the model extends the regression line forward, generating the RSI projection based on recent trends. ⯁ Least Squares Estimation To minimize the error between predicted and observed values, we use the formulas: β₁ = Σ((xᵢ - x̄)(yᵢ - ȳ)) / Σ((xᵢ - x̄)²) β₀ = ȳ - β₁x̄ Σ denotes summation; x̄ and ȳ are the means of x and y; and i ranges from 1 to n (number of observations). These equations produce the best linear unbiased estimator under the Gauss–Markov assumptions — constant variance (homoscedasticity) and a linear relationship between variables. ⯁ Linear Regression in Machine Learning Linear regression is a foundational component of supervised learning. Its simplicity and precision in numerical prediction make it essential in AI, predictive algorithms, and time-series forecasting. Applying regression to RSI is akin to embedding artificial intelligence inside a classic indicator, adding a new analytical dimension. ⯁ Visual Interpretation Imagine a time series of RSI values like this: Time → RSI → The regression line smooths these historical values and projects itself n periods forward, creating a predictive trajectory. This projected RSI line can cross the actual RSI, generating sophisticated entry and exit signals. In summary, the RSI Forecast Colorful indicator provides both the current RSI and the forecasted RSI, allowing comparison between past and future trend behavior. ⯁ Summary of Scientific Concepts Used Linear Regression: Models relationships between variables using a straight line. Least Squares: Minimizes squared prediction errors for optimal fit. Time-Series Forecasting: Predicts future values from historical patterns. Supervised Learning: Predictive modeling based on known output values. Statistical Smoothing: Reduces noise to highlight underlying trends. ⯁ Why This Indicator Is Revolutionary Scientifically grounded: Built on statistical and mathematical theory. First of its kind: The first public RSI with least-squares predictive modeling. Intelligent: Incorporates machine-learning logic into RSI interpretation. Forward-looking: Generates predictive, not just reactive, signals. Customizable: Exceptionally flexible for any strategic framework. ⯁ Conclusion By combining RSI and linear regression, the RSI Forecast Colorful allows traders to predict market momentum rather than simply follow it. It's not just another indicator: it's a scientific advancement in technical analysis technology. Offering 28 configurable entry conditions and advanced signals, this open-source indicator paves the way for innovative quantitative systems. ⯁ Example of simple linear regression with one independent variable This example demonstrates how a basic linear regression works when there is only one independent variable influencing the dependent variable. This type of model is used to identify a direct relationship between two variables. ⯁ In linear regression, observations (red) are considered the result of random deviations (green) from an underlying relationship (blue) between a dependent variable (y) and an independent variable (x) This concept illustrates that sampled data points rarely align perfectly with the true trend line. Instead, each observed point represents the combination of the true underlying relationship and a random error component. ⯁ Visualizing heteroscedasticity in a scatterplot with 100 random fitted values using Matlab Heteroscedasticity occurs when the variance of the errors is not constant across the range of fitted values. This visualization highlights how the spread of data can change unpredictably, which is an important factor in evaluating the validity of regression models. ⯁ The datasets in Anscombe’s quartet were designed to have nearly the same linear regression line (as well as nearly identical means, standard deviations, and correlations) but look very different when plotted This classic example shows that summary statistics alone can be misleading. Even with identical numerical metrics, the datasets display completely different patterns, emphasizing the importance of visual inspection when interpreting a model. ⯁ Result of fitting a set of data points with a quadratic function This example illustrates how a second-degree polynomial model can better fit certain datasets that do not follow a linear trend. The resulting curve reflects the true shape of the data more accurately than a straight line. ⯁ What Is RSI? The RSI (Relative Strength Index) is a technical indicator developed by J. Welles Wilder. It measures the velocity and magnitude of recent price movements to identify overbought and oversold conditions. The RSI ranges from 0 to 100 and is commonly used to identify potential reversals and evaluate trend strength. ⯁ How RSI Works RSI is calculated from average gains and losses over a set period (commonly 14 bars) and plotted on a 0–100 scale. It consists of three key zones: Overbought: RSI above 70 may signal an overbought market. Oversold: RSI below 30 may signal an oversold market. Neutral Zone: RSI between 30 and 70, indicating no extreme condition. These zones help identify potential price reversals and confirm trend strength. ⯁ Entry Conditions All conditions below are fully customizable and allow detailed control over entry signal creation. 📈 BUY 🧲 Signal Validity: Signal remains valid for X bars. 🧲 Signal Logic: Configurable using AND or OR. 🧲 RSI > Upper 🧲 RSI < Upper 🧲 RSI > Lower 🧲 RSI < Lower 🧲 RSI > Middle 🧲 RSI < Middle 🧲 RSI > MA 🧲 RSI < MA 🧲 MA > Upper 🧲 MA < Upper 🧲 MA > Lower 🧲 MA < Lower 🧲 RSI (Crossover) Upper 🧲 RSI (Crossunder) Upper 🧲 RSI (Crossover) Lower 🧲 RSI (Crossunder) Lower 🧲 RSI (Crossover) Middle 🧲 RSI (Crossunder) Middle 🧲 RSI (Crossover) MA 🧲 RSI (Crossunder) MA 🧲 MA (Crossover)Upper 🧲 MA (Crossunder)Upper 🧲 MA (Crossover) Lower 🧲 MA (Crossunder) Lower 🧲 RSI Bullish Divergence 🧲 RSI Bearish Divergence 🔮 RSI (Crossover) Forecast MA 🔮 RSI (Crossunder) Forecast MA 📉 SELL 🧲 Signal Validity: Signal remains valid for X bars. 🧲 Signal Logic: Configurable using AND or OR. 🧲 RSI > Upper 🧲 RSI < Upper 🧲 RSI > Lower 🧲 RSI < Lower 🧲 RSI > Middle 🧲 RSI < Middle 🧲 RSI > MA 🧲 RSI < MA 🧲 MA > Upper 🧲 MA < Upper 🧲 MA > Lower 🧲 MA < Lower 🧲 RSI (Crossover) Upper 🧲 RSI (Crossunder) Upper 🧲 RSI (Crossover) Lower 🧲 RSI (Crossunder) Lower 🧲 RSI (Crossover) Middle 🧲 RSI (Crossunder) Middle 🧲 RSI (Crossover) MA 🧲 RSI (Crossunder) MA 🧲 MA (Crossover)Upper 🧲 MA (Crossunder)Upper 🧲 MA (Crossover) Lower 🧲 MA (Crossunder) Lower 🧲 RSI Bullish Divergence 🧲 RSI Bearish Divergence 🔮 RSI (Crossover) Forecast MA 🔮 RSI (Crossunder) Forecast MA 🤖 Automation All BUY and SELL conditions can be automated using TradingView alerts. Every configurable condition can trigger alerts suitable for fully automated or semi-automated strategies. ⯁ Unique Features Linear Regression Forecast Signal Validity: Keep signals active for X bars Signal Logic: AND/OR configuration Condition Table: BUY/SELL Condition Labels: BUY/SELL Chart Labels: BUY/SELL markers above price Automation & Alerts: BUY/SELL Background Colors: bgcolor Fill Colors: fill Linear Regression Forecast Signal Validity: Keep signals active for X bars Signal Logic: AND/OR configuration Condition Table: BUY/SELL Condition Labels: BUY/SELL Chart Labels: BUY/SELL markers above price Automation & Alerts: BUY/SELL Background Colors: bgcolor Fill Colors: fill אינדיקטור Pine Script®מאת DiFlip22160
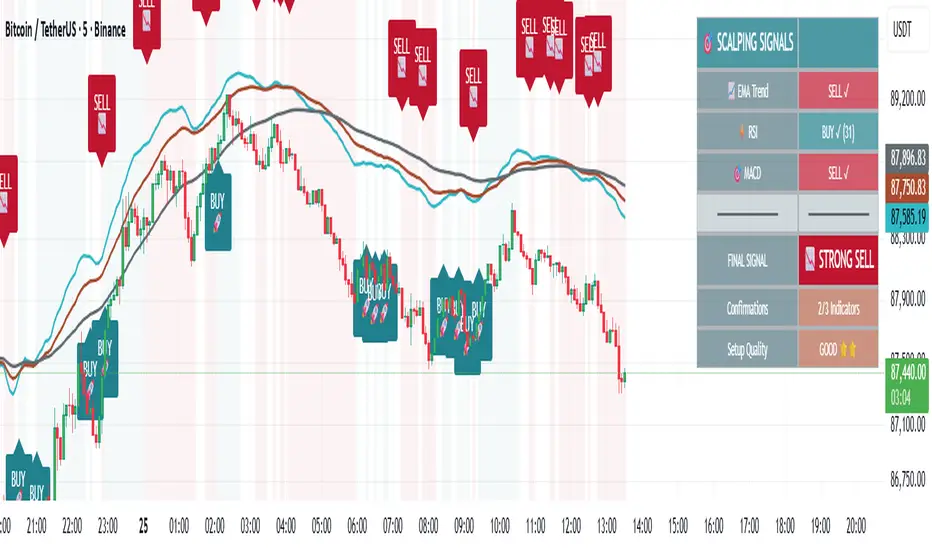
🎯 Advanced Scalping Indicator - Triple ConfirmationThis is the High Probability Scalping Indicator Risk Reward: 1:2/3/4 or keep trailing SLאינדיקטור Pine Script®מאת papabolte20
Hamaada RangeThis indicator plots the Daily DR/IDR range (19:30–23:00 NY) for each weekday, Monday to Friday. It automatically draws the Daily Range (DR) and Initial Daily Range (IDR) highs, lows, midlines, and opening price. Each day’s DR/IDR box extends into the following session for clarity and projection. All lines and colors are fully customizable per-day. Tracks 3-bar swings after the DR window closes. Automatically detects when price violates the DR high or low. Draws a “Swing Violation Line” from the last valid swing to the end of the extension period. Friday DR extends to next Monday and supports cross-week swing violation detection. Background shading, labels, and opening lines are optional. Designed for precision session modeling in NY timezone (America/New_York recommended).אינדיקטור Pine Script®מאת shariff09zמעודכן 19
Professional BOS IndicatorTrend Following indicator based on BOS, pullback and entryאינדיקטור Pine Script®מאת Samdwomoh25
Defended Price Levels (DPLs) — Melvin Dickover ConceptThis indicator identifies and draws horizontal “Defended Price Levels” (DPLs) exactly as originally described by Melvin E. Dickover in his trading methodology. Dickover observed that when extreme relative volume and extreme “freedom of movement” (volume-to-price-movement ratio) occur on the same bar, especially on bars with large gaps or unusually large bodies, the closing price (or previous close) of that bar very often becomes a significant future support/resistance level that the market later “defends.” This script automates the detection of those exact coincident spikes using two well-known public indicators: Relative Volume (RVI) • Original idea: Melvin Dickover • Pine Script implementation used here: “Relative Volume Indicator (Freedom Of Movement)” by LazyBear Link: Freedom of Movement (FoM) • Original idea and calculation: starbolt64 • Pine Script: “Freedom of Movement” by starbolt64 Link: How this indicator works Calculates the raw (possibly negative) LazyBear RVI and starbolt64’s exact FoM values Normalizes and standardizes both over the user-defined lookback Triggers only when both RVI and FoM exceed the chosen number of standard deviations on the same bar (true Dickover coincident-spike condition) Applies Dickover’s original price-selection rules (uses current close on big gaps or 2× body expansion candles, otherwise previous close) Draws a thin maroon horizontal ray only when the new level is sufficiently far from all previously drawn levels (default ≥0.8 %) and the maximum number of levels has not been reached Keeps the chart clean by limiting the total number of significant defended levels shown This is not a republish or minor variation of the two source scripts — it is a faithful automation of Melvin Dickover’s specific “defended price line” concept that he manually marked using the coincidence of these two indicators. Full credit goes to: Melvin E. Dickover — creator of the Defended Price Levels concept LazyBear — author of the Relative Volume (RVI) implementation used here starbolt64 — author of the Freedom of Movement indicator and calculation Settings (all adjustable): Standard Deviation Length (default 60) Spike Threshold in standard deviations (default 2.0) Minimum distance between levels in % (default 0.8 %) Maximum significant levels to display (15–80) Use these horizontal maroon lines as potential future support/resistance zones that the market has previously shown strong willingness to defend. Thank you to Melvin, LazyBear, and starbolt64 for the original work that made this automation possible.אינדיקטור Pine Script®מאת MonkeyPhone11
Multi-Timeframe Stochastic (4x) z Podświetlaniem - PawelA script that provides information when most of the stocks are in the overbought or oversold zone.אינדיקטור Pine Script®מאת ZawodSpekulant9
Multi-Timeframe RSI (4x) z Podświetlaniem - PawełRSI z podświetleniem z różnych tfów z ustawianiem intensywnosci i kolorów.אינדיקטור Pine Script®מאת ZawodSpekulant7