Volume Channel - [With Volume Filter]The indicator calculates two volume-weighted moving averages (VWMA) using different lengths, and filters them based on a moving average of volume. The filtered VWMA values are then plotted on the chart as lines, representing the fast and slow moving averages. In addition, upper and lower bands are calculated based on the slow VWMA and plotted as lines on the chart.
The fast and slow VWMA lines can be used to identify trends in the market. When the fast VWMA is above the slow VWMA, it is an indication of an uptrend, and when the fast VWMA is below the slow VWMA, it is an indication of a downtrend. The position of the VWMA lines relative to the upper and lower bands can also be used to identify potential trade signals.
When the price is near the upper band, it indicates that the market is overbought, and when the price is near the lower band, it indicates that the market is oversold. Traders can use these signals to enter or exit trades.
The indicator also includes a volume filter, which means that the VWMA values are only calculated when the volume is above a certain moving average of volume. This helps to filter out noise in the market and provide more accurate signals.
Explanation for each parameter
vwmaLength1: This is the length of the fast volume-weighted moving average (VWMA) used in the calculation. The default value is 10, and it can be adjusted by the user.
vwmaLength2: This is the length of the slow volume-weighted moving average (VWMA) used in the calculation. The default value is 25, and it can be adjusted by the user.
bandLength: This is the length of the moving average used to calculate the upper and lower bands. The default value is 34, and it is not adjustable by the user.
volumeFilterLength: This is the length of the moving average of volume used as a filter for the VWMA calculation. The default value is 5, and it can be adjusted by the user.
src: This is the input source for the VWMA calculation. The default value is close, which means the indicator is using the closing price of each bar. However, the user can select a different input source by changing this parameter.
filteredVwma1: This is the filtered VWMA calculated based on the volume filter and the fast VWMA length. It is plotted as a line on the chart and can be used to identify short-term trends.
filteredVwma2: This is the filtered VWMA calculated based on the volume filter and the slow VWMA length. It is plotted as a line on the chart and can be used to identify long-term trends.
ma: This is the moving average of the filtered slow VWMA values, which is used to calculate the upper and lower bands. It is plotted as a line on the chart.
offs: This is the offset used to calculate the upper and lower bands. It is based on the standard deviation of the filtered slow VWMA values and is multiplied by 1.6185 * 3. It is plotted as a line on the chart.
up: This is the upper band calculated as the moving average plus the offset. It is plotted as a line on the chart and can be used to identify overbought conditions.
dn: This is the lower band calculated as the moving average minus the offset. It is plotted as a line on the chart and can be used to identify oversold conditions.
Contraction-expansion

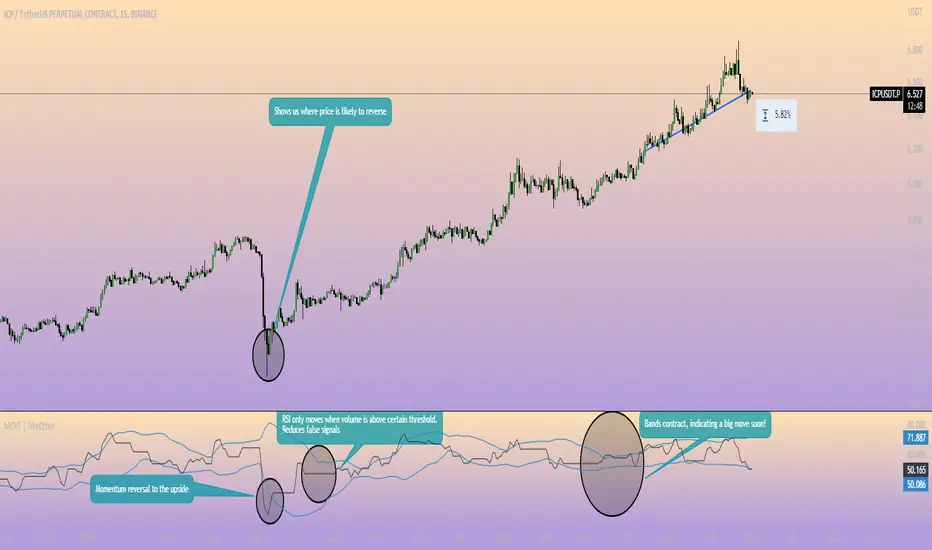
Momentum Channel - [Volume Filter]The indicator incorporates a volume filter to ensure that the RSI only moves when the volume is above the moving average of the volume.
The filtered RSI is then used to calculate the Bollinger Bands and moving averages, providing insights into the market dynamics.
It also gives you insight into the bigger timeframes so you can monitor momentum!
Volume Filter Length: Input parameter for the length of the volume filter moving average.
Overview of code:
rsiPeriod: Input parameter for the RSI period.
bandLength: Input parameter for the length of the Bollinger Bands.
lengthrsipl: Input parameter for the length of the fast moving average (MA) on the RSI.
volumeFilterLength: Input parameter for the length of the volume filter moving average.
volumeAvg: Calculates the moving average of the volume using the ta.sma() function with the specified volume filter length.
filteredRsi: Uses the ta.valuewhen() function to obtain the RSI value only when the volume is greater than or equal to the volume moving average. This creates a filtered RSI based on the volume filter.
offs: Calculates the offset value for the Bollinger Bands. It is derived by multiplying 1.6185 with the standard deviation of the filtered RSI using the ta.stdev() function.
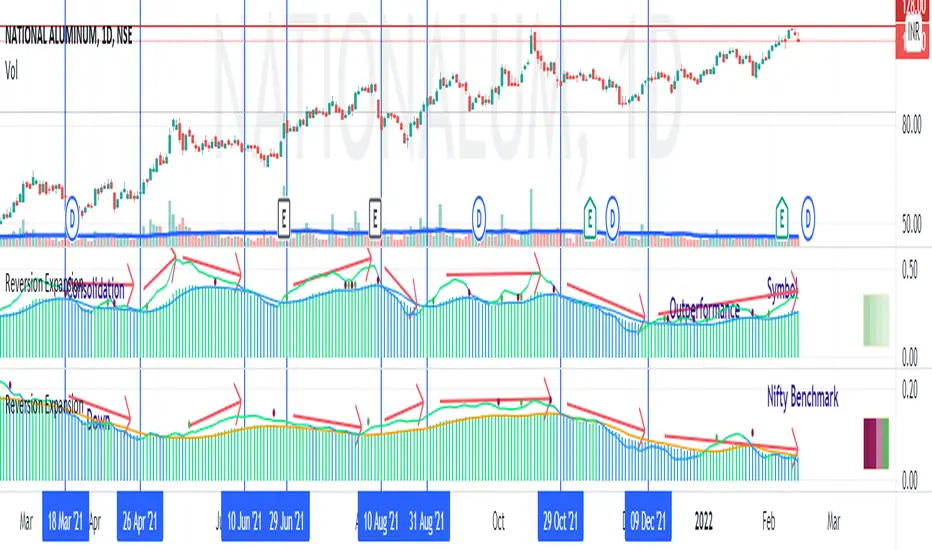
Price - Mean Reversion ExpansionA simple indicator, to plot the quantitatively the reversion and expansion of price from a set of means.
A green bar plots prices above the set of means. A bar plots prices below the set of means. A blue bar plots price entangled in the means. The height of the bars denotes the far-ness from the set of means.
A blue envelope over the bars is the average of this reversion/expansion. A "crossover" of any bar (red/green) over this envelope is indicated by a "green dot" a "crossunder" of any bar (red/green) under this envelope is indicated by a "red dot".
The small trend strength table (when enabled) on the right side below show in a easy manner the data presented in the " Mean Angles " indicator. Refer to description there for more details.
Volume Contraction and ExpansionA simple indicator that shows volume expansion and contraction of a trend through colorization of the candles. It indicates the underlying volume support of a trend. This indicator might come in handy for any Elliott Wave analyst trying to incorporate volume into his analysis.

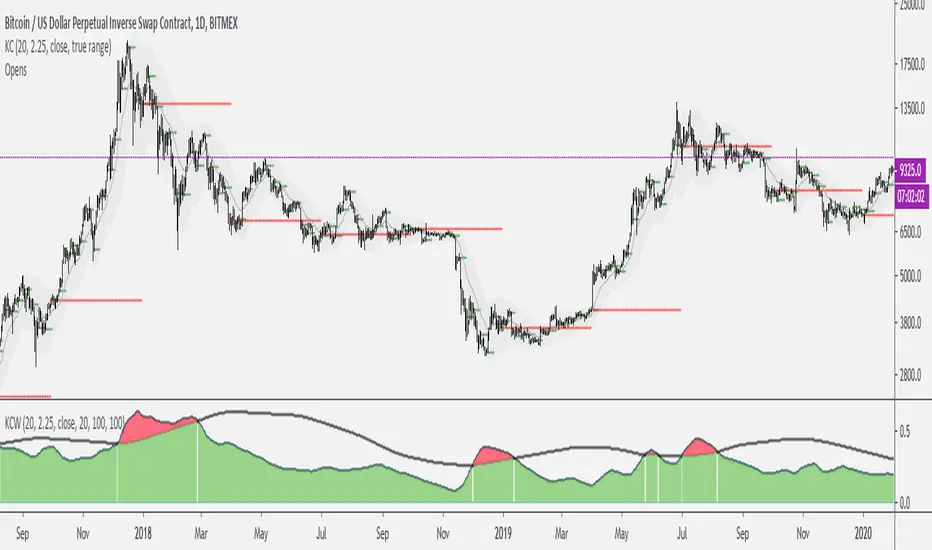
Keltner Channels WidthSimilar to bollinger bands width, but for keltner channels, designed to recognize when a move is exhausted and contraction is to be expected.
Would use it as a filter to stay out of any trades if the indicator peaks (red color).