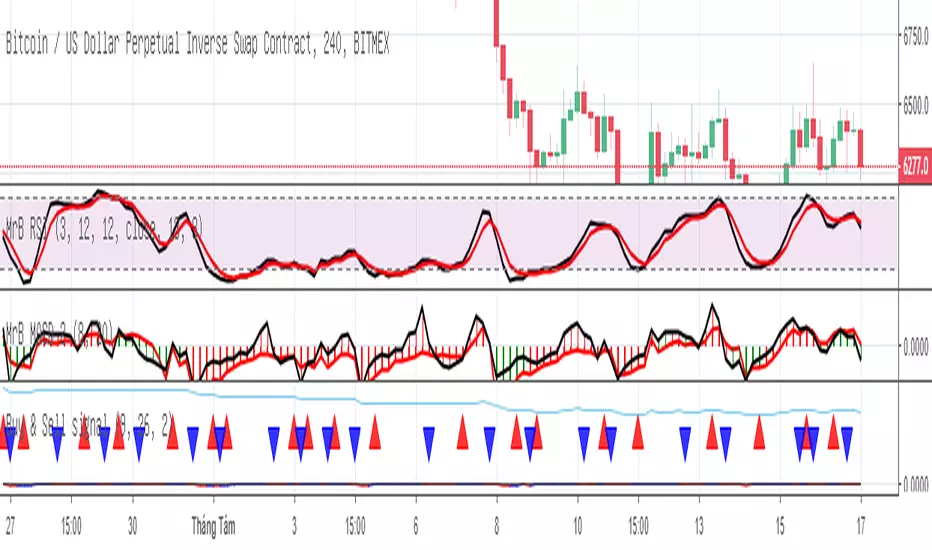
MACD for Buy & Sell signal indicatorMACD for Buy & Sell signal indicator last part of Buy and sell signal set. It was coded base on CCI source. Allow trader can read volume trade on market
1 set buy and sell signal
1- Buy & Sell signal indicator
2- RSI for Buy & Sell signal indicator
3- MACD for Buy & Sell signal indicator
*********************************************************************************************************************
Gửi anh chị trader đây là chỉ báo cuối cùng trong bộ chỉ báo tín hiệu mua bán. Là chỉ báo điều kiện sử dụng cùng với chỉ báo RSI để giúp cho nhà đầu tư đưa ra quyết định kịp thời dựa trên tổng số khối lượng gd thời điểm hiện tại
מטבע קריפטו

RSI for Buy & Sell signal indicatorRSI for Buy & Sell signal indicator
This indicator support for Buy & Sell signal indicator. Give advice for trader before make decision buy or sell. It was coded base on RSI source code + lengthStoch
Include 3 indicators in 1 set
1- Buy & Sell signal indicator
2- RSI for Buy & Sell signal indicator
3- MACD for Buy & Sell signal indicator
Feel free to inbox me for 3 days trial.
***************************************************************************************************************************************************
Gửi anh chị trader
Đây là chỉ báo điều kiện trong bộ chỉ báo gồm 3 chỉ báo tin hiệu mua và bán. Bộ chỉ báo này cung cấp những điều kiện cần và đủ trước khi vào lệnh về cơ bản chỉ là RSI nhưng được code riêng chỉ dành cho chỉ báo Buy & Sell signal indicator
Anh chị có nhu cầu vui lòng inbox test thử 3 ngày. Xin cảm ơn
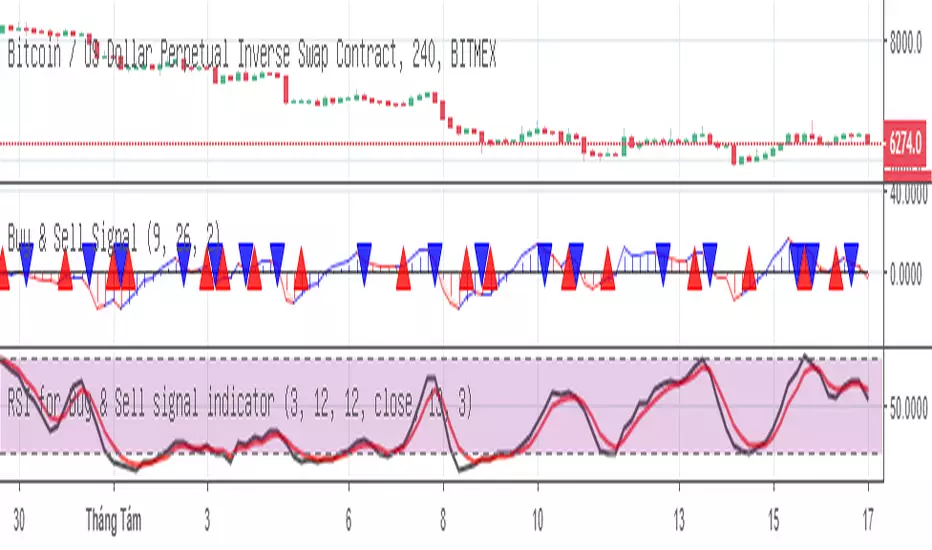
Buy & Sell signalBuy & Sell signal indicator
This indicator allow trader know the signal when have to buy or when have to sell. It was code based on MACD Cross. Only use for cryptocurrency market.
Total 3 indicator in 1 set
1- Buy & Sell signal indicator
2- RSI for Buy & Sell signal indicator
3- MACD for Buy & Sell signal indicator
Feel free to inbox me for 3 days trial.
**************************************************************************************************************************************
Bộ chỉ báo tín hiệu mua và bán
Đây là 1 trong bộ chỉ báo định hướng và hỗ trợ cho nhà giao dịch nhận biết thời điểm nên mua và nên bán trên thị trường tiền kỹ thuật số.
Bộ chỉ báo gồm 3 phần
1- Buy & Sell signal indicator
2- RSI for Buy & Sell signal indicator
3- MACD for Buy & Sell signal indicator
Anh chị có nhu cầu vui lòng inbox để được hướng dẫn sử dụng và 3 ngày dùng thử.
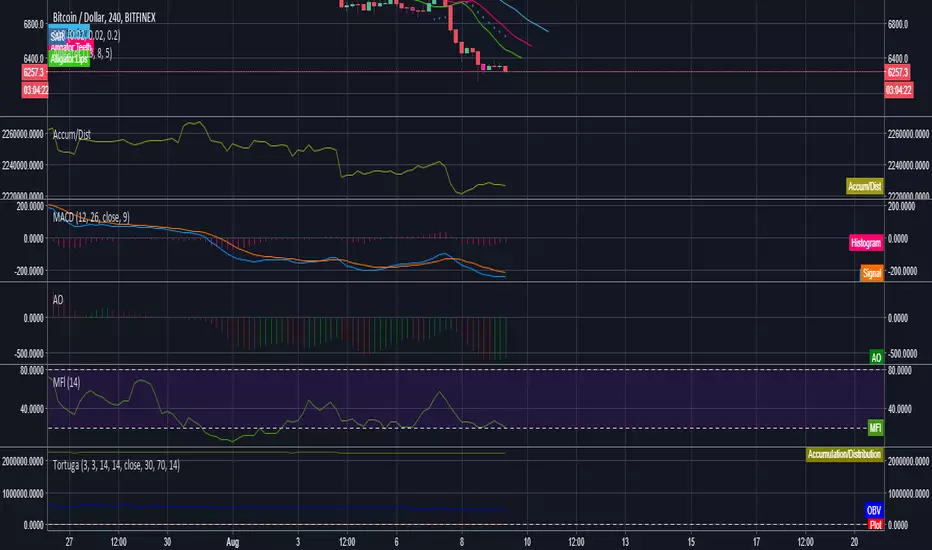
Tortuga IndicatorAfter long hours of figuring out what the fuck makes my indicator tick - the Tortuga indicator is finally finished. This indicator entails multiple conditions from indicators: AO, MACD, STOCH RSI, MFI, AD, and OBV. The help identify the most optimal Long or Short positions. The indicator also has been coded to identify Bullish and Bearish divergences on timeframes that have been tested to have a significant effect on prices. The indicator has been backtested to have a 75% win rate with long and short positions on timeframes: 15m, 30m, 45m, 1hr, 2hr, 3hr, and 4hr.
Indicator Guidelines/Legend:
Signals:
Blue Candle: Long Signal
Yellow Candle: Short Signal
Divergences:
Fuchsia Candle: 5 length Bull Divergence
Purple Candle: 10 length Bull Divergence
White Candle: 5 length Bear Divergence
Silver Candle: 10 length Bear Divergence
Gray Candle: 20 length Bear Divergence
The Divergence candles are merely suggestions and hints for potential price movements. While they have been shown to be effective position signals, they have not been backtested - stick with the Blue and Yellow candles.
This indicator is for sale with a monthly fee, DM for details. The price will increase upon updates and successful forward testing.

Random Walk SimulationUnderstanding the Random Walk Simulation
This indicator randomly generates alternative price outcomes derived from the price movements of the underlying security. Monte Carlo methods rely on repeated random sampling to create a data set that has the same characteristics as the sample source, representing examples of alternate outcomes. The data set created using random sampling is called a “random walk”.
First, every bar in the time stamp is measured and put into a logarithmic population. Then, a sample is drawn at random from the population and is used to determine the next price movement of the random walk. This process is repeated fifteen times to visualise whether the alternative outcomes lie above or beneath the current market price of the security.
Random Walk Utility
The random walk generator allows users of the Monte Carlo to further understand how the Monte Carlo projection is generated by creating a visual representation of individual random walks. Trends that occur on the random walks may correlate to the historical price action of the underlying security.
You can find the Monte Carlo Simulator here:
Input Values
Select the “ Format ”, button located next to the indicator label to adjust the input values and the style.
The Random Walk indicator only has one user-defined input value that can be changed.
The Random_Variable randomises a set of random walks. If this variable is changed, it will run a fresh set of 15 random walks which will result in a slightly different outcome.
Adding the indicator to your chart multiple times using many different random variables will allow you to achieve a more accurate reading. Ideally, the Monte Carlo Simulator takes an average of these to be interpreted.
For more information on this indicator, the full PDF can be found here: www.kenzing.com

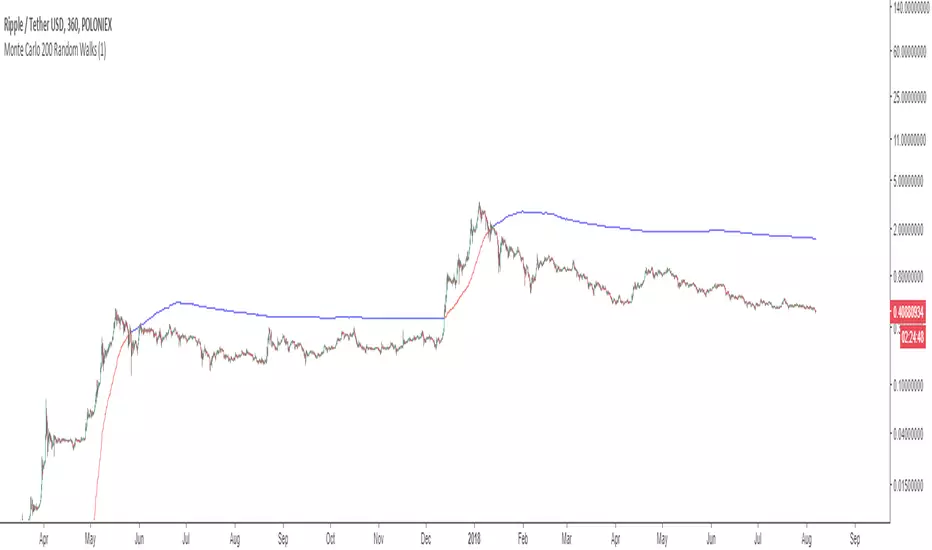
Monte Carlo Simulation (200 Random Walks)Understanding the Monte Carlo Simulation
This indicator uses Monte Carlo methods to predict the future price of a security using 200 random walks.
Monte Carlo methods rely on repeated random sampling to create a data set that has the same characteristics as the sample source, representing examples of alternate possible outcomes. The data set created using random sampling is called a “random walk”. Obtaining a mean from 200 random walks allows us to benchmark the performance of the source against the random walks obtained from the source.
Monte Carlo Utility
This Monte Carlo simulator plots a single line that represents 200 random walks across any security and time stamp. The line is red if most of the random walks are lower than the price of the security, and blue if the walks are higher.
Input Values
Select the “ Format ”, button located next to the indicator label to adjust the input values and the style.
The Monte Carlo indicator has only one user-defined input value that can be changed.
The Random_Variable determines set of random walks. If this variable is changed, it will run a fresh set
of 200 random walks which will result in a slightly different outcome. 200 random walks will load
relatively quick and produce roughly the same outcome as 10,000 random walks.
Adding the indicator to your chart multiple times using many different random variables will allow you
to achieve a more accurate reading.
For more information on this indicator view the PDF here: www.kenzing.com
Block Sale Transaction Alert!Understanding Block Transactions
Block transactions are transactions that are of a significantly high value. This can be a transaction of any
security that is large enough to have an impact on the market price and cause a flow-on effect of
investment that will ensue.
Block transactions are significant because the party who initiated the transaction is likely to be more
confident than the retail investor. Confidence can be assumed by the value of the transaction and the
source can be either,
a) an institutional fund with access to detailed and reliable information
or
b) a party with secret, insider knowledge that is currently undisclosed to the market.
For these reasons, being aware of block transactions is extremely important for anyone looking for a
new investment opportunity or risk management of current holdings.
Block Transaction Utility
This indicator is compatible with instant E-mail and SMS notifications so that the investor will be well
informed of institutional activity and make trading decisions quickly.
If a block transaction occurs, the user will be able to visualize whether it was a purchase or sale as it will
be textualized above or below the current bar if used with the Block Transaction Buy Alert found here:
Input Values
The visual representation of the transactions are customizable as you can adjust the shape, color, and
location by clicking “ Format ” at the top left of your chart, next to the indicator label.
Setting up Text message or E-mail Notifications
In order to receive the text message and/or email alerts, you will need to make sure the correct contact
information is saved in your TradingView® account settings.
For more information on this indicator, and setting up alerts, view this PDF: www.kenzing.com

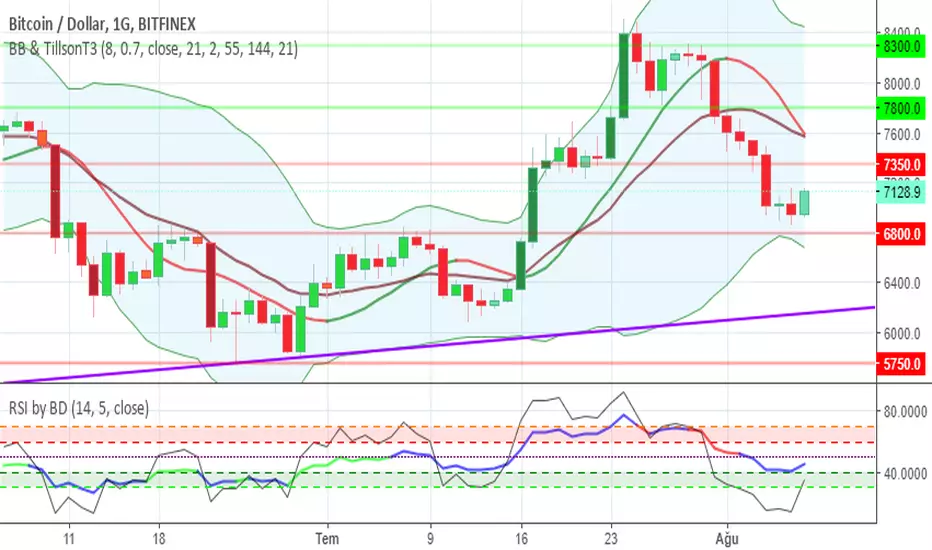

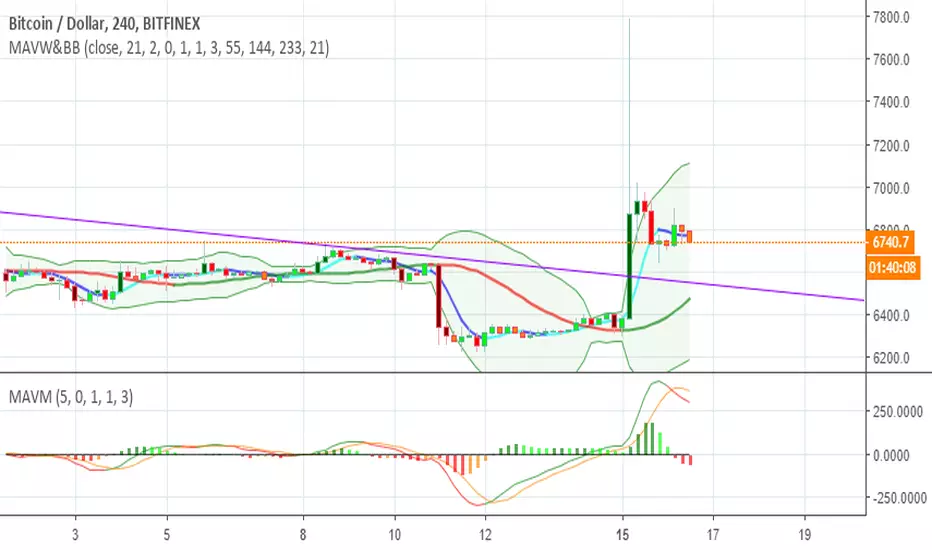
BB & TillsonT3 & MultiWMAbollinger band, tillsonT3 and When you want to open multiple WMA. Coloured Volume Bar as bonus

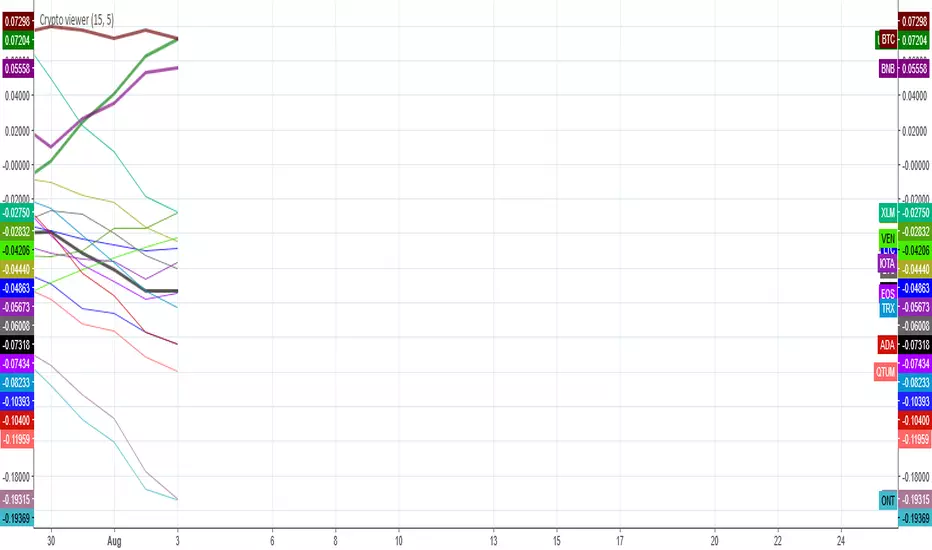
Crypto MeasurerI'm proud to finally announce the Crypto measurer!!!, 20 coins chosen from the selection available at Binance, you're free to modify the code to add your own coins or remove them or if you use another exchange.
This works similar to the SCSM, except it's for cryptos, never miss a PUMP & DUMP scheme again, don't get tricked into buying the losing coins anymore. The stronger coins are at the top while the losing coins at the bottom, works on any TF too, but be careful of volatility in lower TFs.
This picture is only of ETH and BTC, see how ethereum rallies in mid april until mid may, then bitcoin becomes the more dominating coin and remains like that, pushing ETH/BTC lower.
Again, here it's the chart for ETH and BNB, with the corresponding comparison.
And here is LTC/BTC to finish the comparisons.
EdgeAnalysisGroup: Fibbonaci BarsPrivate Message me for more info and EAG Scripts
-------------------------------------------
Colored bars based on EAG Fib MA script.
Potentials:
colorA changes to colorB going down = Open Short or Short Continuation
colorA changes to colorB going up = Open Long or Long Continuation
colorA changes to colorB and the next bar is colorA = Reversal Pattern
Based if used with the Yume Wave or a crypto modified RSI indicator
to determine the likelyhood of color reverse or breakout

Tersus Bollinger Bands Scalping Indicator V1.1Tersus Scalping Indicator
Tersus Scalping Indicator places buy and sell signals for Bitcoin in key areas using Bollinger Bands, Moving Averages, and Trend Analysis.
This indicator is very easy to use and makes for a great second opinion when trading.
The buy and sell positions are marked with B for buy and S for sell, in addition adds to position are market with red and green triangles.
The Bollinger Bands show general constriction and turn from red to green depending on market conditions. Red meaning bearish market, and green meaning bullish.
There are a number of lines all over the place and at first glance they can seem daunting. This is what they mean. The green and yellow dotted lines mark sell target stages 1 and 2, and buy target stages 1 and 2. The red dotted line is your buy and sell stop. The light blue is your buy and sell entry.
The candles also change color depending on if things are over sold or over bought using the Stochastic RSI. Purple for overbought and yellow/orange for oversold. The bars will also change to light blue during entry.
This should be limited to the 15 minute time frame for now. I have noticed some very good signals on the daily and some other time frames but this was written for 15 so don't expect it to be as accurate.
For purchasing information please direct message me.


DachsundAlright so I updated the Holy Trinity Script because its not three indicators now its at least 5 indicator conditions that result in colored candles.
Blue Candles: Sell Alert, implies that now might be a good time to sell. If you hold through multiple blue candles, average out the two prices and create your stop loss there.
White Candles: Sell signal, implies that you should probably sell. I've made it to where a white candle is seldom rare, so if you have not sold by then - take this as a signal and not a warning.
Black Candles: Long Alert, implies that a good buy area is incoming. You can buy on black candles but I would not do it with high leverage. I've weeded out conditions that make black candles appear in a bear trend, but low leverage is still always necessary for these candles.
Yellow Candles: Long Signal, The Golden Signal, The Dachshund. Buy here for the love of Christ, that's all it is saying. Hold strong, better room for higher leverage, hold for a while and reap the benefits. If you miss a candle like this it isn't too late feel free to go long as long as the price is within a reasonable percentage. Never chase pumps ;)
Best if used on 30min, 45min, and 1hr-4hr.

Cyclone, modified Fisher derivateEhler's modified fisher derivate with cleaner trends (red - downtrend, green - uptrend)

Ppsignal Ultra RSI [DW]Lagurre RSI oscillator, buy when the rsi signal cross up to 20 line and sell when the price cross down to 80 line point.


Bitcoin Long/Short Ratio V2 + Bottom AlertVersion 2 of my Bitcoin Long/Short Ratio with the addition of a market bottom alert. Enjoy.

Bitcoin Long/Short Ratio V2 + Bottom AlertVersion 2 of my Bitcoin Long/Short Ratio with the addition of a bottom alert (column = red). Enjoy :)

SmartWave Algorithm v2We've updated a fan favorite with some more kick ass features!
Version 2 of SmartWave Algorithm brings additional options such as :
- Take Profit - Set your profit target percent - Can be used along with AutoView alerts or any other similar bot
- Stop Loss - Set a stop loss target percent - Same as above, plays nice with AutoView
- Trend Filters - Disable Buy and/or Sells in either up trends or down trends
See the original SmartWave Algorithm here :
Want Access? Visit CryptoProTools.com For More Info
Have Questions? Message here or join our Discord via the link on our websites contact page
