Ichimoku Theories [LuxAlgo]The Ichimoku Theories indicator is the most complete Ichimoku tool you will ever need. Four tools combined into one to harness all the power of Ichimoku Kinkō Hyō.
This tool features the following concepts based on the work of Goichi Hosoda:
Ichimoku Kinkō Hyō: Original Ichimoku indicator with its five main lines and kumo.
Time Theory: automatic time cycle identification and forecasting to understand market timing.
Wave Theory: automatic wave identification to understand market structure.
Price Theory: automatic identification of developing N waves and possible price targets to understand future price behavior.
🔶 ICHIMOKU KINKŌ HYŌ
Ichimoku with lines only, Kumo only and both together
Let us start with the basics: the Ichimoku original indicator is a tool to understand the market, not to predict it, it is a trend-following tool, so it is best used in trending markets.
Ichimoku tells us what is happening in the market and what may happen next, the aim of the tool is to provide market understanding, not trading signals.
The tool is based on calculating the mid-point between the high and low of three pre-defined ranges as the equilibrium price for short (9 periods), medium (26 periods), and long (52 periods) time horizons:
Tenkan sen: middle point of the range of the last 9 candles
Kinjun sen: middle point of the range of the last 26 candles
Senkou span A: middle point between Tankan Sen and Kijun Sen, plotted 26 candles into the future
Senkou span B: midpoint of the range of the last 52 candles, plotted 26 candles into the future
Chikou span: closing price plotted 26 candles into the past
Kumo: area between Senkou pans A and B (kumo means cloud in Japanese)
The most basic use of the tool is to use the Kumo as an area of possible support or resistance.
🔶 TIME THEORY
Current cycles and forecast
Time theory is a critical concept used to identify historical and current market cycles, and use these to forecast the next ones. This concept is based on the Kihon Suchi (translating to "Basic Numbers" in Japanese), these are 9 and 26, and from their combinations we obtain the following sequence:
9, 17, 26, 33, 42, 51, 65, 76, 129, 172, 200, 257
The main idea is that the market moves in cycles with periods set by the Kihon Suchi sequence.
When the cycle has the same exact periods, we obtain the Taito Suchi (translating to "Same Number" in Japanese).
This tool allows traders to identify historical and current market cycles and forecast the next one.
🔹 Time Cycle Identification
Presentation of 4 different modes: SWINGS, HIGHS, KINJUN, and WAVES .
The tool draws a horizontal line at the bottom of the chart showing the cycles detected and their size.
The following settings are used:
Time Cycle Mode: up to 7 different modes
Wave Cycle: Which wave to use when WAVE mode is selected, only active waves in the Wave Theory settings will be used.
Show Time Cycles: keep a cleaner chart by disabling cycles visualisation
Show last X time cycles: how many cycles to display
🔹 Time Cycle Forecast
Showcasing the two forecasting patterns: Kihon Suchi and Taito Suchi
The tool plots horizontal lines, a solid anchor line, and several dotted forecast lines.
The following settings are used:
Show time cycle forecast: to keep things clean
Forecast Pattern: comes in two flavors
Kihon Suchi plots a line from the anchor at each number in the Kihon Suchi sequence.
Taito Suchi plot lines from the anchor with the same size detected in the anchored cycle
Anchor forecast on last X time cycle: traders can place the anchor in any detected cycle
🔶 WAVE THEORY
All waves activated with overlapping
The main idea behind this theory is that markets move like waves in the sea, back and forth (making swing lows and highs). Understanding the current market structure is key to having realistic expectations of what the market may do next. The waves are divided into Simple and Complex.
The following settings are used:
Basic Waves: allows traders to activate waves I, V and N
Complex Waves: allows traders to activate waves P, Y and W
Overlapping waves: to avoid missing out on any of the waves activated
Show last X waves: how many waves will be displayed
🔹 Basic Waves
The three basic waves
The basic waves from which all waves are made are I, V, and N
I wave: one leg moves
V wave: two legs move, one against the other
N wave: Three legs move, push, pull back, and another push
🔹 Complex Waves
Three complex waves
There are other waves like
P wave: contracting market
Y wave: expanding market
W wave: double top or double bottom
🔶 PRICE THEORY
All targets for the current N wave with their calculations
This theory is based on identifying developing N waves and predicting potential price targets based on that developing wave.
The tool displays 4 basic targets (V, E, N, and NT) and 3 extended targets (2E and 3E) according to the calculations shown in the chart above. Traders can enable or disable each target in the settings panel.
🔶 USING EVERYTHING TOGETHER
Please DON'T do this. This is not how you use it
Now the real example:
Daily chart of Nasdaq 100 futures (NQ1!) with our Ichimoku analysis
Time, waves, and price theories go together as one:
First, we identify the current time cycles and wave structure.
Then we forecast the next cycle and possible key price levels.
We identify a Taito Suchi with both legs of exactly 41 candles on each I wave, both together forming a V wave, the last two I waves are part of a developing N wave, and the time cycle of the first one is 191 candles. We forecast this cycle into the future and get 22nd April as a key date, so in 6 trading days (as of this writing) the market would have completed another Taito Suchi pattern if a new wave and time cycle starts. As we have a developing N wave we can see the potential price targets, the price is actually between the NT and V targets. We have a bullish Kumo and the price is touching it, if this Kumo provides enough support for the price to go further, the market could reach N or E targets.
So we have identified the cycle and wave, our expectations are that the current cycle is another Taito Suchi and the current wave is an N wave, the first I wave went for 191 candles, and we expect the second and third I waves together to amount to 191 candles, so in theory the N wave would complete in the next 6 trading days making a swing high. If this is indeed the case, the price could reach the V target (it is almost there) or even the N target if the bulls have the necessary strength.
We do not predict the future, we can only aim to understand the current market conditions and have future expectations of when (time), how (wave), and where (price) the market will make the next turning point where one side of the market overcomes the other (bulls vs bears).
To generate this chart, we change the following settings from the default ones:
Swing length: 64
Show lines: disabled
Forecast pattern: TAITO SUCHI
Anchor forecast: 2
Show last time cycles: 5
I WAVE: enabled
N WAVE: disabled
Show last waves: 5
🔶 SETTINGS
Show Swing Highs & Lows: Enable/Disable points on swing highs and swing lows.
Swing Length: Number of candles to confirm a swing high or swing low. A higher number detects larger swings.
🔹 Ichimoku Kinkō Hyō
Show Lines: Enable/Disable the 5 Ichimoku lines: Kijun sen, Tenkan sen, Senkou span A & B and Chikou Span.
Show Kumo: Enable/Disable the Kumo (cloud). The Kumo is formed by 2 lines: Senkou Span A and Senkou Span B.
Tenkan Sen Length: Number of candles for Tenkan Sen calculation.
Kinjun Sen Length: Number of candles for the Kijun Sen calculation.
Senkou Span B Length: Number of candles for Senkou Span B calculation.
Chikou & Senkou Offset: Number of candles for Chikou and Senkou Span calculation. Chikou Span is plotted in the past, and Senkou Span A & B in the future.
🔹 Time Theory
Show Time Cycle Forecast: Enable/Disable time cycle forecast vertical lines. Disable for better performance.
Forecast Pattern: Choose between two patterns: Kihon Suchi (basic numbers) or Taito Suchi (equal numbers).
Anchor forecast on last X time cycle: Number of time cycles in the past to anchor the time cycle forecast. The larger the number, the deeper in the past the anchor will be.
Time Cycle Mode: Choose from 7 time cycle detection modes: Tenkan Sen cross, Kijun Sen cross, Kumo change between bullish & bearish, swing highs only, swing lows only, both swing highs & lows and wave detection.
Wave Cycle: Choose which type of wave to detect from 6 different wave types when the time cycle mode is set to WAVES.
Show Time Cycles: Enable/Disable time cycle horizontal lines. Disable for better performance.
how last X time cycles: Maximum number of time cycles to display.
🔹 Wave Theory
Basic Waves: Enable/Disable the display of basic waves, all at once or one at a time. Disable for better performance.
Complex Waves: Enable/Disable complex wave display, all at once or one by one. Disable for better performance.
Overlapping Waves: Enable/Disable the display of waves ending on the same swing point.
Show last X waves: 'Maximum number of waves to display.
🔹 Price Theory
Basic Targets: Enable/Disable horizontal price target lines. Disable for better performance.
Extended Targets: Enable/Disable extended price target horizontal lines. Disable for better performance.
Cycle

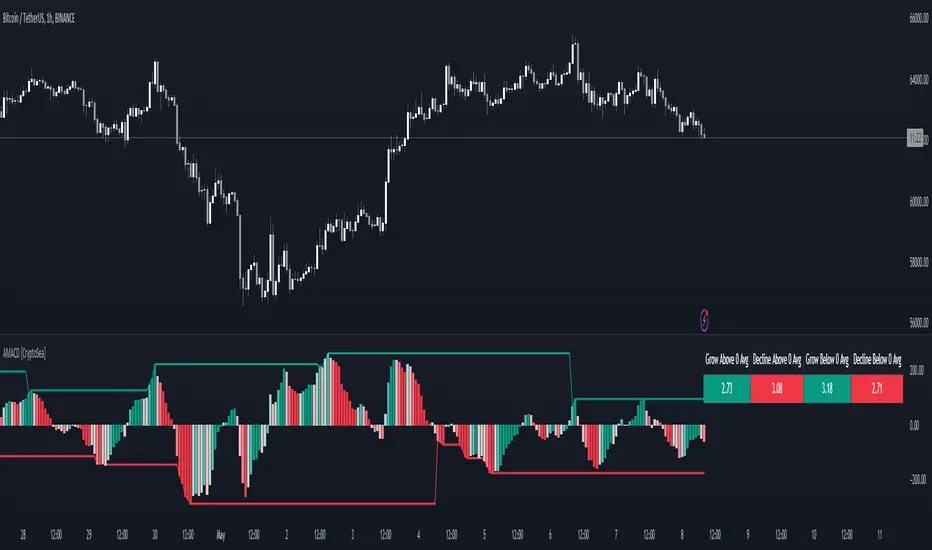
Advanced MACD [CryptoSea]Advanced MACD (AMACD) enhances the traditional MACD indicator, integrating innovative features for traders aiming for deeper insights into market momentum and sentiment. It's crafted for those seeking to explore nuanced behaviors of the MACD histogram, thus offering a refined perspective on market dynamics.
Divergence moves can offer insight into continuation or potential reversals in structure, the example below is a clear continuation signal.
Key Features
Enhanced Histogram Analysis: Precisely tracks movements of the MACD histogram, identifying growth or decline periods, essential for understanding market momentum.
High/Low Markers: Marks the highest and lowest points of the histogram within a user-defined period, signaling potential shifts in the market.
Dynamic Averages Calculation: Computes average durations of histogram phases, providing a benchmark against historical performance.
Color-Coded Histogram: Dynamically adjusts the histogram's color intensity based on the current streak's duration relative to its average, offering a visual cue of momentum strength.
Customisable MACD Settings: Enables adjustments to MACD parameters, aligning with individual trading strategies.
Interactive Dashboard: Showcases an on-chart table with average durations for each phase, aiding swift decision-making.
Settings & Customisation
MACD Settings: Customise fast length, slow length, and signal smoothing to tailor the MACD calculations to your trading needs.
Reset Period: Determine the number of bars to identify the histogram's significant high and low points.
Histogram High/Lows: Option to display critical high and low levels of the histogram for easy referencing.
Candle Colours: Select between neutral or traditional candle colors to match your analytical preferences.
When in strong trends, you can use the average table to determine when to look to get into a position. This example we are in a strong downtrend, we then see the histogram growing above the average in these conditions which is where we should look to get into a shorting position.
Strategic Applications
The AMACD serves not just as an indicator but as a comprehensive analytical tool for spotting market trends, momentum shifts, and potential reversal points. It's particularly useful for traders to:
Spot Momentum Changes Utilise dynamic coloring and streak tracking to alert shifts in momentum, helping anticipate market movements.
Identify Market Extremes Use high and low markers to spot potential market turning points, aiding in risk management and decision-making.
Alert Conditions
Above Average Movement Alerts: Triggered when the duration of the MACD histogram's growth or decline is unusually long, these alerts signal sustained momentum:
Above Zero: Alerts for both growing and declining movements above zero, indicating either continued bullish trends or potential bearish reversals.
Below Zero: Alerts for growth and decline below zero, pointing to potential bullish reversals or confirmed bearish trends.
High/Low Break Alerts: Activated when the histogram reaches new highs or falls to new lows beyond the set thresholds, these alerts are crucial for identifying shifts in market dynamics:
Break Above Last High: Indicates a potential upward trend as the histogram surpasses recent highs.
Break Below Last Low: Warns of a possible downward trend as the histogram drops below recent lows.
These alert conditions enable traders to automate part of their market monitoring or potential to automate the signals to take action elsewhere.
Global Net Liquidity (TG fork)Worldwide net liquidity, with trend coloring.
Global Net Liquidity attempts to represent worldwide net liquidity, and is defined as: Fed + Japan + China + UK + ECB - RRP - TGA , Where the first five components are central bank assets.
On TradingView, the indicator can be reproduced with the following equations: Global Net Liquidity = FRED:WALCL + FRED:JPNASSETS * FX_IDC:JPYUSD + CNCBBS * FX_IDC:CNYUSD + GBCBBS * FX:GBPUSD + ECBASSETSW * FX:EURUSD + RRPONTSYD + WTREGEN
However, this indicator adds a moving average cloud, and margin coloring, which eases historical trend assessment at a glance.
This indicator can be seen as an alternative representation of the accumulation/distribution indicator (and hence the same terms can be used in this description).
The Moving Average Cloud is simply the filling between the moving average (by default an EMA) and the current value. This feature was inspired by D7R ACC/DIST closed-source indicator, kudos to D7R for making such neat visual indicators.
Usage instructions:
Blue is more likely a phase of accumulation because the current value is above its historical price as defined by the moving average,
red is when this is more likely a phase of distribution.
Yellow is when the difference is below the margin, so we consider it is insignificant and that the trend is undecided. This can be disabled by setting the margin to 0.
While the color indicates if it's more likely an accumulation (blue) or distribution (red) phase or undecided (yellow), the cloud's vertical size allows to assess the strength of this tendency and the horizontal size the momentum, so that the bigger the cloud, the stronger the accumulation (if cloud is blue) or distribution (if cloud is red).
Why is that so? This is because the cloud represents the difference between the current tendency and the moving averaged past one, so a bigger cloud represents a bigger departure from recently observed tendencies. In practice, when there is accumulation, a pump in price can be expected soon, or if it already happened then it means it is indeed supported by volume, whereas if distribution, either a dump is to be expected soon, or if it already happened it means it's supported by volume.
Or maybe not necessarily a dump, but if there is a move upward in price, but the indicator indicates a strong distribution, then it means that the price movement is not supported and may not be sustainable (reversal may happen at anytime), whereas if price is going upward AND there is an accumulation (blue coloring) then it is more sustainable. This can be used to adapt strategies accordingly (risk on/risk off depending on whether there is concordance of both price and accumulation/distribution).
This indicator also includes sentiment signals that can be used to trigger alarms.
This indicator is a remix of Dharmatech's, who authored the first this Global Net Liquidity equation, kudos to them! Please show them some love if you like this indicator!

Sequencer [LuxAlgo]The Sequencer indicator is a tool that is able to highlight sequences of prices based on their relative position to past prices, which allows a high degree of customization from the user.
Two phases are included in this script, a "Preparation" phase and a "Lead-Up" phase, each with a customizable amount of steps, as well as other characteristics.
Users can also highlight the last step leading to each phase completion with a level, this level can eventually be used as a key price point.
🔶 USAGE
The script highlights two phases, each being based on a sequence of events requiring prices to be higher/lower than prices various bars ago.
The completion of the preparation phase will lead to the evaluation of the lead-up phase, however, it isn't uncommon to see a reversal occurring after the completion of a preparation phase. In the script, bullish preparations are highlighted in green, while bearish preparations are highlighted in red.
Completion of a "Lead-Up" phase is indicative of a potential reversal, with a bullish reversal for the completion of a bullish lead-up (in blue), and a bearish reversal for the completion of a bearish lead-up (in orange).
Using a higher length for the preparation/lead-up phases can allow the detection of longer-term reversals.
Users wishing to display levels based on specific phases completion can do so from the settings in the "Preparation/Lead-Up Completion Levels" settings group.
The "Show Last" settings determine the amount of respective levels to display on the chart.
🔶 PREPARATION PHASE
The "Preparation" phase precedes the "Lead-Up" phase. The completion of this phase requires N successive prices to be lower than the closing price P bars ago for a bullish phase, and for prices to be higher than the closing price P bars ago for a bearish phase, where N is the user set "Preparation Phase Length" and P the user set "Comparison Period".
🔹 Refined Preparations
Sequences of the preparation phase can either be "Standard" or "Refined". Unlike the standard preparation previously described a refined preparation requires the low prices from the user-specified steps in "Refined Preparation Steps" to be above the low price of the last step for a bullish preparation phase, and for the high prices specified in the refined preparation steps to be below the high price of the last step for a bearish preparation phase.
🔶 LEAD-UP PHASE
The "Lead-Up" phase is initiated by the completion of the "Preparation" phase.
Completion of this phase requires the price to be lower than the low price P bars ago N times for a bullish phase, and for prices to be higher than the high price P bars ago N times for a bearish phase, where N is the user set "Lead-Up Phase Length" and P the user set "Comparison Period".
Unlike with the "Preparation" phase these conditions don't need to be successive for them to be valid and can occur at any time.
🔹 Lead-Up Cancellation
Incomplete "Lead-Up" phases can be canceled and removed from the chart once a preparation of the opposite sentiment is completed, avoiding lead-ups to be evaluated after completion of complete preparations.
This can be disabled by toggling off "Apply Cancellation".
🔹 Lead-Up Suspension
Like with refined preparations, we can require specific steps from the lead-up phase to be higher/lower than the price on the last step. This can be particularly important since we do not require lead-up steps to be successive.
For a bullish lead-up, the low of the last step must be lower than the minimum closing prices of the user-specified steps for it to be valid, while for a bearish lead-up, the high of the last step must be higher than the maximum closing prices of the user-specified steps for it to be valid.
This effectively allows for eliminating lead-up phases getting completed on opposite trends.
🔶 SETTINGS
🔹 Preparation Phase
Preparation Phase Length: Length of the "Preparation" phase.
Comparison Period: Offset used to compare current prices to past ones.
Preparation Type: Type of preparation to evaluate, options include "Standard" or "Refined"
Refined Preparations Steps: Steps to evaluate when preparation type is "Refined"
🔹 Lead-Up Phase
Lead-Up Phase Length: Length of the "Lead-Up" phase.
Comparison Period: Offset used to compare current prices to past ones.
Suspension: Applies suspension rule to evaluate lead-up completion.
Suspension Steps: Specifies the steps evaluated to determine if the lead-up referral is respected. Multiple steps are supported and should be comma-separated.
Apply Cancellation: Cancellation will remove any incomplete lead-up upon the completion of a new preparation phase of the opposite sentiment.
🔹 Levels
Bullish Preparations Levels: When enabled display price levels from completed bullish preparations.
Show Last: Number of most recent bullish preparations levels to display.
Bearish Preparations Levels: When enabled display price levels from completed bearish preparations.
Show Last: Number of most recent bearish preparations levels to display.
Central Banks Balance Sheets ROI% ChangeIntroducing the "Central Banks Balance Sheets ROI% Change" indicator, a tool designed to offer traders and analysts an understanding of global liquidity dynamics.
This indicator tracks the Return on Investment (ROI) percentage changes across major central banks' balance sheets, providing insights into shifts in global economic liquidity not tied to cumulative figures but through ROI calculations, capturing the pulse of overall economic dynamics.
Key Enhancements:
ROI Period Customization: Users can now adjust the ROI calculation period, offering flexibility to analyze short-term fluctuations or longer-term trends in central bank activities, aligning with their strategic time horizons.
Chart Offset Feature: This new functionality allows traders to shift the chart view, aiding in the alignment of data visualization with other indicators or specific analysis needs, enhancing interpretive clarity.
Central Bank Selection: With options to include or exclude data from specific central banks among the world's top 15 economies (with the exception of Mexico and the consolidation of the EU's central bank data), traders can tailor the analysis to their regional focus or diversification strategies.
US M2 Option: Recognizing the significance of the M2 money supply as a liquidity metric, this indicator offers an alternative view focusing solely on the US M2, allowing for a concentrated analysis of the US liquidity environment.
Comprehensive Coverage: The tool covers a wide array of central banks, including the Federal Reserve, People's Bank of China, European Central Bank, and more, ensuring a broad and inclusive perspective on global liquidity.
Visualization Enhancements: A histogram plot vividly distinguishes between positive and negative ROI changes, offering an intuitive grasp of liquidity expansions or contractions at a glance.
This indicator is a strategic tool designed for traders who seek to understand the undercurrents of market liquidity and its implications on global markets.
Whether you're assessing the impact of central bank policies, gauging economic health, or identifying investment opportunities, the "Central Banks Balance Sheets ROI% Change" indicator offers a critical lens through which to view the complex interplay of global liquidity factors.
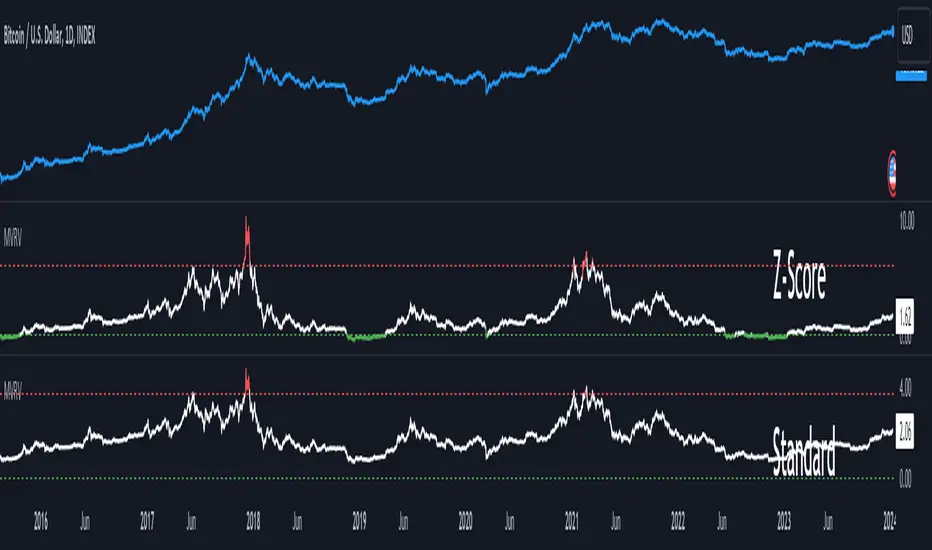
MVRV Z-ScoreThe MVRV ratio was created by Murad Mahmudov & David Puell. It simply compares Market Cap to Realised Cap, presenting a ratio (MVRV = Market Cap / Realised Cap). The MVRV Z-Score is a later version, refining the metric by normalising the peaks and troughs of the data.
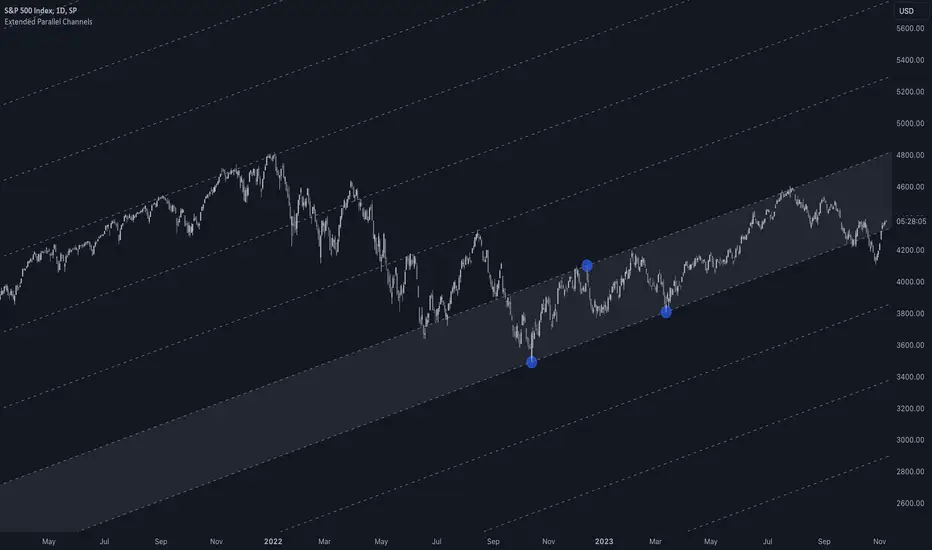
Extended Parallel ChannelsThis indicator provides an enhanced version of the popular Parallel Channel tool by allowing channel boundaries to be extended above and below the primary channel. It can also serve as a general tool for drawing parallel lines and grid lines to aid technical analysis.
🟠 Application
There are two primary ways extended channels can provide valuable insights:
🔵 Support and Resistance Levels
When prices break out of a channel, they often encounter strong resistance at approximately the 100% extension point. Breakout traders can utilize the extended channel boundary to place take-profit orders. Meanwhile, reversal traders can look for entry opportunities at this level.
🔵 Grid / Martingale Trading
Grid Trading and Martingale Trading strategies rely heavily on grid lines. This indicator streamlines that process by enabling traders to effortlessly plot grid lines across the chart.
🟠 Instructions
Upon adding the indicator, the user will be prompted to set the channel boundaries by placing three anchor points on the chart. The first two anchors determine one boundary line, while the third anchor determine the other boundary line.
Once the three anchors are positioned, the indicator automatically plots the resulting channel as well as the extended lines. The anchor points are highlighted as movable blue circles, allowing the user to dynamically adjust the channel formation by dragging the anchors to new locations as needed.
ZN Market CycleDescription
The purpose of this indicator is to create symbols that try to show the most accurate positions possible for trading. The formation of BUY/SELL symbols is based on the intersection of RSI, MACD and 6 bar moving average. Additionally, BOLLINGER bands were used to determine the lower and upper points. For example, while the price is falling, it will create an BOTTOM symbol when the price crosses the lower BOLLINGER band upwards. If this transition is accompanied by the RSI breaking its average upwards, it will produce the STRONG BOTTOM symbol. If the RSI average crosses the RSIMA direction upwards, it will produce the DEEP symbol. Of course, the scenario described above is also valid in the opposite direction. The purpose of the icons on the screen is indicated by the text above them. However, a detailed explanation of what these symbols do is given below.
Symbols
The symbols are explained one by one below.
BOTTOM: Indicates that the fall has slowed down or may have been completed.
STRONG BOTTOM: Indicates that the fall has stopped or may have been completed.
TOP: Indicates that the ascent has slowed down or may have been completed.
STRONG TOP: Indicates that the ascent has stopped or may have been completed.
BUY: Indicates the convenient location to make a buying. Buying pressure may increase after this symbol.
STRONG BUY: Indicates the most suitable location for buying. It should be considered that a strong buying wave may come after the appearance of this symbol.
SELL: Indicates the appropriate location to selling Selling pressure may increase after this symbol.
STRONG SELL: Indicates the most suitable position to selling. It should be considered that a strong selling wave may come after the appearance of this symbol.
PEAK: It indicates that the uptrend has come to an end.
DEEP: It indicates that the downtrend has come to an end.
ARROWS: Arrows show the trend direction. Since it varies a lot, it should be used to follow the trend rather than buy/sell. However, the appearance of a downward arrow shortly after a buy signal should suggest that the buy signal is fake. In this case, the buying position can be closed. This also applies to the selling process.
Best Use
This indicator should be used for SPOT trades. Regardless, since it is not possible to know exactly the direction of the market, it should be considered to buy gradually at buy signals and sell gradually at sell signals.
It should be followed for at least a 4-hour period. We do not recommend its use as the margin of error will increase in shorter time periods.
After a buy signal comes, a short decline may occur and the rise may begin. An immediate rise should not be expected after the signal arrives. Since the signals are not guaranteed to work 100%, we do not recommend you to trade with all your money.
No Repainting
Repainting is definitely not done. After the symbols appear, the closing should be expected. Once the closing occurs, the symbol will now be permanent.
Disclaimer
This indicator is for informational purposes only and should be used for educational purposes only. You may lose money if you rely on this to trade without additional information. Use at your own risk.
Version
v1.0

Market Time Cycle (Expo)█ Time Cycles Overview
Time cycles are a fascinating and powerful concept in the world of trading and investing. They are all about understanding and predicting the timing of market moves based on the premise that market events and price movements are not random, but instead occur in repeatable, cyclical patterns.
The Concept of Time Cycles: The foundation of time cycles lies in the belief that historical market patterns tend to repeat themselves over specific periods. These periods or cycles could be influenced by a myriad of factors like economic data releases, earnings reports, geopolitical events, or even natural human behavior. For example, some traders observe increased market activity around the start and end of a trading day, which is a form of intraday time cycle.
Understanding time cycles can provide traders with a roadmap, helping them anticipate potential trend shifts and make more informed decisions about when to buy or sell.
█ Indicator Overview
The Market Time Cycle (Expo) is designed to help traders track and analyze market cycles and generate signals for potential trading opportunities. It uses mathematical techniques to analyze market cycles and detect possible turning points. It does this by projecting the estimated cycle timeline and providing visual indications of cyclical phases through the use of color-coded lines and sine wave cycles.
Time cycles offer a compelling way to forecast market trends and time your trades better. By adding time cycles to your trading toolbox, you could potentially gain a new perspective on market movements and refine your trading strategy further. The indicator generates trading signals based on the sine wave's behavior. When the sine wave crosses certain thresholds, the indicator generates a signal suggesting a potential trading opportunity based on cycle behavior.
█ How to use
This indicator can be a valuable tool to help traders understand and predict market trends and time their trades more accurately. By visualizing the cyclic nature of markets, traders can better anticipate potential turning points and adjust their trading strategies accordingly. It helps traders to spot ideal entry and exit points based on the cyclical nature of financial markets.
█ Settings
You can customize the number of bars (NumbOfBars) that are taken into consideration for the cycle. Including a higher number of bars will provide more data, which can be helpful for analyzing long-term trends.
-----------------
Disclaimer
The information contained in my Scripts/Indicators/Ideas/Algos/Systems does not constitute financial advice or a solicitation to buy or sell any securities of any type. I will not accept liability for any loss or damage, including without limitation any loss of profit, which may arise directly or indirectly from the use of or reliance on such information.
All investments involve risk, and the past performance of a security, industry, sector, market, financial product, trading strategy, backtest, or individual's trading does not guarantee future results or returns. Investors are fully responsible for any investment decisions they make. Such decisions should be based solely on an evaluation of their financial circumstances, investment objectives, risk tolerance, and liquidity needs.
My Scripts/Indicators/Ideas/Algos/Systems are only for educational purposes!

Fierytrading: Volatility DepthDear Tradingview community,
I'd like to share one of my staple indicators with you. The volatility depth indicator calculates the volatility over a 7-day period and plots it on your chart.
This indicator only works for the DAILY chart on BTC/USD.
Colors
I've color coded the indicator as follows:
- Red: Extreme Volatility
- Orange: High Volatility
- Yellow: Normal Volatility
- Green: Low Volatility
Red: extreme changes in price. Often during local tops and bottoms.
Orange: higher than average moves in price. Often before or after a "red" period. Often seen in the middle of bear or bull markets.
Yellow: normal price action. Often seen during early stage bull-markets and late stage bear-markets.
Green: very low price movement. Often during times of indecision. Once this indicator becomes green, you can expect a big move in either direction. Low volatility is always followed by high volatility.
In a long-term uptrend, a green period often signals a bullish break out. In a long-term downtrend it often signals a bearish break out.
How to use
Save the indicator and apply it to your chart. You can change the length in the settings, but it's optimized for 7 days, so no need to change it.
I've build in alerts for all 4 different volatility periods. In most cases, the low volatility alert is enough.
Good luck!

Market Cycle IndicatorThe Market Cycle Indicator is a tool that integrates the elements of RSI, Stochastic RSI, and Donchian Channels. It is designed to detect market cycles, enabling traders to enter and exit the market at the most opportune times.
This indicator provides a unique perspective on the market, combining multiple strategies into one unified and weighted approach. By factoring in the inputs from each of these popular technical analysis methods, it offers a more holistic view of the market trends and cycles.
Parameter Details:
Donchian Channels (DCO):
- donchianPeriod: Sets the period for the Donchian Channel calculation. Default is set to 14.
- donchianSmoothing: Sets the smoothing factor for the Donchian Channel calculation. Default is set to 3.
- donchianPrice: Selects the price type to be used in the Donchian Channel calculation. Default is set to the closing price.
Relative Strength Index (RSI):
- rsiPeriod: Sets the period for the RSI calculation. Default is set to 14.
- rsiSmoothing: Sets the smoothing factor for the RSI calculation. Default is set to 3.
- rsiPrice: Selects the price type to be used in the RSI calculation. Default is set to the closing price.
Stochastic RSI (StochRSI):
- srsiPeriod: Sets the period for the Stochastic RSI calculation. Default is set to 20.
- srsiSmoothing: Sets the smoothing factor for the Stochastic RSI calculation. Default is set to 3.
- srsiK: Sets the period for the %K line in the Stochastic RSI calculation. Default is set to 5.
- srsiD: Sets the period for the %D line in the Stochastic RSI calculation. Default is set to 5.
- srsiPrice: Selects the price type to be used in the Stochastic RSI calculation. Default is set to the closing price.
Weights:
- rsiWeight: Sets the weight for the RSI in the final aggregate calculation. Default is set to 1.
- srsiWeight: Sets the weight for the Stochastic RSI in the final aggregate calculation. Default is set to 1.
- dcoWeight: Sets the weight for the Donchian Channel in the final aggregate calculation. Default is set to 1.
Limits:
- limitHigh: Sets the upper limit for the indicator. Default is set to 80.
- limitLow: Sets the lower limit for the indicator. Default is set to 20.
By customizing these parameters, users can tweak the indicator to align with their own trading strategies and risk tolerance levels. Whether you're a novice or an experienced trader, the Comprehensive Market Cycle Indicator provides valuable insights into the market's behavior.
Uses library HelperTA

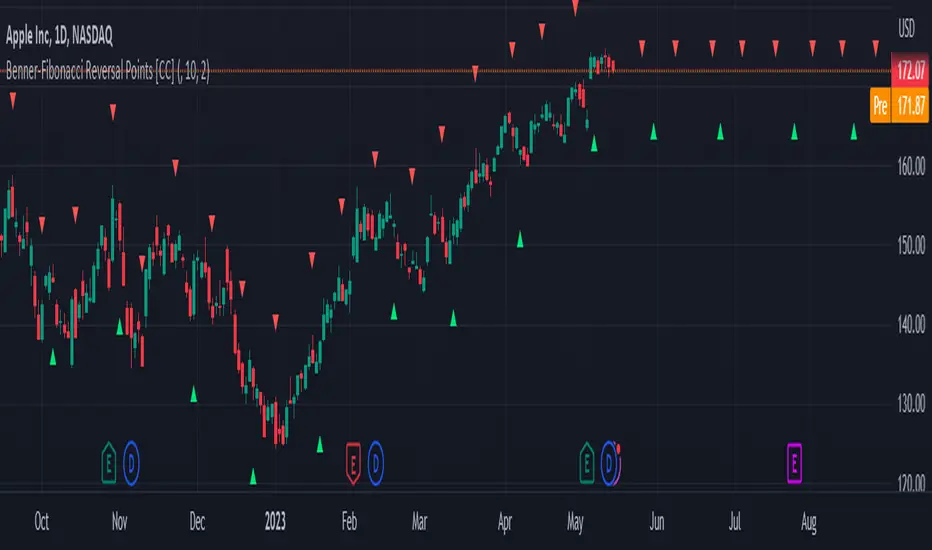
Benner-Fibonacci Reversal Points [CC]This is an original script based on a very old idea called the Benner Theory from the Civil War times. Benner discovered a pattern in pig iron prices (no clue what those are), and this turned out to be a parallel idea to indicators based on Fibonacci numbers. Because a year is 365 days (nearly 377, which is a Fibonacci number), made up of 52 weeks (nearly 55, which is another Fibonacci number), or 12 months (nearly 13, which is another Fibonacci number), Benner theorized that he could find both past and future turning points in the market by using a pattern he found. He discovered that peaks in prices seemed to follow a pattern of 8-9-10, meaning that after a recent peak, it would be 8 bars until the next peak, 9 bars until after that peak for the next, and 10 bars until the following peak. For past peaks, he would just need to reverse this pattern, and so the previous peak would be 10 bars before the most current peak, 9 bars before that peak, and 8 bars before the previous one, and these patterns seemed to repeat. For troughs, he found a pattern of 16,18,20 which follows the same logic, and this idea also seemed to work on long-term peaks and troughs as well.
This is my version of the Benner theory and the major difference between my version and his is that he would manually select a year or date and either work backwards or forwards from that point. I chose to go with an adaptive version that will automatically detect those points and plot those past and future points. I have included several options such as allowing the algorithm to be calculated in reverse which seems to work well for Crypto for some reason. I also have both short and long term options to only show one or both if you choose and of course the option to enable repainting or leave it disabled.
Big thanks to @HeWhoMustNotBeNamed and @RicardoSantos for helping me fix some bugs in my code and for @kerpiciwuasile for suggesting this idea in the first place.
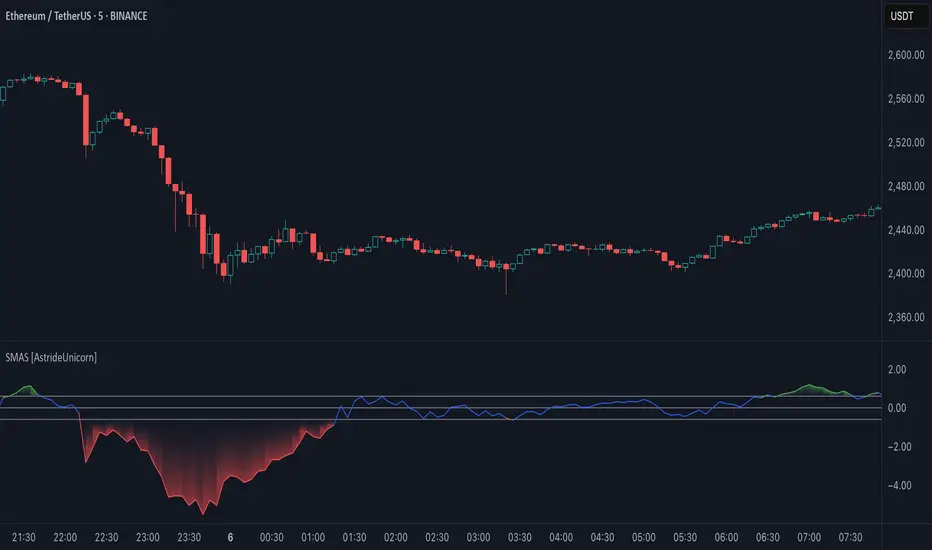
Simple Moving Average Slope [AstrideUnicorn]The Simple Moving Average Slope indicator (SMAS) is a technical analysis tool designed to help traders detect the direction and strength of the current trend in the price of an asset. It is also a great tool for identifying sideways markets. The indicator plots the slope of a simple moving average (SMA) of the closing prices over a specified time period. The slope is normalized by dividing it by the standard deviation of the slope over a longer time period.
HOW TO USE
Traders can use the Simple Moving Average Slope indicator in various ways. One common way is to look for bullish or bearish signals. A bullish signal occurs when the normalized slope rises above a predetermined threshold, resulting in the indicator turning green, indicating an upward trend in the market. Conversely, a bearish signal is generated when the normalized slope falls below the negative value of the threshold, causing the indicator to turn red, signaling a downtrend in the market. When the normalized slope falls between the positive and negative threshold values, a neutral signal is generated, indicating that the market is moving sideways. This can help traders avoid false trend signals from other indicators and strategies that may occur when the market is in a sideways regime. Additionally, traders can use the Simple Moving Average Slope indicator in conjunction with other technical indicators to confirm the trend direction.
SETTINGS
Window - specifies the number of bars used to calculate the SMA slope. The default value is 20.
Threshold - specifies the threshold value used to generate the bullish and bearish signals. The default value is 0.6. Traders can adjust these settings based on their trading strategy and the asset being analyzed.
Fed Projected Interest RatesThis script shows you the current interest rates by the FED (see ZQ symbol nearest expiration)
and the next expirations (see ZQ further expiration dates).
It is important to keep your expiration and descriptions up to date, to do that to the indicator inputs and change as you please.

RS Stage AnalysisThis script trying to detect different lifecycle of stock / Stages.
There is mainly 4 stages of stocks.
1) stage 1 - Accumulation = color = aqua
2) stage 2 - Advancing = color = green
3) stage 3 - Distribution = color = yellow
4) stage 4 - Declining = color = red
At some point the condition i wrote wont detect any stage.

Ehlers Stochastic Center Of Gravity [CC]The Stochastic Center Of Gravity Indicator was created by John Ehlers (Cybernetic Analysis For Stocks And Futures pgs 79-80), and this is one of the many cycle scripts that I have created but not published yet because, to be honest, I don't use cycle indicators in my everyday trading. Many of you probably do, so I will start publishing my big backlog of cycle-based indicators. These indicators work best with a trend confirmation or some other confirmation indicator to pair with it. The current cycle is the length of the trend, and since most stocks generally change their underlying trend quite often, especially during the day, it makes sense to adjust the length of this indicator to match the stock you are using it on. As you can see, the indicator gives constant buy and sell signals during a trend which is why I recommend using a confirmation indicator.
I have color-coded it to use lighter colors for normal signals and darker colors for strong signals. Buy when the line turns green and sell when it turns red.
Let me know if there are any other scripts you would like to see me publish!

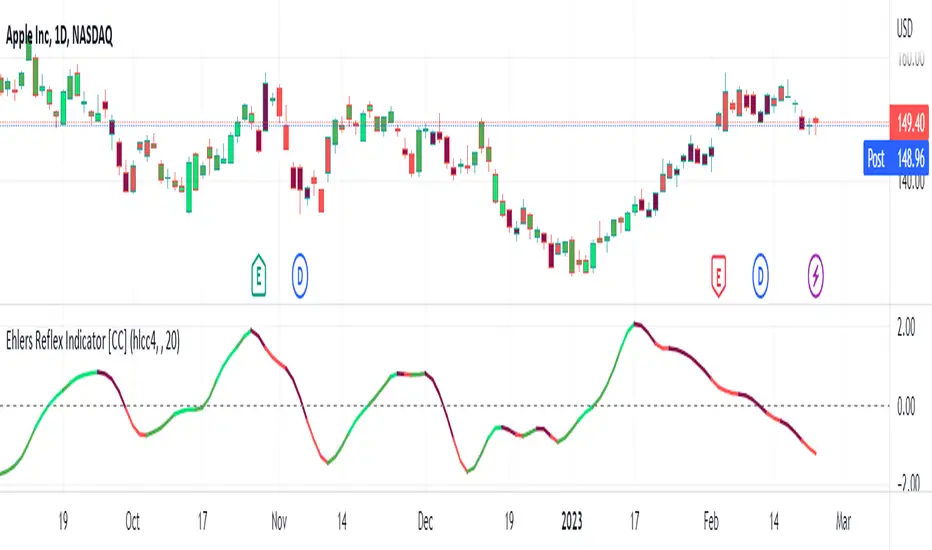
Ehlers Reflex Indicator [CC]The Reflex Indicator was created by John Ehlers (Stocks and Commodities Feb 2020) and this is a zero lag indicator that works similar to an overbought/oversold indicator but with the current stock cycle data. I find that this indicator works well as a leading indicator as well as a divergence indicator. Generally speaking, this indicator indicates a medium to long term downtrend when the indicator is below the line and a medium to long term uptrend when the indicator is above the line. Ehlers has created a few complementary indicators that I will release in the next few days but just keep in mind that this indicator focuses on the underlying cycle component while removing as much noise with no lag. I have color coded the lines to show strong signals with the darker colors and normal signals with the lighter colors. Buy when the line turns green and sell when it turns red.
Let me know if there are any other scripts you would like to see me publish!
Range Identifier*Re-upload as previous attempt was removed.
An attempt to create a half decent identifier of when the markets are ranging and in a state of choppiness and mean reversion - as opposed to in trending trade conditions.
It's super simple logic just working on some basic price action and market structure operating on higher time frames.
It uses the Donchian Channels but with hlc3 data as opposed to high/lows - and identifies periods in which the baseline is static, or when the channel upper & lower are contracting.
This combination identifies non trending price action with decreasing volatility, which tends to indicate a lot of upcoming chop and ranging/sideways action; especially when intraday trading and applied on the daily timeframe.
The filter increasing results in a decrease of areas identified as choppy by extending the required period of a sideways static basis, I've found values of 2 or 3 to be a nice sweetspot!
Overall should be pretty intuitive to use, when the background changes just consider altering your trading and investing approach. This was created as I've not really seen anything on here that functions quite the same.
I decided to not include the Donchian upper/lower/basis as I found that can often lead to decision bias and being influenced by where these lines are situated causing you to guess on future direction.
It's obviously never going to be perfect, but a nice and unbiased way to quickly check where we may be in a cycle; let me know if there are any issues/questions and please enjoy!

Stan Weinstein Trend IndicatorThis indicator is a trend indicator for trading charts based on the method of Stan Weinstein. It uses various technical methods to identify four trend phases on an asset: consolidation, advancement, plateauing, and decline. Users can customize the indicator by modifying parameters such as the periods for various calculations, such as the exponential moving average (EMA), the relative strength index (RSI), and support and resistance levels. The results of these calculations are then used to determine if an asset is in a phase of consolidation, advancement, plateauing, or decline.
The results are displayed as markers on the chart, with the following colors:
White: Consolidation
Green: Advancement
Blue: Plateauing
Red: Decline
According to the method of Stan Weinstein, it is recommended to buy an asset during an advancement phase and sell it during a plateauing phase. Similarly, it is recommended to sell an asset during a decline phase and cut this sale when the consolidation phase starts. It is important to note that this indicator is for informational purposes only and should not be used as investment advice. It is important to conduct fundamental and technical analysis before making an investment decision. It is also recommended to combine this analysis with other methods for optimal results and to consider the risks associated with any investment.
All default parameters of this indicator have been carefully chosen to provide the best possible results, however, it is possible to modify them according to personal preferences. It is important to note that modifying certain parameters may make the indicator less relevant and it is therefore recommended not to deviate too much from default values, unless you have a good understanding of the Stan Weinstein method and the technical indicators used.
It is important to note that this indicator is optimized for 1-week charts. It can be used to look at charts at other timeframes but calculations will always be based on weekly data.
Also, it is noteworthy that this indicator is optimized for cryptocurrencies, except Bitcoin, as it is used to calculate the relative strength of a token. However, you can choose the asset or index you want in the menu to calculate the relative strength. Furthermore, all the default settings are carefully chosen, but users are free to modify them, but doing so may result in less relevant results.

30MIN CYCLE█ HOW DOES IT WORK?
The known 90 min cycle is used as one killzone. But actually all 18 min are relevant to search for a trade. All 18 min when a new box starts only then is the placement of an order valid. If the entry candle isn't in a box then it will probably fail. The boxes should only be used in the M1 or M5 timeframe. The best hitrate is in the M1 timeframe. Included are the last 48 "Mini-Killzones" für intraday trading and backtesting. These "Mini-Killzones" can be used with the "Liquidity Inducement Strategy".
█ WHAT MAKES IT UNIQUE?
This is the first indicator on tradingview that shows all mini-killzones for trading and backtesting a whole tradingday. The well-known killzones of ICT are from 08:00-11:00 and 14:00 - 17:00 (UTC+1) but with this indicator there is finally a refinement of the ICT Smart Money Concept killzones.
█ HOW TO USE IT?
For a proper use of this indicator we suggest to know already at least SMC or better Liquidity Indcuement Trading. This indicator is a further confluence before placing an order. After you made your setup you will have these mini-killzones as a confluence. We don't suggest to open a trade only according to this indicator.
█ ADDITIONAL INFO
This indicator is free to use for all tradingview users.
█ DISCLAIMER
This is not financial advice.

AlexD Market annual seasonalityThe indicator displays the percentage of bullish days with a given date over several years.
This allows you to determine the days of the year when the price usually goes up or down.
Indicator has a built-in "simple moving average" shifted back by half a period, due to which the delay of this smoothing is removed.

Bitcoin Long Time Cycle Detection (RGB Box)Hi!
I tried to analyze bitcoin's cycles since the beggining at INDEX:BTCUSD (on 1D timeframe) using some tools like Moving Averages and Ichimoku Cloud and Fibonacci Levels based on ATH prices of each cyle. Each cycle type is represented by colors:
1- Green is when the price is going to have a new ATH compared to the last ATH
2- Red is when the price is going to move down from the last ATH
3- Blue is when the price seems not going down anymore and moving up go get to the last ATH
The result is very interesting because each cycle has similar behaviours. The Main cycle is when there is a Green, Red and Blue and then there will be a Green again for the new cycle.
Logic of detecting Red part some times makes a Red between two Green s (which is normal but it makes a bit difference in the behaviour of the last part of that shorter Red part) so the valuable part is the Blue !
You can see the interesting noticable similarity of the Blue 's price movement and duration (written in the boxes).
What I understood from this model about each part was:
In the Greens, strongest candles of the whole market appear with higher volumes. which are the shortest parts too.
in the Reds, we see a lot of hammer candles here, price moves down step by step (unless it is going to have a NEW ATH which makes the duration of Red part vert shorter than the main Red parts before the Blue). Temporary resistances make some range channels but finally the price will go down a lot!
in the Blues, the main weak uptrend from the bottom which is finally going to see its last ATH price, but very slowly and weakly compared to the Green part. Some times there will be a lot of temporary downtrends too but in the end, price is going up. this part maybe the best time to buy for long time holding.
What makes this model interesting is that cycles match fundamental events like HALVING and periodic cycle analyses based on that.
In the last cylce we haven't seen the Blue Signal yet! so there should be alot of more patient till we say there will be no more down.
I hope it gives you more insight on the long term trend of crypto. I would be glad to hear your ideas to improve the model.

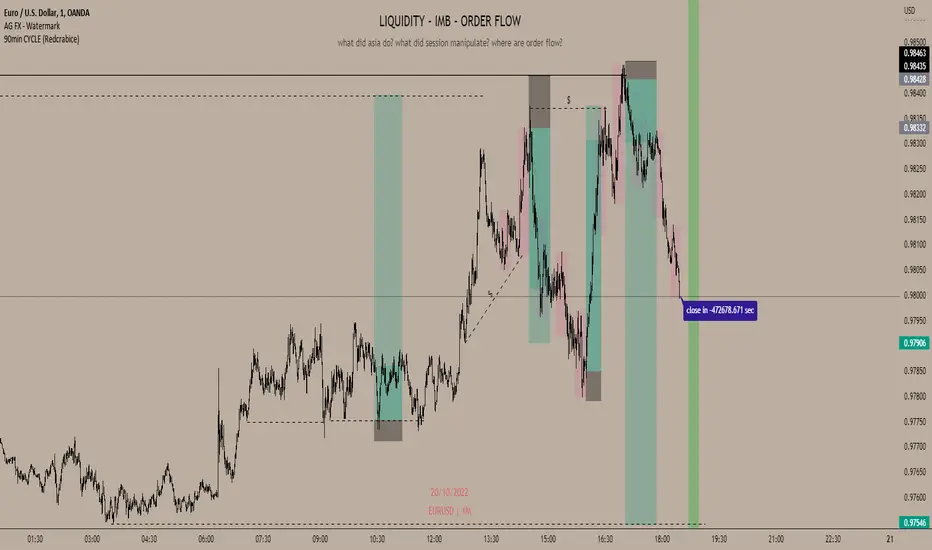
90min CYCLE (12-18) (Redcrabice)this script was created by REDCRABICEFX.
this script was originally created to help me and the people in my groups.
this script was created to help traders who use 90 min and 450min cycles. dividing 12 min session break with 18 min session. It also has a projection of the next 18 min session so you know when it will start.
this script also has a candle countdown closer to the candle for better sniping entries, it will start appearing when the candle has less than 15 seconds before close, and only works on a 1min TimeFrame.
you can add this to your favorite and uses it without my consense, however, the code is limited to me and people in my group to see to prevent monetization
you can change the color of the 18 min session and the projection
you can change the color of the time label, you can also dissable it.
story: I'm learning 90 min cycle and I needed an indicator that would show me the session without having to redraw every time and ended up with 50 vertical lines across my chart, there weren't any similar ideas that show me exactly how this is.
all codes were put together by me. all I used was the reference and never copied it. Let's hope it doesn't get moderated.