Standard deviation of the exponential moving average
This indicator emphasizes price movements when it moves away from or closer to the chosen moving average, within the envelope of its standard deviation. It serves as a complement to other indicators or can be used within a strategy by itself.
Deviation

Bias(Deviation Rate)Deviation rate (BIAS), by calculating the distance between the closing price and a moving average to reflect the reversal created by the degree of deviation between the price and the moving average during a certain period of time.
Above the zero axis is called positive deviation and belongs to the bullish zone, while below the zero axis is called negative deviation and belongs to the bearish zone.
Regardless of whether it is a positive deviation or a negative deviation, whenever the gap between the stock price and the moving average becomes larger, it means that the stock price has an overbought/oversold condition, and a high probability will result in a reversal.

Tradingview ToolkitA new trader's biggest barrier to entry is lack of understanding where they are in terms of time and price and with tradingview free they are often limited to just 1 or 2 extra indicators as many new traders slap on RSI and MACD as 2/3 free ones. While these indicators are fine for trend analysis, its important to know where the price is in relation to time. Thus, this all-in-one script is meant to have a lot of customizable utility to save on indicator spots and act as a hotspot for many common needs.
-2 Sets of VWAP line w/ standard deviation bands with customizable timeframes.
-1 more customizable timeframe VWAP line (no std dev bands) to use as a long time frame reference
-Ability to plot previous VWAP close prices over current timeframe on all VWAP lines w/ basic color changing if price closes above/below
-2 Sets of Bollinger Bands with customizable source length and MA type
-3 customizable moving averages with custom timeframe/resolutions
-Inside candle barcolor repainter to easily notice if a candle was inside the range of the previous candle (price contraction)
Not meant to have everything on at once, but simply a place to enable and disable different things and save spots for more important things

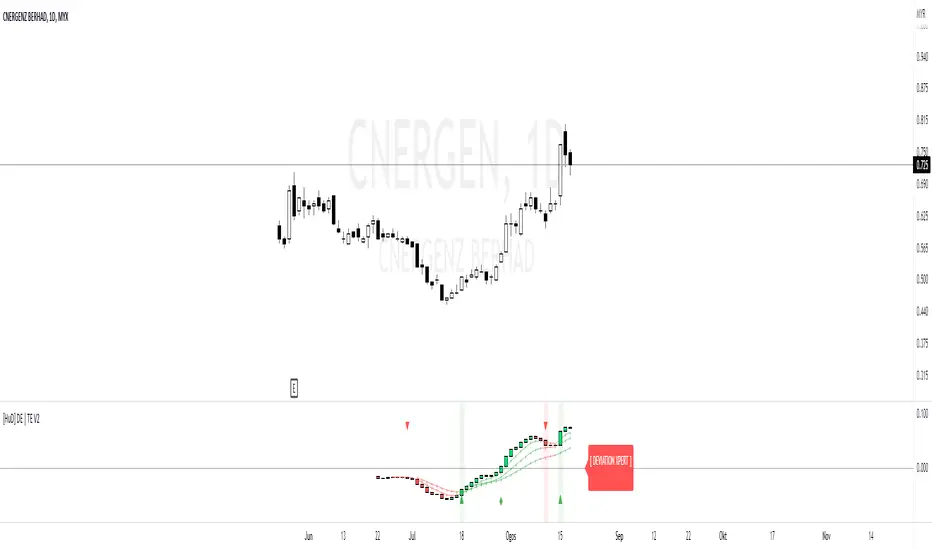
HuD DE | TEHuD DE | TE Expert is a combination of two indicators.
1. DE or Deviation Expert
DE is based on ema5 and ema20. This MA algorithm is to filter signals such as trend and convergence/divergence. It is represented by HA Candles.
There are 4 signals to assist traders in making decisions
i. Golden Cross = possible entry point ( Green Triangle )
ii. Death Cross = possible exit point ( Red Triangle )
iii. Cross Up Level 0 = look for Buy opportunity ( Green Diamond )
iv. Cross Down Level 0 = look for Sell opportunity ( Red Diamond )
There are also ema lines to monitor the movement of current candle movement.
2. TE or Trend Expert
TE is based on ema5 movement to assist traders to see the overall trend of chart movement.
The movement is represented by HA Candles.
There are 4 ema's lines to monitor HA Candles movements.
This lines act as support / resistance which can assist traders to see the current trend of the chart.
For example, if line is green ( Uptend) and the next candle drop below the first green ema lines, next line (ema10) acts as support.
If next candle breaks ema10, we can consider making an exit plan. Or for swing traders, they can consider waiting until candle drop below ema50 ( purple line ) before deciding to exit.
Note: This indicator setting only suitable for Bursa Malaysia market.
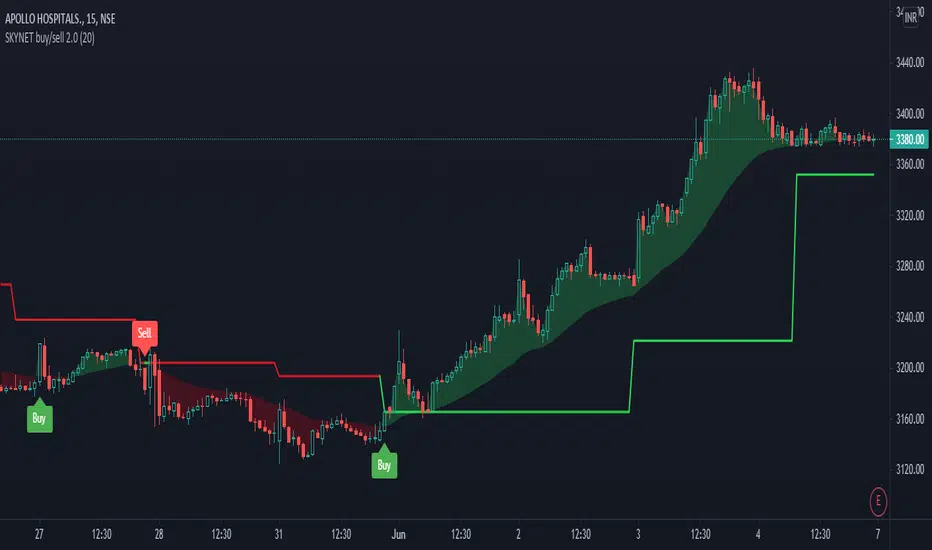
SKYNET buy/sell 2.0The SKYNET buy/sell 2.0 indicator generates buy and sell signals based on the following conditions:
**Anchor line : This anchor line is calculated based on certain parameters.
The anchor line is calculated in such a way that the stock/instrument moves around this anchor line.
The calculation of the anchor line uses a look back period which is set to 9 by default. The user can go to the indicator settings and change it to suit their trading style.
Note:
1) As the look back period increases, the number of signals generated on the chart decreases.
2) This indicator will only work on charts/stocks/instruments which are actually traded in the market i.e actual contracts of the stock/instrument is traded in the market. Hence, it will not work on indexes.
BUY signal: When the stock/instrument deviates to the upside of the anchor line by a specific margin, the Buy signal is generated.
SELL signal: When the stock/instrument deviates to the downside of the anchor line by a specific margin, the Sell signal is generated.
Disclaimer: This indicator is not 100% accurate and false signals are generated from time to time. Trading in the markets involves huge risks and one should always do his/her own research before making any trading decisions. This indicator is only designed to help you make a trading decision.
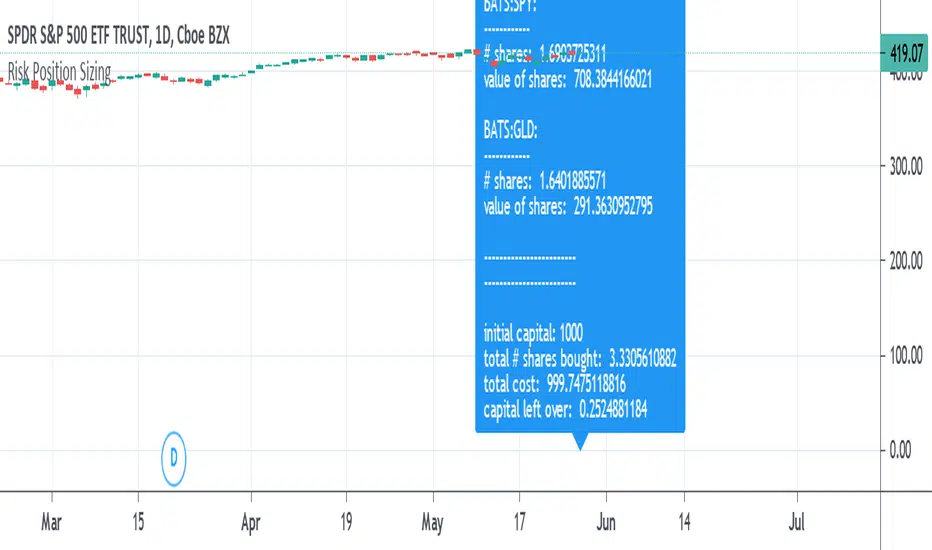
Risk Position Sizing tool using Coefficient of VariationA way to manage portfolio risk using relative standard deviation, also known as coefficient of variation. This tool tells you how much of each stock in shares and in value to buy adjusted for their volatility risk for a given starting account capital. A problem many people have is how to diversify an account and adjusting it for the risk involved in each equity. Many would put in an equal amount of capital value into each share but is it really equal if some equities have more risk than others? A solution is to adjust the portfolio by giving less weight to those that are more volatile or risky. It's done by using a starting percent of the account, preferably a small percent of it, and buying up shares with that same amount for each equity. Each equity will also be divided by the COV to risk adjust the portfolio by giving less weight to the more volatile stocks. This is done until as much of the initial capital in the account as possible is spent.
COV is how far away the price is from the mean or average. The further the price is from the mean the more risk or volatility there is. It uses standard deviation in its calculation. The problem with SD and ATR is that they are not relative to the past or to other equities to compare to. An application where COV can be used is risk portfolio management formulas. This does not take into account correlation or other equation parts in some portfolio management formulas but only the risk or volatility, the default volatility length is mostly arbitrary, and the lower risk stocks may end up being the slowest in performance.
The text label will show how many shares will be bought and how much value each equity will have. At the end it will show the initial capital that was started off with, the total shares bought, the total value of all the shares, and the amount of capital left over. If the sources are not blank then they will be used, to blank them you will need to reset the settings to default otherwise they might still be read. If you want to add more than the given 10 equity spaces to the portfolio then you will need to add in the code manually and add it to the chart. The denominator is perhaps the important part in these types of risk position sizing tools, you can change to other things such as risk-reward ratio instead of volatility or change the volatility type, etc.
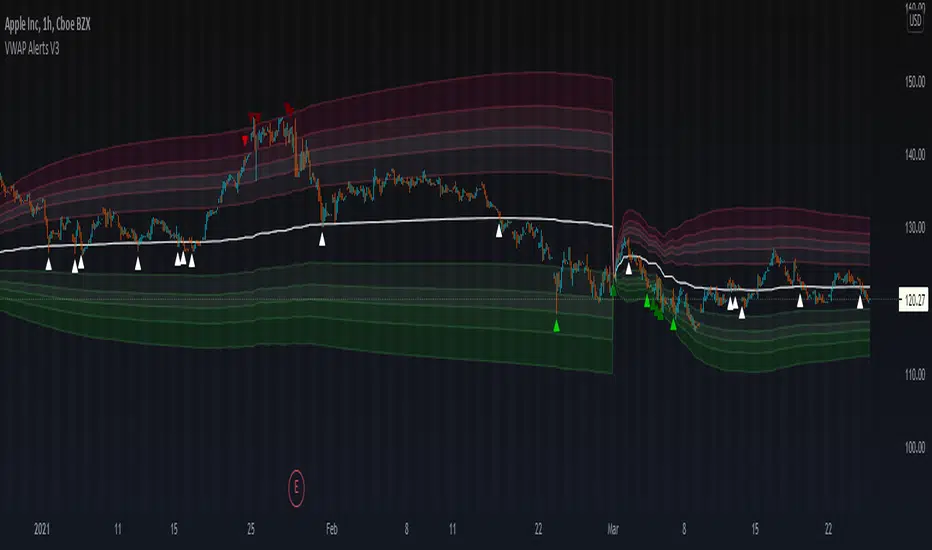
VWAP Alerts V3VWAP Alerts signal over bought/over sold conditions, relative to volume weighted average price, while deviation bands plot an extremely accurate point of mean reversion.
VWAP Alerts V3 includes multiple timeframe selection, along with multiplier input for deviation band setting
Alerts can be set for each individual band, for extreme oversold/overbought conditions, use "Vwap Low Deviation 4" and "Vwap High Deviation 4".
Alerts can also be set for VWAP bounces, by simply setting "VWAP Alert"
VWAP Oscillator CandlesThe VWAP oscillator plots VWAP as the zero line with price, relative to VWAP. This can be use the same way you would traditionally use VWAP, with a much clearer picture of deviation from VWAP. Also, after creating the script, I noticed divergence was extremely noticeable here!

Enhanced Sigma by Cryptorhythms [CR] - AdvancedEnhanced Sigma - Advanced Volatility-Normalized Returns Analysis
The Enhanced Sigma indicator measures volatility-adjusted price returns to identify statistical extremes, regime changes, and mean reversion opportunities. By normalizing returns against their standard deviation, the indicator reveals when markets are experiencing unusual moves relative to recent volatility—highlighting potential exhaustion points, capitulation events, and statistical anomalies.
█ OVERVIEW
Sigma (σ) represents how many standard deviations current returns deviate from normal behavior. Readings beyond ±2.0 indicate statistically unusual moves, while extreme readings beyond ±3.0 occur less than 1% of the time under normal distribution. This version adds multi-layered analysis including regime detection, multi-timeframe confirmation, and adaptive thresholds.
█ KEY FEATURES
Return Calculation Methods
The indicator supports multiple return calculation approaches:
- Simple Returns — Standard percentage change calculation
- Log Returns — Logarithmic returns for better statistical properties
- Geometric Returns — Square root based calculation
- Percentage Returns — Scaled percentage format
Volume Weighting
Optional volume weighting emphasizes high-volume moves while dampening low-volume noise. When enabled, returns are weighted by normalized volume to give more significance to moves occurring on institutional participation.
Threshold Methods
Two threshold calculation approaches:
- Fixed Thresholds — Manual static levels
- Percentile-Based — Adaptive thresholds calculated from historical distribution
Percentile-based thresholds automatically adjust to changing volatility regimes over configurable lookback periods.
Statistical Significance Testing
Built-in t-test functionality determines whether current sigma readings are statistically significant or merely random noise. Configurable confidence levels (80-99.9%) filter out insignificant moves. Non-significant readings are visually dimmed.
Multi-Timeframe Analysis
Analyzes sigma across multiple timeframes simultaneously. Confluence signals trigger when all timeframes (current, 3x, 5x) align at extremes—indicating stronger conviction and reduced false signals. MTF sigma values are plotted as reference lines.
Regime Detection
Automatically classifies current volatility environment into four regimes:
- Low Volatility — Market in compression
- Normal — Standard volatility conditions
- High Volatility — Elevated movement
- Extreme — Unusual volatility expansion
Regime classification uses percentile ranking and statistical deviation analysis.
Adaptive Threshold System
Three methods for automatic threshold adjustment:
- ATR-Based — Adjusts based on Average True Range ratio
- Volatility Regime — Tightens in low volatility, widens in high volatility
- Range Expansion — Responds to recent sigma range changes
When enabled, thresholds dynamically scale with market conditions to maintain consistent sensitivity.
Cluster Analysis
Detects and scores clusters of threshold breaches within rolling windows. High cluster scores can indicate capitulation or exhaustion phases. Visual labels "C" show active clusters.
Mean Reversion Signals
Generates entry and exit signals based on extreme sigma readings returning to mean:
- Long Entry — Triggered on oversold extremes
- Short Entry — Triggered on overbought extremes
- Exit Signals — When sigma normalizes or time-based exit reached (marked as gray "X")
Optional statistical significance filter ensures only high-probability setups generate signals. Position tracking displays unrealized P&L.
Distribution Histogram
Displays sigma value distribution as a horizontal histogram showing Point of Control (POC)—the most frequently occurring sigma level. Configurable bin size and lookback period.
Statistics Dashboard
Real-time table displaying:
- Current sigma value and percentile rank
- Statistical measures (mean, std dev, skewness, kurtosis)
- Volatility regime classification
- Extreme event frequency
- Bars since last extreme
- Position status and P&L (when mean reversion enabled)
█ VISUAL ELEMENTS
Threshold Lines
- Aqua/Cyan lines — Positive (high) thresholds
- Fuchsia/Magenta lines — Negative (low) thresholds
- Solid lines — Short-term dynamic thresholds
- Circles — Long-term dynamic thresholds
- Crosses — Percentile-based static thresholds (when enabled)
Sigma Histogram
Primary histogram uses momentum-based coloring:
- Purple shades — Negative sigma (declining)
- Cyan shades — Positive sigma (advancing)
- Darker shades indicate weakening momentum
- Brighter shades indicate strengthening momentum
Statistically significant threshold breaches are highlighted with intensified colors.
Shape Markers
- Small triangles — Statistically significant threshold breaches
- Diamonds — Multi-timeframe confluence signals
- Large triangles with text — Mean reversion entry signals (LONG/SHORT)
- X markers — Mean reversion exit signals
- Labels — Cluster detection alerts
█ ALERTS
The indicator includes comprehensive alert conditions. Use confirm on bar close if repainting is enabled.
█ HOW TO USE
Identifying Extremes
Sigma readings beyond ±2.0 indicate unusual moves. Look for:
- Threshold breaches with statistical significance markers (triangles)
- Multi-timeframe confluence (diamonds) for stronger signals
- Cluster formation indicating potential exhaustion
Regime-Aware Trading
Use regime detection to adjust expectations:
- In Low Volatility regimes, smaller sigma moves may be significant
- In Extreme regimes, higher thresholds prevent overtrading
Mean Reversion Strategy
Enable mean reversion signals for systematic entries:
- LONG signals appear after statistically significant oversold extremes
- SHORT signals appear after statistically significant overbought extremes
- Exit signals trigger on return to mean or time-based stops
Distribution Analysis
Use the histogram to identify:
- POC level — Where sigma spends most time (equilibrium)
- Current position relative to distribution

B3 HL2MA Painter ~ Extremely Smooth Average & Bar PaintMy HL2MA is a 'proprietary' formula based on the idea that I never again want to see a jagged average line. I released a version of this a long time ago, but I wanted to update it to how I have it on my charts in other platforms. Here are some notes about this moving average script:
The default input value is 5, and I suggest the range of use 4-6 with the rare occasion of using 3 or 7.
For me 5 is what I use UNLESS I AM IN A TRADE, then I might switch to 4 if I have some profits to lock, or 6 if I want to stay in for a lengthier trade.
This average when kept within the above parameters is the smoothest MA in my arsenal, HL2 refers to the middle of the candles which further de-noises the line.
The colors are green/red for good movement with the confirmed trend.
The colors are gray for movement against the current trend (signaling a possible mean reversion)
The colors blue & yellow appear when signaling possible chop or trend exhaustion.
Carried forward from the last time I posted this, the bias for longs and shorts is depicted as the color of the average line green or maroon, and ALERTS are based on that overall bias created the line by itself.
Also carried from the last post, the green and maroon clouds depict the price deviance from the line; when the cloud stretches wide it may be time to take profits and enter back in closer to the line.
Thanks again for liking and following!!!!
This share is in response to my 10,000th like on TradingView!
Favorite this one, and enjoy :-)

Exponential Deviation Bands Width [ChuckBanger]This indicator is a compliment to Exponential Deviation Bands . It is the difference between the upper and the lower bands divided by the middle band. It is an easy way to visualize consolidation before price movements or periods of higher volatility.
How it works
During a period of high volatility, the distance between the two bands will widen and Exponential Deviation Bands width will increase. And the opposite occurs during a period of low volatility, the distance between the two bands will contract and Exponential Deviation Bands width will decrease. Meaning there is a tendency for bands to alternate between expansion and contraction.
When the bands are relatively far apart, that is often is a sign that the current trend is ending. When the distance between the two bands is relatively narrow that often is a sign that the market is about to initiate a bigger move in either direction.

MAD v1 [Intromoto]Hey traders,
This script shows a plotshape on candles, respective of deviation % from the chosen moving average. The further price is from the MA, theoretically, the faster and more reliably price should return to that moving average or close to it.
Users have the following inputs:
- Type of MA to measure the deviations from, i.e EMA, SMA, WMA, VWMA.
- Accompanying moving averages for reference. Fast, med, slowest
- Offset
- AVP resolution
- AVP length
- Use without AVP or other filter
- Use with AVP filter
- Hide/Show High Deviations
- Hide/Show Medium-High Deviations
- Hide/how Smallest High Deviations
- Hide/Show Smallest Low Deviations
- Hide/Show Medium-Low Deviations
- Hide/Show Low Deviations
- Optional size adjustment for low % deviations, used for lower time frames
There are individual plotshapes from deviation percentages in brackets between percentages in both directions of the moving average. i.e 1%-2%, 2%-3%, etc, up to 20% whereby there is a plotshape for all deviations about 20% above the MA and one plotshape for all deviations below -20% below the MA
The plotshapes are color coded from pink and blue . The style menu is setup to show the deviations as they would appear at their respective height above or below the MA. The current filter is a calculation of the average difference between all bars over the length input.
Depending on what time frame you trade within, it may be suggested that these signals are more likely to assist with long exits than short entries, but I have used it for both successfully under certain time frames. Checking off the "Trading Below 3m" box changes the size of the smaller deviations from auto to tiny, which are more visible.
I'll be adding and testing different filters applied to reduce deviation signals that are heavily against the trend or discounting larger time frame momentum. This script, especially the filters I have and will continue to add are experimental. Please use at your own risk.
Thanks for your time!
Please PM me for access.

SSHSH_DevVolatility is a market pulse, like breathing. And it's deviations is being considered as a signal attenuation.
When You want to know how far is the current price of it's mean value, You can use this indicator to determine 3-sigma rule.
The mean line (like moving average) shows if the market is in it's UpTrend state or the DownTrend state.
When it hits it's upper level - so we can say that the Uptrend has ended. The vice versa for the DownTrend.
Use it with the faster tuning when You trade the higher timeframes, and with the slower tuning on a lower timeframes.
{PM me in TradingView to arrange subscription access}


Linear Regression Band BasicLinear Regression Band implements a BB like structure but with the middle line using solely a linear regression as input. In addition unlike bollinger bands , the market price never wicks out of the linear regression band. This is because it gives the absolute possible range taken from the middle line.

Volume Weighted DeviationsVolume !weighted!
deviations.
Important: I don't really know how people generally compute deviations from VWAP/VWMA, but smth tells me generally it's just a Av Dev/St Dev based on mean, not on appropriate basis, like volume weighted mean in our case. This version is mathematically correct, it first calculates weighted mean, than utilizes this weighted in mean in AvDev & StDef functions modified to take into account weights.

Spread by//Every spread & central tendency measure in 1 script with comfortable visualization, including scrips's status line.
Spread measures:
- Standard deviation (for most cases);
- Average deviation (if there are extreme values);
- GstDev - Geometric Standard Deviation (exclusively for Geometric Mean);
- HstDev - Harmonic Deviation (exclusively for Harmonic Mean).
These modified functions will calculate everything right, they will take source, length, AND basis of your choice, unlike the ones from TW.
Central tendency measures:
- Mean (if everything's cool & equal);
- Median (values clustering towards low/high part of the rolling window);
- Trimean (3/more distinguishable clusters of data);
- Midhinhe (2 distinguishable clusters of data);
- Geometric Mean ( |low.. ... ... .. .... ... . . . . . . . . . . . .high| this kinda data); <- Exp law
- Harmonic Mean { |low. . . . . . . . . . . . . . .. . . .high| kinda data). <- Reciprocal law
Listen:
1) Don't hesitate using Standard Deviation with non-mean, like "Midhinge Standard Devition", despite what ol' stats gurus gonna say, it works when it's appropriate;
2) Don't check log space while using Geometric Mean & Geometric Standard Deviation, these 2 implement log stuff by design, I mean unless u wanna make it double xd
3) You can use this script, modify it how you want, ask me questions whatever, just make money using it;
4) Use Midrange & Midpoints in tandem when data follows ~addition law (like this . . . . . . . . . . . . . . . . . . . . .). <- just addition law
Look at the data, choose spread measure first, then choose central tendency measure, not vice versa.
!!!
Ain't gonna place ® sign on standard deviations like one B guy did in 1980s lmao, but if your wanna use Harmonic Deviations in science/write about/cite it/whatever, pls give me a lil credit at least, I've never seen it anywhere and unfortunately had to develop it by myself. it's useful when your data develops by reciprocals law (opposite to exponential).
Peace TW

VAMA Volume Adjusted Moving Average BandsThis indicator is standard deviation bands using a live analysis adaptation of Richard Arms' Volume Adjusted Moving Average as their basis. VAMA utilizes a period length that is based on volume increments rather than time.
• SampleN - N volume bars used as sample to calculate average volume , 0 equals all bars.
• VAMA Source - Price used for volume weighted calculations.
• VAMA Length - Specified number of volume ratio buckets to be reached.
• VAMA VI Fct - Size of volume ratio buckets.
• VAMA Strict - Must meet desired volume requirements, even if number of bars has to exceed VAMA Length to do it.
• STDV Factor - Standard Deviation multiplier.
• STDV Length - Standard Deviation period.
• Brightness - Color opaqueness for the band fills.
Please see previous published example here for more details on VAMA's usage and inability to redraw the past on time based charts.
NOTICE: This is an example script and not meant to be used as an actual strategy. By using this script or any portion thereof, you acknowledge that you have read and understood that this is for research purposes only and I am not responsible for any financial losses you may incur by using this script!

BTCUSDT Volume Weighted Average Price & KairiThis indicator calculates VWAP (Volume Weighted Average Price) for major crypto exchanges with BTCUSDT pairs and shows what percentage each exchange deviates from VWAP.
I made a "BTCUSD" version of this in the past, but many people also want to see “BTCUSDT”, so I made this indicator.
When the parameter "Display" is "Basis", this deviation is expressed in%. Therefore, VWAP is always drawn as "0.00%".
VWAP is calculated using the BTCUSDT prices and volumes of the following exchanges.
These exchanges are the ones Binance refers to when indexing.
- Bitfinex
- Binance
- Huobi
- OKEx
- Bittrex
- HitBTC
VWAP of this indicator calculates the volume for each candlestick , so it will be closer to the actual value.
When there is a big movement in the short term, it is easy to be swayed.
If you set the parameter "Display" to "Basis_SMA", it will calculate the simple moving average of the deviation rate, so it will be hard to be swayed.
Set the desired "Length".
If you want to know the actual value of VWAP , set the parameter "Display" to "Price" and the actual BTCUSDT prices will be displayed.
Warning: This indicator also shows BTCUSDTPERP, but these pairs are not included in the VWAP calculation. be careful.

Harmonic MADsNo, it's not a new saturation plugin for your fruity loops.
...
These are Mean Average Deviations calculated from Harmonic Mean.
...
In my previous research I tried to develop "Harmonic Average Deviations", since applying stdevs on Harmonic Mean calculated from reciprocals ain't make sense. Din't work out, prolly cuz by definition stdevs doesn't like negatives. So in the end I ended up using Mean Average Deviations, and turned out it works great. Generally market data doesn't distribute normally, so t's a great tool, now weird kurtosis won't be a problem.

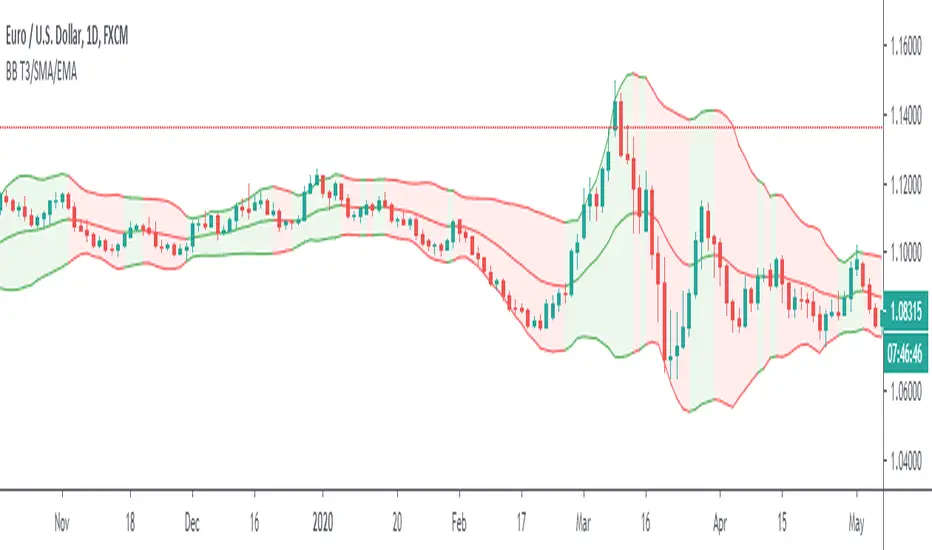
Bollinger Bands T3/SMA/EMAThis is Bollinger Bands script with an option to choose three different moving averages. The simple moving average is the original settings used by Mr Bollinger. Exponential is a popular choice as it adds more value to the recent price movements. T3 is a lot faster at adapting to the recent price. Compared to exponential, it gives even more value to the recent prices and furthermore, it is smoother. I use it to polish my True Range scripts.
Another upgrade is the ability to have a different colour of the channel when the baseline moves up or down.
Back to calculation? Is it better to use T3 with Bollinger? My opinion is that it depends on the trader. Both of them give you slightly different information and it is essential to look at the historical behaviour and answer for yourself. Will I use T3 calculation? Well, I built this script to find out if I want to.
Have a great trade!
Realized Volatility IIR Filters with BandsDISCLAIMER:
The Following indicator/code IS NOT intended to be a formal investment advice or recommendation by the author, nor should be construed as such. Users will be fully responsible by their use regarding their own trading vehicles/assets.
The following indicator was made for NON LUCRATIVE ACTIVITIES and must remain as is following TradingView's regulations. Use of indicator and their code are published by Invitation Only for work and knowledge sharing. All access granted over it, their use, copy or re-use should mention authorship(s) and origin(s).
WARNING NOTICE!
THE INCLUDED FUNCTION MUST BE CONSIDERED AS TESTING. The models included in the indicator have been taken from open sources on the web and some of them has been modified by the author, problems could occur at diverse data sceneries.
WHAT'S THIS...?
Work derived by previous own research for study:
This is mainly an INFINITE IMPULSE RESPONSE FILTERING INDICATOR , it's purpose is to catch trend given by the nature of lag given by a VOLATILITY ESTIMATION ALGORITHM as it's coefficient. It provides as well an INFINITE IMPULSE RESPONSE DEVIATION FILTER that uses the same coefficients of the main filter to plot deviation bands as an auxiliary tool.
The given Filter based indicator provides my own Multi Volatility-Estimators Function with only 3 models:
ELASTIC VOLUME WEIGHTED VOLATILITY : This is a Modified Daigler & Padungsaksawasdi "Volume Weighted Volatility" as on DOI: 10.1504/IJBAAF.2018.089423 but with Elastic Volume Weighted Moving Average instead of VWAP (intraday) for faster (but inaccurate) calculation. A future version is planned on the way using intra-bar inspection for intraday timeframe as described in original paper.
GARMAN & KLASS / YANG-ZANG EXTENSION : As one of the best range based (OHLC) with open gaps inclusion in a single bar.
PETER MARTIN'S ULCER INDEX : This is a better approach to measure realized volatility than standard deviation of log returns given it's proven convex risk metric for DrawDowns as shown in Chekhlov et al. (2005) . Regarding this particular model, I take a different approach to use it as coefficient feed: Given that the UI only takes in consideration DrawDawns, I code myself the inverse of this to compute Draw-Ups as well and use both of them to filter minimums volatility levels in order to create a SLOW version of the IIR filter, and maximums of both to calculate as FAST variation. This approach can be used as a better proxy instead of any other common moving average given that with NO COMPOUND IN TIME AT ALL (N=1) or only using as long as N=3 bars of compund, the filter can catch a trend easily, making the indicator nearly a NON PARAMETRIC FILTER.
NOTES:
This version DO NOT INCLUDE ALERTS.
This version DO NOT INCLUDE STRATEGY: ALL Feedback welcome.
DERIVED WORK:
Incremental calculation of weighted mean and variance by Tony Finch (fanf2@cam. ac .uk) (dot@dotat.at), 2009.
Volume weighted volatility: empirical evidence for a new realised volatility measure by Chaiyuth Padungsaksawasdi & Robert T. Daigler, 2018.
Basic DSP Tips & Trics by TradingView user @alexgrover
CHEERS!
@XeL_Arjona 2020.

VWAP Pack v1.00This script shows Volume Weighted Average Price (VWAP) from any TF in any TF chart. For example you can set 2 months VWAP in 30 minutes chart and see strong developing levels from higher TF. You can also switch on historical values. Together you can see 5 developing levels (POC, 2 first and 2 second standard deviation levels) and 5 historical levels from previous profile. Next levels you can use are Session open levels, which can be customized in any time you like (London open, NY open, ...) and you will see these periodicly on your chart. You can also fill the area between Point Of Control and Value Areas to see it more clearly. Last setting is High-Low of one session with changing Mean value in the middle.
send PM or visit website to get access
