Dual Neighboring Price Dispersion [LuxAlgo]The Dual Neighboring Price Dispersion indicator calculates the standard deviation of historical prices within a specific neighborhood of the current price, providing a unique perspective on local price density and volatility within a long-term distribution.
🔶 USAGE
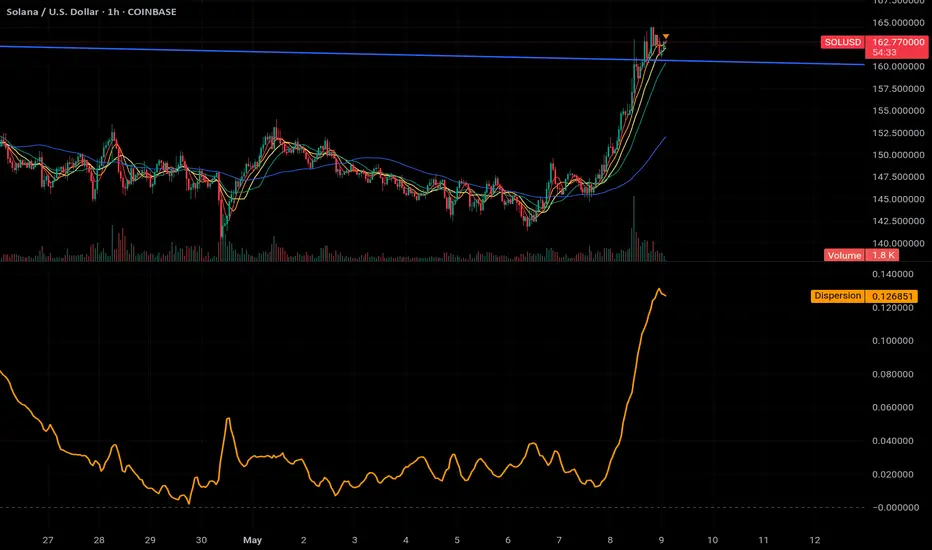
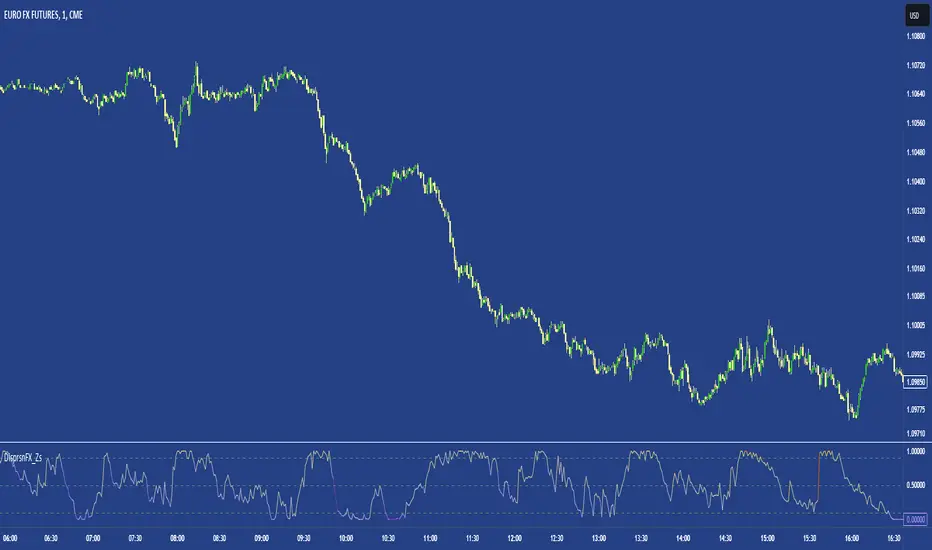
The indicator is displayed in a separate pane and consists of two primary components: a bullish dispersion (plotted above zero) and a bearish dispersion (plotted below zero). These components represent the volatility of prices immediately above and below the current market price based on a historical buffer.
Users can use this tool to identify "Price Discovery" zones or areas where the current price is trading in historical voids. When the indicator's lines disappear and the background is highlighted, it indicates that the current price has few or no "neighbors" within the historical distribution, suggesting the market is exploring new price levels.
🔹 Interpreting Dispersion
High Bullish Dispersion: Indicates that prices higher than the current close are widely spread out, suggesting potential resistance or volatile overhead supply.
High Bearish Dispersion: Indicates that prices lower than the current close are widely spread out, suggesting potential support or volatile demand zones.
Low Dispersion: Suggests high price density, where many historical data points are clustered together, often acting as "fair value" or high-liquidity zones.
🔶 DETAILS
The script maintains a historical buffer of OHLC values (up to 20,000 data points) which are stored in a sorted array. This allows the indicator to construct a "Global Price Distribution" that evolves with every new bar.
Instead of calculating volatility over time, the script calculates volatility over price space . It finds the position of the current closing price within the sorted distribution and calculates the standard deviation of the K nearest neighbors above (Bullish) and below (Bearish).
If the current price is at an all-time high or low, or if there are not enough neighboring data points within the specified range, the indicator will stop plotting and highlight the background. This visual cue signifies that the asset is currently in a state of "discovery," as there is insufficient historical data in that specific price range to determine a local dispersion.
🔶 SETTINGS
Historical Buffer (Bars): The number of historical bars used to build the price distribution. A higher value provides a longer-term memory of price levels.
Neighboring Range (K): The number of neighboring price points to include in the standard deviation calculation. Smaller values respond more quickly to local gaps, while larger values provide a broader view of density.
Smoothing: Applies a Simple Moving Average (SMA) to the dispersion components to filter out noise and produce smoother visual gradients.
אינדיקטור Pine Script®