Swing High-Low Line ConnectorSwing High-Low Line Connector is a simple and intuitive tool that automatically detects swing highs and swing lows using fractal-style pivot logic and connects them with clean, continuous lines. This indicator helps traders visualize market structure, trend shifts, and swing-based support/resistance levels at a glance.
The script identifies each confirmed swing point based on a user-defined lookback window (left/right bars). When a new swing is confirmed, the indicator updates the previous leg or creates a new one, effectively drawing the classic “zigzag-style” connections used in discretionary trading and price-action analysis.
A dynamic tail extension is included to show the most recent swing extending toward the current price. By default, the tail follows a ZigZag-style logic—extending upward after a swing low and downward after a swing high—but users can also anchor it to Close, High, Low, or HL2.
Features
Automatic detection of swing highs and swing lows
Clean line connections between swings (similar to discretionary market-structure mapping)
Proper consolidation handling: weaker highs/lows are ignored
Optional ZigZag-style dynamic tail extension
Fully customizable lookback window, line color, and line width
Works on any market and timeframe
Use Cases
Identifying market structure (HH, HL, LH, LL)
Visualizing trend transitions
Spotting breakout levels and swing-based support/resistance
Aiding discretionary swing trading, trend following, or pattern recognition
This indicator keeps the logic simple and visual—ideal for traders who prefer clean chart structure without unnecessary noise.
Dowtheory

Dow Theory Trend Direction VisualizerJapanese below / 日本語説明は下記
Overview
What is difficult for beginner traders is to identify trend occurrence, continuation and reversal.
This indicator visualizes market direction by changing background colors based on Dow Theory so that traders can visually grasp trends.
Sample chart
Functions
1.MTF Higher High/Lower High/Higher Low/Lower Low(HH/LH/HL/LL)
Indicator shows HH/LH/HL/LL of an upper timeframe(MTF) and those of chart’s timeframe at the same time.
As usual, HH/LH/HL/LL of chart’s timeframe can be used to identify trend continuation based on Dow Theory while MTF HH/LH/HL/LL can be used as support/resistance.
Auto and manual mode for MTF
When you select “Auto” mode, then an upper timeframe will be automatically determined as MTF based on chart’s timeframe. If “Manual “ mode selected, then you need to specify MTF timeframe.
MTF HH/LH/HL/LL are displayed only below the selected MTF timeframe so it will not disturb when you open higher timeframe.
For instance, if you select daily timeframe as MTF, then HH/LH/HL/LL of daily timeframe will be shown on 4 hour or below timeframes.
Sample chart (AUDJPY 4H + Daily timeframe HH/LH/HL/LL )
In this chart, you can see two different timeframe’s trend.
In 4hour timeframe, a new high recorded as HH and in daily timeframe, lows going up from LL to HL and high going up from LH to HH hence daily chart is uptrend.
Also, you can predict that Daily HH would be respected as resistance line.
2.Visualize trends direction with colors based on HH/LH/HL/LL.
Background color will change based on break up/down of HH/LH/HL/LL.
———————
トレードを習得する上で多くの人が苦手意識を持つ「目線付け」。
この目線付けをダウ理論を元に訓練するためのインジケーターを開発しました。
高値·安値の更新状況に応じて相場の方向性を色で可視化するため、視覚的に目線付けをすることが可能です。
サンプルチャート
ダウ理論による目線付けの二つの方法
これは僕の持論ですが、ダウ理論による目線付けの方法には、「トレンドは明確なシグナルが出るまで継続する」という原則を共通の拠り所とする二つの方法があると考えています。
一つは日本人投資家/トレーダーにも良く知られている押し安値·戻り高値を基準とする方法。そしてもう一つは高値·安値の切り上げ·切り下げのみを基準とする方法です。
このインジケーターは後者の方法で目線を可視化します。
(もちろん押し安値·戻り高値と併用した目線判断にも活用可能です。)
機能
1.上位足とチャートの時間軸両方のHigher High/Lower High/Higher Low/Lower Low(HH/LH/HL/LL)の表示(MTF機能)
上位足タイムフレームのHH/LH/HL/LLとチャートタイムフレームのHH/LH/HL/LLを同時に表示することができます。
チャートタイムフレームのHH/LH/HL/LLはダウ理論に基づくトレンドの継続・反転の判断用に、上位足のHH/LH/HL/LLは上位足での高値・安値の切り上げ/切り下げ判断及びレジスタンス・サポートとして使うことができます。
上位足の選択には自動モードとマニュアルモードが選択可能です。自動モードを選択した場合、チャートのタイムフレームに応じて上位足が自動的に決定されます。マニュアルモードの場合は選択した時間軸が上位足タイムフレームとして適用されます。
上位足のHH/LH/HL/LLは選択したタイムフレーム未満でのみ表示されます。例えば上位足のタイムフレームとして日足を選択した場合、日足のHH/LH/HL/LLは日足未満でのみ表示されます。
サンプルチャート (AUDJPY 4H に日足のHH/LH/HL/LL を表示)
このチャートでは二つの異なるタイムフレームの高値・安値更新状況を一度に把握することができます。
4Hでは高値の切り上げが発生しているため、安値を更新しなければ上昇トレンド確定です。一方日足では安値がLLからHLへ(赤の矢印)、高値がLHからHHへと切り上がり(緑の矢印)、上昇トレンドであることがわかります。
また、この場面では上位足のHHがレジスタンスとして機能する可能性も予測できます。
2.目線の方向を色で可視化
HH/LH/HL/LLの更新状況から目線を判断し、背景色とともに可視化します。
Higher High/Lower High/Higher Low/Lower Lowとは何か?
日本人投資家/トレーダーの中にはあまり馴染みのない方もいるかと思いますので、定義を記載します。
Higher High(HH)
切り上がった高値を意味します。当インジケーターでは一つ前の高値(HH/LH)から切り上がった場合にHHとしています。
Lower High(LH)
切り下がった高値を意味します。Lower Highなのでより低い方の高値という意味です。当インジケーターでは一つ前の高値(HH/LH)から切り下がった場合にLHとしています。
Higher Low(HL)
切り上がった安値を意味します。Higher Lowなのでより高い方の安値という意味です。当インジケーターでは一つ前の安値(HL/LL)から切り上がった場合にHLとしています。
Lower Low(LL)
切り下がった安値を意味します。当インジケーターでは一つ前の安値(HL/LL)から切り下がった場合にLLとしています。
使い方
高値·安値の切り上げ·切り下げの判断及びトレンド継続·転換の判断に活用

Trend From Volume And Price (TFVAP)Indicator that indicates buying and selling times based on price and volume and who is imposed of the two (VAP).
It uses the trends of the Dow theory (primary: 365 days/1 year, secondary: 90 days/3 months and tertiary: 21 days/3 weeks) and the identification of Elliot waves, both impulse and correction, based on the Fibonacci retracements (23.61% , 38.2%, etc.).
- Purple line is the evolution in percentage of the price in the primary trend
- Blue line is the evolution in percentage of the volume in the primary trend
- White line is the evolution in percentage of the (volume % - price %) in the primary trend, if white line > 0
- Green triangleup is time of start to buy
- Green square is time of stop to buy
- Red triangledown is time of sell
To understand it better:
If the purple line goes up it indicates that the price is rising, if it goes down, that the price is down.
If the blue line is greater than 0 it indicates that there are more purchases than sales, if the blue line is less than 0 it indicates that there are more sales than purchases.
If the white line is greater than 0 there is a high volume of purchases or low sales for the price that there is, it is likely that the price will rise.
If the white line is less than 0 there is a low volume of purchases or high sales for the price that there is, it is likely that the price will go down.
PD: Ignore the chart drawings, the indicator script is only represented at the bottom

Dow theory Indicator for FreeDow theory Indicator for Free ver.1.0
Shows current trends based on Dow theory.
Draws a horizontal line automatically from the latest 2 highs and 2 lows.

TTT_Swing_and_Orderblock_Ver_1.0.2Hello, dear traders from all over the world! This is Tommy from Tommy Trading Team.
Many inquires were delivered to us from traders recently wishing to use one of our cutting-edge technologies that was developed days ago and was only used by us. We have edited and supplemented this indicator both logically and visually. Accordingly, our team is officially launching with a new brought up name, which is “SOB(Version1.0.2), shorten for “Swing & OB(Orderblock).”
This technical indicator is quite straightforward and effective to utilize since it shows traders the essential variables that are considered by many recently developed theories and state-of-the-art methodologies. And they are ‘Dow’ and ‘Orderblock’.
Swing High and Low (Dow Theory) has been applied fundamentally by many other theories and methodologies such as Elliott wave theory and SR Flip techniques. A swing can be interpreted as a wave with a trend composed of a high and a low each. After succeeding on making significant highs/lows, in any existing wave theories, it is essential to monitor and spot when the next waves make HH(Higher high), LH(Lower high), HL(Higher low), or LL(Lower low).
OB(Orderblock) technique is a very advanced methodology that captures the contraction, consolidation, and attraction zone. This so called ‘zone’ is interpreted differently by various stakeholders, such as institutional(whales) average entry/exit price range or peak price range with higher traded volumes. In TA perspective, it’s just a major support/resistance to consider and when this zone fails to support/resist, the price momentum tends to boost up towards the direction it failed. To give you a little tip, look for the spots usually forming horizontal parallel channel, before a big wave with a clear trend (whether up or down) appears. There are numerous ways to identify OB and we have concluded that signaling the double engulfing candles is one of the highly effective one.
As just mentioned, comprehending a trend utilizing ‘Swing HL’ is fundamental and yet definite TA concept and strategy. Furthermore, OB can also be useful to spot major support and resistance area. SOB automatically identify and captures major Highs, Lows, and OBs. In addition, SOB can let traders know when the highs and lows are being replaced by higher/lower highs/lows by changing pivots color. If you are familiar with SR(Support and Resistance) Flip concept, this can be a helpful tool for you since it can signal when highs/lows are being broken above/below and by planning a retest entry trading setup.
If you would like to try SOB_ver1.0.2, please let us know through comments, DM, or Telegram in English/Korean. I assure you that our SOB won’t disappoint you on your trading chart.
Thank you.
안녕하세요. 트레이더 여러분!
토미 트레이딩 팀입니다~
최근에 저희 팀이 개인적으로 사용했던 지표에 관해서 많은 분들이 문의를 주셨습니다. 약간의 보안 및 개선 작업 이후에 SOB(Version1.0.2)이라는 이름으로 정식 출시합니다.
해당 알고리즘은 기존의 여러 이론 및 방법론들에게 원천적으로 기반이 되는 다우이론(스윙 고/저점)과 오더블럭(OB)을 바로바로 잡아주기 때문에 주요 고/저점과 매물대 지지/저항 컨펌하는 용도로 활용하기 매우 유용합니다.
변동하는 가격의 흐름, 즉 추세를 파악하는 방법은 수만가지가 있습니다. 단 하나의 방법, 지표, 혹은 이론만 가지고 추세를 파악하는 건 당연히 바보 같은 짓이겠죠. 여러가지의 요소들을 복합적으로 봐야하는데 그 중에 가장 근본적이면서 중요한 게 바로 다우이론이라고 생각합니다. 이름만 거창하지 정말 별거 없습니다. 한문장으로 “전 고/저점에 비해서 이번에 나오는 고/저점이 높아졌냐 낮아졌냐”입니다. 다우 이론은 엘리엇 파동 이론 및 SR Flip 전략 등 대부분들의 기법들에 적용된 만큼 차트 보시려면 꼭 알아야 되는 개념입니다. 스윙이란 변곡이 나오기 전까지의 가격 흐름, 즉 하나의 파동이라고 생각하시면 되겠습니다. 주요 고/저점은 통상적으로 하나의 파동을 규명하기 위해 참고하는 기준들입니다. 고/저점 혹은 변곡점이 출현하고 나서 후행적으로 우리는 전 상승/하락 파동이었다고 인지를 합니다. 여기서 중요한 건 다음 파동이 전 파동보다 고/저점을 높였냐/낮추었냐입니다. 고/저점을 높여가는 파동이 나오면 상승, 낮추어가는 파동이 나오면 하락 추세에 가중을 더 두고, 고/저점을 높이다가 내리기 시작하면 혹은 내리다가 높이기 시작하면 추세가 어느정도 전환될 수 있는 시그널로 해석할 수 있습니다.
OB(오더블럭) 기법은 요즘 장에 그나마 잘 먹히는 가격매물대를 찾는 방법론 중 하나입니다. 매물대란 다양한 시장참여자들에 따라 시시각각 해석될 수 있습니다. 기관(세력)들의 매집구간, 많은 참여자들의 평균 진입/청산/평단 가격 범위, 혹은 시체 쌓인 구간으로도 해석해볼 수 있습니다. 더 쉽게 설명해드리자면 거래량이 상대적으로 많은 가격 범위대라고 보시면 되겠습니다. 기술적분석 관점에서는 매물대를 주요 지지/저항구간대라고 고려하실 수 있으며 지지/저항을 실패하면, 그 실패한 방향으로 추세가 터질 가능성을 두고 전략 설계에 활용합니다. 매물대를 효과적으로 찾을 수 있는 팁 하나를 드리자면, 어느정도 명확하고 큰 추세가 나오기 전에 형성된 수평 평행 채널들을 먼저 의심해보세요. 만약에 해당 가격범위 내에 OB가 많이 내포되어 있다면 신빙성을 더 부여하실 수 있습니다. 이렇게 OB는 매물대를 식별하고 컨펌하는 용도로 매우 용이하게 활용될 수 있으며, 요즘에 유행하는 기법인 마스터패턴에도 찰떡궁합입니다. OB를 정의하는 여러가지 기법들 중 캔들봉을 활용한 방법이 그나마 가장 효과적이며 저희 개발팀은 장악형(Engulfing) 패턴이 두번 이상 출현하는 캔들봉들의 몸통들을 기준으로 OB를 찾는 로직을 지표화했습니다.
언급 드렸듯, 다우이론은 기술적 분석 기법 중 가장 근본적이면서도 동시에 실용도가 높아 차트 보시려면 무조건 숙지해야하는 개념 및 전략입니다. 또한 상대적으로 최근 시장에 효율적인 매물대 색출 전략 중 하나인 OB기법으로 주요 지지/저항으로 해석될 수 있는 메이저 매물대들의 가격 범위를 더 세분화시킬 수 있습니다. 저희 SOB 지표는 주요 고점, 저점, 그리고 OB들을 자동으로 피봇으로 잡아줄뿐더러 주요 고/저점이 뚫렸을 때, 해당 피봇의 색깔들이 변경됩니다. SR Flip (저항선이 뚫리면 지지선, 지지선이 뚫리면 저항선)개념 및 전략을 자주 활용하시는 트레이더분들은 고/저점 뚫릴 때, 즉 더 높은/낮은 고/저점이 출현하고 나서 전 고/저점을 활용해 리테스트 진입 자리 찾으실 때 유용하게 사용하실 수 있습니다.
저희 SOB_Version1.0.2 지표를 사용하고 싶으신 분들은 댓글, DM, 또는 저희 개인 채널에 문의 주십시오. 차트와 캔들 위에서만큼은 우리 SOB이 여러분들을 실망시키지 않을 것입니다.
감사합니다. 성투하세요.

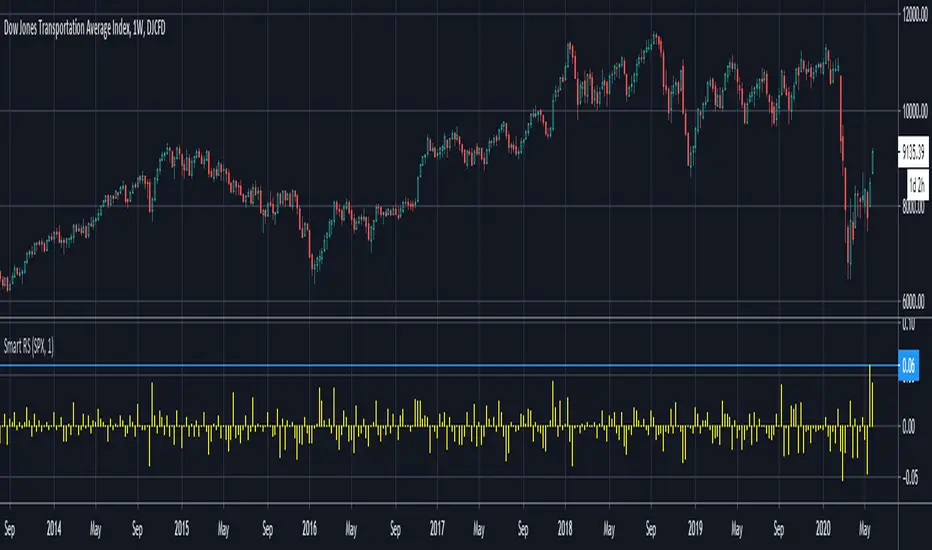
Smart Relative Strength Can Remove False SignalsRelative strength is one of the most useful indicators in the market, highlighting when stocks and sectors are outperforming or underperforming a broader index.
Traditional RS compares the percentage change of one symbol over a given time frame and subtracts the percentage change of the S&P 500 over the same period.
This is handy, but it can produce false signals at times of volatility. For example, when the broader market is crashing, certain sectors may “outperform” simply by falling less than the S&P 500.
Smart Relative Strength addresses this shortcoming by requiring that the symbol’s absolute AND relative returns both be positive. Otherwise a zero is returned.
This was useful last week on the Dow Jones Transportation Average . Using simple relative strength, it had its best one-week performance against the S&P 500 since October 2008. This was obviously a false signal because October 2008 was a time that everything else was crashing.
Smart Relative Strength showed that, excluding periods of overall decline, DJT had its best week since January 2008.
Note: This chart uses a 1-period interval, while the code defaults to 21 periods.
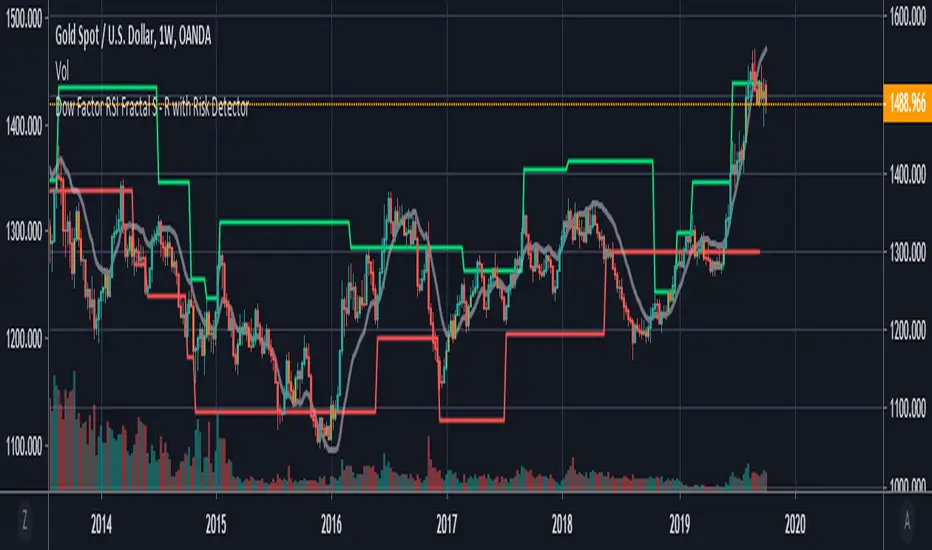
Dow Factor RSI Fractals with Risk Detector
This script is only the fact that the fractals are set according to my Dow Factor RSI .
Bar color and background change where risk factor is high.
You can turn it off or on from the menu.
I'm not licensing because "fractal support and resistances" are not my own codes.
The rest are my own products.
For more information about the Dow Factor RSI:
For more information on the DVOG Risk Detector:
For information about Dependent Variable Odd Generator :
To see the script in a storm theme with Quadruple Exponential Moving Averages:
Best wishes.
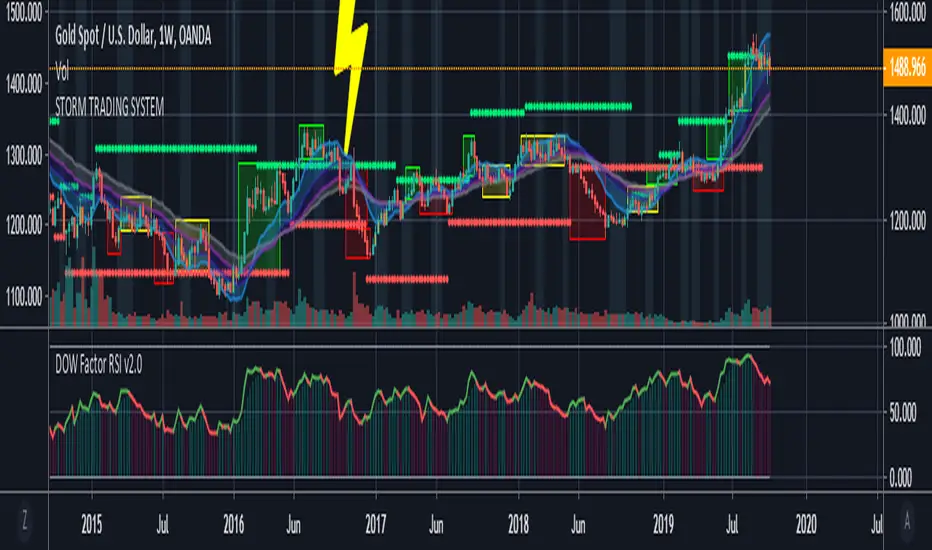
Storm Trading System This script is inspired by the following :
Fractal Dow RSI Support and Resistance ;
Moving Average Clouds ;
Let's start.
This command is based on a fun description of where we are.
Technical analysis methods are likened to a storm.
Clouds as moving average,risk factor as lightning,
fractals were taken as green and red rain.
In this system:
4 Exponential Moving Averages, ( EMA15, EMA30 , EMA45 , EMA60 ),
interpretation of my own work, Dow Factor RSI, as Fractal Support and Resistance,
interpretation of my own work , DVOG Risk Factor : with changeable background and bar color.
Fractal support resistance level codes do not belong to me.
So I'm not putting a license.
But the other codes are my labor.
Consider the risk factor not as a stop, but as a region of high attention.
It is a warning before hard movements.
And watch out for turbulence in the clouds :)
The regions above and below the clouds are major trend zones, which may take a long time.
Guide the fractals in these areas.
It allows you to comment on this and tons of similar things.
And you see where you are in the big trade from a different perspective.
Repaint issue :
Firstly our source is close . Repaint will only cause the following issue and solution:
There may be a time difference between countries as the dow factor depends on the indexes.
Do not use a low graph time frame in stocks.
Function : Multiple Correlation
This script was written to calculate the correlation coefficient (Adjusted R-Squared) for one dependent and two independent variables.(3-way)
Pearson correlation method was used with exponential moving averages as the correlation calculation method.
Use your source ( i use "close" generally ) as the dependent variable.
Inspired by this article : www.real-statistics.com
The Adjusted R-Squared coefficient is used as output, but the R-Squared coefficient is also available in the code.
Adjusted R-Squared is often used for multiple correlations.
It also gives better results in large samples.
Here is the article about the difference of the two coefficients : www.investopedia.com
I wrote this function to increase the efficiency of my Dow Factor I used before.
When my research is over, I will apply the 3-factor correlation to my scripts.
I hope that I will achieve more efficient indicators and oscillators and even strategies.
In this command, I gave a few variable values and plotted them as an example.
I hope this function is useful in your work.
Finally, you can use periods as mutable variables.
The function is recovered from integer loads.
Best regards. Noldo

Dow Factor Stoch RSIThe indicator was generated by adding the Dow Factor to the Stochastic Relative Strength Index.( Stoch RSI )
The Dow factor is the effect of the correlation coefficient, which determines the relationship between volume and price, on the existing indicators.
With these codes we are able to integrate them numerically into the indicators.
For more information on the Dow factor, please see my indicator:
This code is open source under the MIT license. ( github.com )
My dow factor updates will continue.We adapted the indicators and saw successful results, now it is time to examine and develop the factor itself.
Stay tuned , best regards.

Dow Factor Relative Strength IndexThis script was written to create a new, rapid relative strength index inspired by the Dow Theory.
More info about Dow Theory : www.investopedia.com
According to the Dow Theory, volume should confirm market trends.
The correlation coefficient between prices and volume is negative in weakening trends and negative trends , positive in strengthening or positive trends.a factor was formed based on the correlation coefficient between volume and prices.
This factor was added to the relative strength index.
Period 5 is selected because the volume is very volatile and can be slow.
You can use the period you want, but I recommend the period as a minimum of 5.
It is suitable for all instruments and timeframes and thanks to its design, it provides control over gradual buying and selling points.
I haven't fully tested it, it's open to updates. For now, just use it to create ideas.
If I find it necessary,
I'll update after the tests.
If you have suggestions on these issues,
Leave your comments in the comment window.
This code is open source under the MIT license. If you have any improvements or corrections to suggest, please send me a pull request via the github repository github.com
Stay tuned , best regards.
Dependent Variable Odd Generator For Machine Learning TechniquesCAUTION : Not suitable for strategy, open to development.
If can we separate the stagnant market from other markets, can we be so much more accurate?
This project was written to research it. It is just the tiny part of the begining.
And this is a very necessary but very small side function in the main function. Lets start :
Hi users, I had this idea in my mind for a long time but I had a hard time finding the parameters that would make the market stagnant. This idea is my first original command system. Although it is very difficult to make sense of the stagnant market, I think that this command system can achieve realistic proportions. With 's money flow index, I opened the track to determine the level. On the other hand, the prices were also using a money flow index, and it forced me to make the limitations between the levels in a logical way. But the good thing is that since the bollinger bandwidth uses a larger period, we are able to print normal values at extreme buy and sell values.
In terms of price, we can define excessive purchase and sale values as the period is smaller. I have repeatedly looked at the limit values that determine the bull, bear, and bollinger bandwidth (mfi), and I think this is the right one. Then I have included these values in the probability set.
The bull and bear market did not form the intersection of the cluster, and because there are connected events, the stagnant market, which is the intersection, will be added to the other markets with the same venn diagram logic and the sum of the probability set will be 1. is equal to. I hope that we can renew the number generators in the very important parameters of machine learning such as Markov Process with generators dependent on dependent variables, which bring us closer to reality. This function is open to development and can be made of various ideas on machine learning. Best wishes.
This code is open source under the MIT license. If you have any improvements or corrections to suggest, please send me a pull request via the github repository github.com


Tabajara by André MachadoAmigos da comunidade TradingView que me pediram o Setup Tabajara, segue ele aqui para uso livre e educacional!
Na verdade é um Setup de Finanças Comportamentais, ou o que chamo de Setup Ansiolítico!!!
O meu Trading System é 100% discricionário e 100% baseado em AT clássica, Teoria de Dow pura, ou o que chamam de Price Action. Simplesmente uso as MMA20 e MMA200 para me mostrar a tendência, evitando assim operar contra. E tb usando o conceito matemático de "regressão à média" e operando as reversões nelas. Enfim, muito básico mesmo. Por isso o nome Tabajara, porque não tem nada de novo! O jogo de cores é só para gerenciar mesmo a ansiedade e forçar a disciplina e a paciência!
E aproveito para agradecer ao Filipe Ramos, da TradingView Brasil, por ter criado o setup Tabajara a meu pedido!
