EMA & ORB/PM LevelsScript that combines EMA and opening range and Premarket high and low levels all in one so you can save using three indicators and just use this one.
Educational

Gold THB per Baht (XAU -> Thai baht gold)What it does
This indicator converts international gold prices (XAU) into Thai retail “baht gold” price (THB per 1 baht gold weight) in real time. It multiplies the XAU price (per troy ounce) by USD/THB and converts ounces to Thai baht-weight using the exact gram ratios.
Formula
THB per baht gold = XAU (USD/oz) × USDTHB × (15.244 / 31.1035) × (1 + Adjustment%) + FlatFeeTHB
1 troy ounce = 31.1035 g
1 Thai baht gold = 15.244 g
Conversion factor ≈ 0.490103

Prev Daily Closes — Prev1 & Prev2 (intraday) RAJESH MAYEKARit gives last 2 days close line. when last 2 days close broke you get momentum for BTST

AutoPivot Levels with Alerts [ChartWhizzperer] – Dynamic EditionAuto-Pivot Levels 4 methods with alerts – Dynamic Edition
Now with
- Live Mode
- 4 Pivot Methods
- 7 Session Types (5m, 15m, 30m, Hourly, Daily, Weekly, Monthly)
- PineConnector-Ready Alerts!
Free, Open Source, Pine Script v6-compliant.
NEW: Live Mode (Ultra-Dynamic, Repainting) – Switchable in UI!
Instantly switch between Classic (session-based, repaint-free) and Live (rolling window, real-time, repainting) using the simple checkbox in the settings!
Live Mode recalculates all pivots on every tick/bar, using the current high/low/close for the chosen session (5m, 15m, 30m, hourly, daily, weekly, monthly).
Perfect for:
- Scalping and high-frequency trading
- Real-time bot/automation setups (PineConnector-ready)
- Fast-moving or breakout markets
Classic Mode: For traditional, stable levels based on confirmed session data – ideal for backtesting and trading history.
Four Calculation Methods (Choose What Fits YOU)
1. Classic
Standard pivot calculation.
Based on previous session’s High, Low, Close.
Simple, proven, and suitable for any asset.
2. Fibonacci
Projects levels using Fibonacci ratios of the prior session’s range.
Great for traders who want to align pivots with fib retracements and extensions.
3. Camarilla
Uses unique multipliers for support/resistance, focusing on mean reversion and volatility.
Popular among futures and forex day traders.
4. Woodie
Puts extra weight on previous Close for more responsive pivots.
Often used in trending or choppy conditions.
Switch methods anytime in the UI – the script recalculates instantly and keeps your chart clean!
Level-Specific Alerts – PineConnector Ready!
Dedicated alert for EVERY level and direction (Up/Down):
Pivot (P), R1, R2, R3, S1, S2, S3
No configuration hassle:
All alerts are pre-defined in the TradingView Alert Panel and work across all session types (5m → monthly).
Machine-readable message format:
PIVOT=R1 DIR=UP SYMBOL={{ticker}} PRICE={{close}}
Direct plug-and-play with PineConnector, webhooks, Discord, Telegram, bots, and other automation tools.
Never miss a breakout, reversal, or key support/resistance touch!
Powerful Customization & Performance
- Session selection: 5m, 15m, 30m, Hourly, Daily, Weekly, Monthly (choose what suits your trading style).
- Show/hide any level (Pivot, R1–R3, S1–S3) for minimal chart clutter.
- Color selection for each level to match your theme or highlight key pivots.
- Auto-cleanup: Old lines and labels are cleared on every recalculation or session change for maximum performance and visual clarity.
- Zero runtime errors: Strict Pine Script v6 practices for stability.
How To Use – Quick Start
1) Add the indicator to your TradingView chart.
2) Pick your calculation method (Classic, Fibonacci, Camarilla, Woodie).
3) Set session type (5m, 15m, 30m, Hourly, Daily, Weekly, Monthly).
4) Switch between Classic and Live Mode with a single click in settings.
5) Customize your levels (on/off, colors).
6) Open the Alert Panel, select any pre-configured alert (e.g. "R2 Cross Down"), and go live!
7) Connect with PineConnector or any webhook system instantly using the pre-formatted alert messages.
Who Is It For?
- Active scalpers & bot traders: Live Mode + PineConnector-ready alerts = instant, automated reactions.
- Swing and position traders: Use Classic Mode for stable, repaint-free levels.
- Strategy developers: Seamless integration into automated and manual trading workflows.
License & Community
Open Source, Non-Commercial:
Free for personal & educational use under CC BY-NC-SA 4.0.
Feedback, bug reports & ideas:
Drop a comment, or contact me for feature requests.
Trade smart. Trade dynamic. Unlock the true power of pivots – with ChartWhizzperer!

Apertura SemanalIdentifica las aperturas semanales de cada grafico y resalta las aperturas mensuales


Cora Combined Suite v1 [JopAlgo]Cora Combined Suite v1 (CCSV1)
This is an 2 in 1 indicator (Overlay & Oscillator) the Cora Combined Suite v1 .
CCSV1 combines a price-pane Overlay for structure/trend with a compact Oscillator for timing/pressure. It’s designed to be clear, beginner-friendly, and largely automatic: you pick a profile (Scalp / Intraday / Swing), choose whether to run as Overlay or Oscillator, and CCSV1 tunes itself in the background.
What’s inside — at a glance
1) Overlay (price pane)
CoRa Wave: a smooth trend line based on a compound-ratio WMA (CRWMA).
Green when the slope rises (bull bias), Red when it falls (bear bias).
Asymmetric ATR Cloud around the CoRa Wave
Width expands more up when buyer pressure dominates and more down when seller pressure dominates.
Fill is intentionally light, so candlesticks remain readable.
Chop Guard (Range-Lock Gate)
When the cloud stays very narrow versus ATR (classic “dead water”), pullback alerts are muted to avoid noise.
Visuals don’t change—only the alerting logic goes quiet.
Typical Overlay reads
Trend: Follow the CoRa color; green favors long setups, red favors shorts.
Value: Pullbacks into/through the cloud in trend direction are higher-quality than chasing breaks far outside it.
Dominance: A visibly asymmetric cloud hints which side is funding the move (buyers vs sellers).
2) Oscillator (subpane or inline preview)
Stretch-Z (columns): how far price is from the CoRa mean (mean-reversion context), clipped to ±clip.
Near 0 = equilibrium; > +2 / < −2 = stretched/extended.
Slope-Z (line): z-score of CoRa’s slope (momentum of the trend line).
Crossing 0 upward = potential bullish impulse; downward = potential bearish impulse.
VPO (stepline): a normalized Volume-Pressure read (positive = buyers funding, negative = sellers).
Rendered as a clean stepline to emphasize state changes.
Event Bands ±2 (subpane): thin reference lines to spot extension/exhaustion zones fast.
Floor/Ceiling lines (optional): quiet boundaries so the panel doesn’t feel “bottomless.”
Inline vs Subpane
Inline (overlay): the oscillator auto-anchors and scales beneath price, so it never crushes the price scale.
Subpane (raw): move to a new pane for the classic ±clip view (with ±2 bands). Recommended for systematic use.
Why traders like it
Two in one: Structure on the chart, timing in the panel—built to complement each other.
Retail-first automation: Choose Scalp / Intraday / Swing and let CCSV1 auto-tune lengths, clips, and pressure windows.
Robust statistics: On fast, spiky markets/timeframes, it prefers outlier-resistant math automatically for steadier signals.
Optional HTF gate: You can require higher-timeframe agreement for oscillator alerts without changing visuals.
Quick start (simple playbook)
Run As
Overlay for structure: assess trend direction, where value is (the cloud), and whether chop guard is active.
Oscillator for timing: move to a subpane to see Stretch-Z, Slope-Z, VPO, and ±2 bands clearly.
Profile
Scalp (1–5m), Intraday (15–60m), or Swing (4H–1D). CCSV1 adjusts length/clip/pressure windows accordingly.
Overlay entries
Trade with CoRa color.
Prefer pullbacks into/through the cloud (trend direction).
If chop guard is active, wait; let the market “breathe” before engaging.
Oscillator timing
Look for Funded Flips: Slope-Z crossing 0 in the direction of VPO (i.e., momentum + funded pressure).
Use ±2 bands to manage risk: stretched conditions can stall or revert—better to scale or wait for a clean reset.
Optional HTF gate
Enable to green-light only those oscillator alerts that align with your chosen higher timeframe.
What each signal means (plain language)
CoRa turns green/red (Overlay): trend bias shift on your chart.
Cloud width tilts asymmetrically: one side (buyers/sellers) is dominating; extensions on that side are more likely.
Stretch-Z near 0: fair value around CoRa; pullback timing zone.
Stretch-Z > +2 / < −2: extended; watch for slowing momentum or scale decisions.
Slope-Z cross up/down: new impulse starting; combine with VPO sign to avoid unfunded crosses.
VPO positive/negative: net buying/selling pressure funding the move.
Alerts included
Overlay
Pullback Long OK
Pullback Short OK
Oscillator
Funded Flip Up / Funded Flip Down (Slope-Z crosses 0 with VPO agreement)
Pullback Long Ready / Pullback Short Ready (near equilibrium with aligned momentum and pressure)
Exhaustion Risk (Long/Short) (Stretch-Z beyond ±2 with weakening momentum or pressure)
Tip: Keep chart alerts concise and use strategy rules (TP/SL/filters) in your trade plan.
Best practices
One glance workflow
Read Overlay for direction + value.
Use Oscillator for trigger + confirmation.
Pairing
Combine with S/R or your preferred execution framework (e.g., your JopAlgo setups).
The suite is neutral: it won’t force trades; it highlights context and quality.
Markets
Works on crypto, indices, FX, and commodities.
Where real volume is available, VPO is strongest; on synthetic volume, treat VPO as a soft filter.
Timeframes
Use the Profile preset closest to your style; feel free to fine-tune later.
For multi-TF trading, enable the HTF gate on the oscillator alerts only.
Inputs you’ll actually use (the rest can stay on Auto)
Run As: Overlay or Oscillator.
Profile: Scalp / Intraday / Swing.
Oscillator Render: “Subpane (raw)” for a classic panel; “Inline (overlay)” only for a quick preview.
HTF gate (optional): require higher-timeframe Slope-Z agreement for oscillator alerts.
Everything else ships with sensible defaults and auto-logic.
Limitations & tips
Not a strategy: CCSV1 is a decision support tool; you still need your entry/exit rules and risk management.
Non-repainting design: Signals finalize on bar close; intrabar graphics can adjust during the bar (Pine standard).
Very flat sessions: If price and volume are extremely quiet, expect fewer alerts; that restraint is intentional.
Who is this for?
Beginners who want one clean overlay for structure and one simple oscillator for timing—without wrestling settings.
Intermediates seeking a coherent trend/pressure framework with HTF confirmation.
Advanced users who appreciate robust stats and clean engineering behind the visuals.
Disclaimer: Educational purposes only. Not financial advice. Trading involves risk. Use at your own discretion.

VWAP + EMA shows the VWAP + EMA 9/20/50/100/200 all in one indicator... you can adjust VWAP's calculation method + color + the outer bands or remove them.. can remove fill as well.. personally i just keep the VWAP

No-Trade Zones UTC+7This indicator helps you visualize and backtest your preferred trading hours. For example, if you have a 9-to-5 job, you obviously can’t trade during that time — and when backtesting, you should avoid those hours too. It also marks weekends if you prefer not to trade on those days.
By highlighting no-trade periods directly on the chart, you can easily see when you shouldn’t be taking trades, without constantly checking the time or date by hovering over the chart. It makes backtesting smoother and more realistic for your personal schedule.

Lynie's V9 SELL🟢🔴 Lynie’s V8 — BUY & SELL (Mirrored, Interlocking System)
Lynie’s V8 is a paired long/short engine built as two mirrored scripts—Lynie’s V8 BUY and Lynie’s V8 SELL—that read price the same way, flip conditions symmetrically, and manage trades with the exact logic on opposite sides. Use either one standalone or run both together for full two-sided automation of entries, re-entries, caution states, and adaptive SL/TP.
✳️ What “mirrored” means here
Supertrend Tri-Stack (10/11/12):
BUY: ST10 primary pierce; ST12 fallback; “PAG Buy” when price pierces any ST while above the other two.
SELL: Exact inverse—ST10 primary pierce down; ST12 fallback; “PAG Sell” when price pierces any ST while below the other two.
Re-Enter Clusters:
BUY: Ratcheted up (Heikin-Ashi green holds/tightens).
SELL: Ratcheted down (Heikin-Ashi red holds/tightens).
Both sides use the same cluster age/decay math, care penalties, session awareness, and fast-candle tightening.
Care Flags (context risk):
Ichimoku, MACD, RSI combine into single and paired flags that tighten or widen offsets on both sides with the same scoring.
VWAP–EMA50 (5m) cluster gate:
Identical distance checks for BUY/SELL. When the mean cluster is present, offsets and labels adapt (tighter/“riskier scalp” messaging).
Golden Pocket A/B/C (prev-day):
Same fib boxes & labeling (gold tone) on both sides to call out TP-friendly zones.
SL/TP Envelope:
Shared dynamic engine: per-bar decay, fast-candle expansion, and care-based compress/relax—all mirrored for up/down.
Caution Labels:
BUY side prints CAUTION SELL if HA flips red inside an active long cluster.
SELL side prints CAUTION BUY if HA flips green inside an active short cluster.
Same latching & auto-release behavior.
🧠 Core workflow (both sides)
Primary trigger via ST10 pierce (structure shift) with an ST12 fallback when ST10 didn’t qualify.
PAG Mode when price is already on the right side of the other two STs—strongest conviction.
Cluster phase begins after a signal: ratcheted re-entry level, session-aware offsets, dynamic tightening on fast bars.
Care system shapes every re-entry & SL/TP label (Ichi/MACD/RSI combos + VWAP/EMA gate + QQE).
Protective layer: SL-wick and SL-body logic, caution flips, and “hold 1 bar” cluster carry after SL to avoid whipsaw spam.
🔎 Labels & messages (shared vocabulary)
Lynie’s / Lynie’s+ / Lynie’s++ — strength tiers (ST12 involvement & clean context).
Re-Enter / Excellent Re-Enter — cluster pullback quality; ratchet shows the “must-hold” zone.
SL&TP (n) — live offset multiplier the engine is using right now.
CAUTION BUY / CAUTION SELL — HA flip against the active side inside the cluster.
Restart Next Candle — visual cue to re-arm after a confirmed signal bar.
⚡ Why run both together
Continuity: When a long cycle ends (SL or caution degradation), the SELL engine is already tracking the inverse without re-tuning.
Symmetry: Same math, same signals, opposite direction—no hidden biases.
Coverage: Trend hand-offs are cleaner; you don’t miss early shorts after a long fade (and vice versa).
🔧 Recommended usage
Intraday futures (ES/NQ) or any liquid market.
Keep the VWAP–EMA cluster ON; it filters FOMO chases.
Honor Caution flips inside cluster—scale down or wait for the next clean re-enter.
Treat Golden Zones as TP magnets, not guaranteed reversals.
📌 Notes
Both scripts are Pine v6 and independent. Load BUY and SELL together for the full experience.
All offsets (re-enter & SL/TP) are visible in labels—so you always know why a zone is where it is.
Alerts are provided for signals, re-enter hits, caution, and SL events on both sides.
Summary: Lynie’s V8 BUY & SELL are vice-versa twins—one framework, two directions—delivering consistent entries, adaptive re-entries, and contextual risk management whether the market is pressing up or breaking down.

Scissors&Knifes V3.1✂️ The Scissors (PAG Chop V4 Engine)
🧠 Core idea
Scissors measure market compression and breakout readiness.
They use a modified Choppiness Index that looks at the relationship between:
True Range volatility (ATR × period length)
The total high–low range over the same window.
The smaller the ratio (sum of TR vs range), the more directional and impulsive the market is.
The higher the ratio, the more “sideways” the market trades.
This version smooths the result over PAG_SMOOTHLEN bars and applies several color bands that correspond to volatility states.
🎨 Color code meaning
Range State Color Interpretation
≤ 30 Strong Red #8B0000 Momentum exhaustion on downside, sellers dominating — about to reverse or already strong down-trend.
30 – 38 Brick Red #A52A2A Fading downside pressure; often the “bleeding edge” of a bearish climax.
38 – 55 Transparent black (α≈100) Neutral chop zone — indecision, range-building.
55 – 61.8 Yellow (optional) #DAA520 Early compression pocket where volatility starts contracting; the calm before a trend.
61.8 – 70 Bright Green #556B2F Energy release phase: volatility breaking out upward.
≥ 70 Strong Green #355E3B Sustained bullish drive, often continuation leg of a trend.
🪶 Secret nuance:
The transition bands (38–45 and 45–55) are treated as fully transparent to mark “dead zones.”
When PAG Chop sits here, all label activity pauses — the system resets its cluster memory so the next colored print begins a new “cluster”, letting you clearly see where fresh directional momentum starts.
🧩 Cluster logic
Every time a colored (non-transparent) reading appears, it belongs to a “color cluster.”
Grey labels (= count 1) mark the genesis of a new cluster, and following counts 2, 3, 4 … represent the internal continuity of that trend state.
You can optionally hide the first N grey or count 2 labels to reduce clutter on the initial stabilization bars.
✂️ Label meaning
Each label shows:
Emoji ✂️
Current count (e.g. ✂️ = 3 means 3 timeframes are simultaneously firing)
Optional list of the timeframes that contribute.
So a high count (e.g. 8–10) means many lower TFs are synchronizing volatility breakout — a multiframe alignment, often just before an acceleration burst.
🔪 The Knife (Mr Blonde V4 Engine)
🧠 Core idea
Mr Blonde converts the slope of a long EMA into an angle-of-attack metric — literally the “tilt” of market momentum.
It computes the EMA gradient relative to price span and rescales it into degrees (-5 ° to +5 °).
The steeper the angle, the stronger the directional push.
🎨 Color code meaning
Angle range Color Interpretation
≥ +5 ° Transparent (Black 1) Fully over-extended up move — wait for reset.
+3.57 – +5 ° Dark Red Strong upward slope, momentum apex.
+2.14 – +3.57 ° Orange Medium upward slope, trend acceleration zone.
+0.71 – +2.14 ° Light Orange Mild upward bias, pre-momentum phase.
0 to -0.71 ° Yellow Neutral transition.
-0.71 – -2.14 ° Olive Green Soft bearish slope.
-2.14 – -3.57 ° Olive Drab Building bearish momentum.
-3.57 – -5 ° Hunter Green Strong downward angle, aggressive push.
≤ -5 ° Transparent (Black 2) Oversold/over-tilted — likely exhaustion.
🪶 Secret nuance:
Mr Blonde uses a “span normalization” factor that divides EMA slope by the dynamic range of highs and lows.
This lets it compare angles fairly across assets with different volatility profiles (e.g. BTC vs ES) — it’s one of the rare EMA-angle implementations that self-scales properly.
🗡 Label meaning
Emoji 🔪
Count = how many TFs share the same momentum angle bias.
When many TFs show the same slope polarity (e.g. knife = 8), you’re in a deep momentum cascade — a “knife trend.”
💫 Yellow knife
The yellow state marks neutrality or slope flattening.
If you enable yellow visibility (mb_show_yellow), you can see where momentum cools off — often the earliest reversal hint.
⚙️ Shared mechanics between ✂️ and 🔪
Multi-timeframe sweep
The script cycles through 1 m → 10 m by default, running both engines once per TF.
Each returning true adds +1 to the count.
So:
sc_hits = count of timeframes where PAG fires + 1
knife_hits = count of timeframes where MB fires + 1
That “+1 shift” means there’s always at least 1, letting count = 1 represent the local TF itself.
Cluster limiter
If Limit max labels per cluster is on, you cap how many total symbols (both ✂️ & 🔪, including trails) can appear within one color phase — avoiding chart spam during extended trends.
Trails
Each printed label seeds a short-lived “trail” sequence — faded copies extending N bars forward.
Trails visualize the linger effect of the last signal, useful for visually connecting bursts in momentum.
Grey or count = 1 labels can have shorter or longer trails depending on your overrides (*_trail_bars_grey).
They’re purely visual and do not affect alerting.
Alerts
Alerts fire independently of whether you hide labels — unless you enable “respect filters”.
This guarantees you never miss a structural signal even if you suppress visuals for clarity.
🌈 Interpreting Both Together
Scenario Interpretation
✂️ = low (1–2) + 🔪 rising (red/orange) Market just leaving chop, early thrust stage.
✂️ = high (≥ 5) + 🔪 green Fully aligned breakout continuation — trend in progress.
✂️ = yellow cluster + 🔪 yellow Volatility squeeze, energy buildup — next expansion near.
✂️ = green cluster → 🔪 turns red Cross-state conflict; likely transition or correction.
✂️ = grey + 🔪 grey Reset condition — both engines cooling; stand aside.
💡 Hidden edge:
Scissors signal potential, Knife measures kinetic force.
The perfect storm is when ✂️ goes from yellow→green one bar before 🔪 shifts from orange→green — it catches the birth of directional flow while volatility is still tight.
🧭 Reading the labels intuitively
Grey ✂️/🔪 = 1 → embryonic state, may fizzle or bloom.
✂️/🔪 = 2 or 3 → expansion taking hold.
✂️/🔪 ≥ 4 (mid black) → strong synchronized drive across TFs.
Transparent gap → cluster reset; prepare for new phase.
Trail lines → echo of previous cluster strength.
Final secret tip 🗝
Because both engines are mathematically uncorrelated (volatility vs EMA angle), when they agree in color polarity on multiple TFs, you have one of the cleanest probabilistic trend windows possible.
If you ever see ✂️ = 6 + 🔪 = 6 both pointing the same way — that’s a “knife-through-the-scissors” moment: volatility expansion and directional slope synchronized — those are the bars where institutional algorithms tend to add size.

Zarattini Intra-day Threshold Bands (ZITB)This indicator implements the intraday threshold band methodology described in the research paper by Carlo Zarattini et al.
Overview:
Plots intraday threshold bands based on daily open/close levels.
Supports visualization of BaseUp/BaseDown levels and Threshold Upper/Lower bands.
Optional shading between threshold bands for easier interpretation.
Usage Notes / Limitations:
Originally studied on SPY (US equities), this implementation is adapted for NSE intraday market timing, specifically the NIFTY50 index.
Internally, 2-minute candles are used if the chart timeframe is less than 2 minutes.
Values may be inaccurate if the chart timeframe is more than 1 day.
Lookback days are auto-capped to avoid exceeding TradingView’s 5000-bar limit.
The indicator automatically aligns intraday bars across multiple days to compute average deltas.
For better returns, it is recommended to use this indicator in conjunction with VWAP and a volatility-based position sizing mechanism.
Can be used as a reference for Open Range Breakout (ORB) strategies.
Customizations:
Toggle plotting of base levels and thresholds.
Toggle shading between thresholds.
Line colors and styles can be adjusted in the Style tab.
Intended for educational and research purposes only.
This indicator implements the approach described in the research paper by Zarattini et al.
Note: This implementation is designed for the NSE NIFTY50 index. While Zarattini’s original study was conducted on SPY, this version adapts the methodology for the Indian market.
Methodology Explanation
This indicator is primarily designed for Open Range Breakout (ORB) strategies.
Base Levels
BaseUp = Maximum of today’s open and previous day’s close
BaseDown = Minimum of today’s open and previous day’s close
Delta Calculation
For the past 14 trading days (lookbackDays), the delta for each intraday candle is calculated as the ab
solute difference from the close of the first candle of that day.
Average Delta
For a given intraday time/candle today, deltaAvg is computed as the average of the deltas at the same time across the previous 14 days.
Threshold Bands
ThresholdUp = BaseUp + deltaAvg
ThresholdDown = BaseDown − deltaAvg
Signals
Spot price moving above ThresholdUp → Long signal
Spot price moving below ThresholdDown → Short signal
Tip: For better returns, combine this indicator with VWAP and a volatility-based position sizing mechanism.

cd_correlation_analys_Cxcd_correlation_analys_Cx
General:
This indicator is designed for correlation analysis by classifying stocks (487 in total) and indices (14 in total) traded on Borsa İstanbul (BIST) on a sectoral basis.
Tradingview's sector classifications (20) have been strictly adhered to for sector grouping.
Depending on user preference, the analysis can be performed within sectors, between sectors, or manually (single asset).
Let me express my gratitude to the code author, @fikira, beforehand; you will find the reason for my thanks in the context.
Details:
First, let's briefly mention how this indicator could have been prepared using the classic method before going into details.
Classically, assets could be divided into groups of forty (40), and the analysis could be performed using the built-in function:
ta.correlation(source1, source2, length) → series float.
I chose sectoral classification because I believe there would be a higher probability of assets moving together, rather than using fixed-number classes.
In this case, 21 arrays were formed with the following number of elements:
(3, 11, 21, 60, 29, 20, 12, 3, 31, 5, 10, 11, 6, 48, 73, 62, 16, 19, 13, 34 and indices (14)).
However, you might have noticed that some arrays have more than 40 elements. This is exactly where @Fikira's indicator came to the rescue. When I examined their excellent indicator, I saw that it could process 120 assets in a single operation. (I believe this was the first limit overrun; thanks again.)
It was amazing to see that data for 3 pairs could be called in a single request using a special method.
You can find the details here:
When I adapted it for BIST, I found it sufficient to call data for 2 pairs instead of 3 in a single go. Since asset prices are regular and have 2 decimal places, I used a fixed multiplier of $10^8$ and a fixed decimal count of 2 in Fikira's formulas.
With this method, the (high, low, open, close) values became accessible for each asset.
The summary up to this point is that instead of the ready-made formula + groups of 40, I used variable-sized groups and the method I will detail now.
Correlation/harmony/co-movement between assets provides advantages to market participants. Coherent assets are expected to rise or fall simultaneously.
Therefore, to convert co-movement into a mathematical value, I defined the possible movements of the current candle relative to the previous candle bar over a certain period (user-defined). These are:
Up := high > high and low > low
Down := high < high and low < low
Inside := high <= high and low >= low
Outside := high >= high and low <= low and NOT Inside.
Ignore := high = low = open = close
If both assets performed the same movement, 1 was added to the tracking counter.
If (Up-Up), (Down-Down), (Inside-Inside), or (Outside-Outside), then counter := counter + 1.
If the period length is 100 and the counter is 75, it means there is 75% co-movement.
Corr = counter / period ($75/100$)
Average = ta.sma(Corr, 100) is obtained.
The highest coefficients recorded in the array are presented to the user in a table.
From the user menu options, the user can choose to compare:
• With assets in its own sector
• With assets in the selected sector
• By activating the confirmation box and manually entering a single asset for comparison.
Table display options can be adjusted from the Settings tab.
In the attached examples:
Results for AKBNK stock from the Finance sector compared with GARAN stock from the same sector:
Timeframe: Daily, Period: 50 => Harmony 76% (They performed the same movement in 38 out of 50 bars)
Comment: Opposite movements at swing high and low levels may indicate a change in the direction of the price flow (SMT).
Looking at ASELS from the Electronic Technology sector over the last 30 daily candles, they performed the same movements by 40% with XU100, 73.3% (22/30) with XUTEK (Technology Index), and 86.9% according to the averages.
Comment: It is more appropriate to follow ASELS stock with XUTEK (Technology index) instead of the general index (XU100). Opposite movements at swing high and low levels may indicate a change in the direction of the price flow (SMT).
Again, when ASELS stock is taken on H1 instead of daily, and the length is 100 instead of 30, the harmony rate is seen to be 87%.
Please share your thoughts and criticisms regarding the indicator, which I prepared with a bit of an educational purpose specifically for BIST.
Happy trading.

Zarks 4H Range, 15M Triggers Pt1HTF Dividers + 4H Candle Structure + CRT Reference Tool
🔹 Vertical Blue Lines → represent divisions of the 4-hour timeframe, helping you visually segment intraday structure into HTF blocks.
Green Dotted Line → marks the High of each 4-hour interval.
🔵 Blue Dotted Line → shows the Open of that 4-hour interval.
⚫ Gray Dotted Line → displays the Close of that 4-hour interval.
🔴 Red Dotted Line → highlights the Low of that 4-hour interval.
💡 CRT Concepts (Candle Range Theory by Romeo TPT)
CRT signals are not direct buy/sell signals ❌💰 — they serve as contextual reference points 🧭.
A high-probability setup often appears when:
A 4H sweep of a previous candle’s high occurs 🐢 (liquidity manipulation),
Followed by a bearish 15-minute close,
Targeting the 50% retracement of that 4H candle’s range 🎯.
📊 Use this tool to frame market structure across timeframes, align entries with liquidity events, and visualize when price may be expanding from or reverting to institutional reference points.
This indicator is meant to be combined with vertical lines on the 15 min time frame at corresponding times example 1:45,4:45,9:45

AlfaBitcoin Dashboard – Estrategia Combinada (Juan + Gael)Integrate the TradingView (TV) indicators with the sessions from October 16 and 21 (Gael Sánchez Smith and Juan Rodríguez). We can build an alert system or dashboard that combines what was discussed in both sessions with your custom indicators on TradingView.

CCI [Hash Adaptive]Adaptive CCI Pro: Professional Technical Analysis Indicator
The Commodity Channel Index is a momentum oscillator developed by Donald Lambert in 1980. CCI measures the relationship between an asset's price and its statistical average, identifying cyclical turns and overbought/oversold conditions. The indicator oscillates around zero, with values above +100 indicating overbought conditions and values below -100 suggesting oversold conditions.
Standard CCI Formula: (Typical Price - Moving Average) / (0.015 × Mean Deviation)
This indicator transforms the traditional CCI into a sophisticated visual analysis tool through several key enhancements:
Implements dual exponential moving average smoothing to eliminate market noise
Preserves signal integrity while reducing false signals
Adaptive smoothing responds to market volatility conditions
Dynamic Color Visualization System
Continuous gradient transitions from red (bearish momentum) to green (bullish momentum)
Real-time color intensity reflects momentum strength
Eliminates discrete color jumps for fluid visual interpretation
Adaptive Intelligence Features
Dynamic overbought/oversold thresholds adapt to market conditions
Reduces false signals during high volatility periods
Maintains sensitivity during low volatility environments
Momentum Vector Analysis
Incorporates velocity calculations for early trend identification
Crossover detection with momentum confirmation
Advanced signal filtering reduces market noise
Extreme Level Analysis
Values above +100: Strong overbought conditions, potential reversal zones
Values below -100: Strong oversold conditions, potential buying opportunities
Zero-line crossovers: Momentum shift confirmation
Optimization Parameters
CCI Period (Default: 14)
Shorter periods (10-12): Increased sensitivity, more signals
Standard periods (14-20): Balanced responsiveness and reliability
Longer periods (21-30): Reduced noise, stronger signal confirmation
Smoothing Factor (Default: 5)
Lower values (1-3): Maximum responsiveness, suitable for scalping
Medium values (4-6): Balanced approach for swing trading
Higher values (7-10): Institutional-grade smoothness for position trading
Signal Sensitivity (Default: 6)
Conservative (7-10): High-probability signals, reduced frequency
Balanced (5-6): Optimal risk-reward ratio
Aggressive (1-4): Maximum signal generation, requires additional confirmation
Strategic Implementation
Oversold reversals in red zones with momentum confirmation
Zero-line breaks with sustained color transitions
Extreme readings followed by momentum divergence
Risk Management
Use extreme levels (+100/-100) for position sizing decisions
Monitor color intensity for momentum strength assessment
Combine with price action analysis for comprehensive market view
Market Context Application
Trending markets: Focus on momentum direction and extreme readings
Range-bound markets: Utilize overbought/oversold levels for mean reversion
Volatile markets: Increase smoothing parameters and signal sensitivity
Professional Advantages
Instantaneous momentum assessment through color visualization
Reduced cognitive load compared to traditional oscillators
Professional presentation suitable for client reporting
Adaptive Technology
Self-adjusting parameters reduce manual optimization requirements
Consistent performance across varying market conditions
Advanced mathematics eliminate common CCI limitations
The Adaptive CCI Pro represents the evolution of momentum analysis, combining Lambert's foundational CCI concept with modern computational techniques to deliver institutional-grade market intelligence through an intuitive visual interface.

Risk Leverage ToolRisk Leverage Tool – Calculate Position Size and Required Leverage
This script automatically calculates the optimal position size and the leverage needed based on the amount of capital you are willing to risk on a trade. It is designed for traders who want precise control over their risk management.
The script determines the distance between the entry and stop-loss price, calculates the maximum position size that fits within the defined risk, and derives the notional value of the trade. Based on the available margin, it then calculates the required leverage. It also displays the percentage of margin at risk if the stop-loss is hit.
All results are displayed in a table in the top-right corner of the chart. Additionally, a label appears at the entry price level showing the same data.
To use the tool, simply input your planned entry price, stop-loss price, the maximum risk amount in dollars, and the available margin in the settings menu. The script will update all values automatically in real time.
This tool works with any market where capital risk is expressed in absolute terms (such as USD), including futures, CFDs, and leveraged spot positions. For inverse contracts or percentage-based stops, manual adjustment is required.

HTF Session Boxes H4 > H2 > H1HTF Session Boxes H4 > H2 > H1
Visualize higher timeframe candle structures on lower timeframe charts with nested, customizable boxes.
Overview
HTF Session Boxes plots 4-hour, 2-hour, and 1-hour candle ranges as nested boxes directly on your lower timeframe charts (15M and below). This provides instant visual context of higher timeframe structure without switching between different chart timeframes.
Key Features
- Three Timeframe Levels: Simultaneously displays 4H, 2H, and 1H candle boxes
- Nested Design: Boxes are layered inside each other for clear hierarchical structure
- Real-Time Updates: Boxes dynamically adjust as higher timeframe candles develop
Fully Customizable:
-Individual colors and transparency for each timeframe
-Custom border colors, widths, and styles (solid, dashed, dotted)
-Toggle each timeframe on/off independently
Best Use Cases
-Scalping & Day Trading: Maintain awareness of higher timeframe structure while trading lower
timeframes
-Session Analysis: Clearly see 4H session boundaries and internal 2H/1H divisions
-Support/Resistance: Identify key levels where higher timeframe candles open, close, or create
highs/lows
-Multi-Timeframe Confluence: Spot when multiple timeframes align at key price levels

Liquidity Grab + RSI Divergence═══════════════════════════════════════════════════════════════
LIQUIDITY GRAB + RSI DIVERGENCE INDICATOR
═══════════════════════════════════════════════════════════════
📌 OVERVIEW
This indicator identifies high-probability reversals by combining:
• Liquidity sweeps (stop hunts)
• RSI divergence confirmation
• Filters false breakouts automatically
═══════════════════════════════════════════════════════════════
🟢 BUY SIGNAL (Green Triangle Up)
REQUIRES BOTH CONDITIONS:
1. Liquidity Grab Below Previous Low
• Price breaks BELOW recent low
• Candle CLOSES ABOVE that low
• Traps sellers who shorted the breakdown
2. Bullish RSI Divergence
• Price: Lower Low (LL)
• RSI: Higher Low (HL)
• Shows weakening downward momentum
➜ Result: Potential bullish reversal
═══════════════════════════════════════════════════════════════
🔴 SELL SIGNAL (Red Triangle Down)
REQUIRES BOTH CONDITIONS:
1. Liquidity Grab Above Previous High
• Price breaks ABOVE recent high
• Candle CLOSES BELOW that high
• Traps buyers who bought the breakout
2. Bearish RSI Divergence
• Price: Higher High (HH)
• RSI: Lower High (LH)
• Shows weakening upward momentum
➜ Result: Potential bearish reversal
═══════════════════════════════════════════════════════════════
📊 VISUAL INDICATORS
Main Signals:
🔺 Large Green Triangle = BUY (Liq Grab + Bullish Div)
🔻 Large Red Triangle = SELL (Liq Grab + Bearish Div)
Reference Levels:
━ Red Line = Previous High Level
━ Green Line = Previous Low Level
Additional Markers (Optional):
○ Small Green Circle = Liquidity grab low only
○ Small Red Circle = Liquidity grab high only
✕ Small Blue Cross = Bullish divergence only
✕ Small Orange Cross = Bearish divergence only
═══════════════════════════════════════════════════════════════
⚙️ SETTINGS
1. Lookback Period (Default: 20)
• Range: 5-100
• Sets how far back to identify previous highs/lows
• Higher = fewer but stronger levels
• Lower = more frequent but weaker levels
2. RSI Length (Default: 14)
• Range: 5-50
• Standard RSI calculation period
• 14 is industry standard
3. RSI Divergence Lookback (Default: 5)
• Range: 3-20
• Controls pivot point sensitivity
• Higher = fewer divergence signals
• Lower = more divergence signals
4. Show Labels (Default: ON)
• Toggle BUY/SELL text labels
• Disable for cleaner chart view
═══════════════════════════════════════════════════════════════
💡 HOW TO USE
Step 1: WAIT FOR CONFIRMATION
• Only trade LARGE TRIANGLE signals
• Ignore small circles/crosses alone
Step 2: CHECK TIMEFRAME
• Best on: 15min, 1H, 4H, Daily
• Avoid: 1min, 5min (too noisy)
Step 3: CONFIRM CONTEXT
• Check overall market trend
• Identify key support/resistance
• Look for confluence with price action
Step 4: ENTRY & RISK MANAGEMENT
• Enter on signal candle close or pullback
• Stop loss below/above the liquidity grab wick
• Target: Previous swing high/low or key levels
• Risk/Reward: Minimum 1:2 ratio
Step 5: SET ALERTS
• Create alert for "BUY Signal"
• Create alert for "SELL Signal"
• Never miss opportunities
═══════════════════════════════════════════════════════════════
✅ BEST PRACTICES
DO:
✓ Use on multiple timeframes for confluence
✓ Combine with support/resistance zones
✓ Wait for both conditions (liq grab + divergence)
✓ Practice on demo account first
✓ Use proper position sizing
DON'T:
✗ Trade every small circle/cross
✗ Use on very low timeframes (<15min)
✗ Ignore overall market context
✗ Trade without stop loss
✗ Risk more than 1-2% per trade
═══════════════════════════════════════════════════════════════
⚠️ IMPORTANT NOTES
• This is a CONFIRMATION tool, not a holy grail
• No indicator is 100% accurate
• Combine with your trading strategy
• Backtest on your preferred instruments
• Adjust parameters for your trading style
• Higher timeframes = more reliable signals
• Always use risk management
═══════════════════════════════════════════════════════════════
🔔 ALERTS INCLUDED
Two alert conditions are built-in:
1. "BUY Signal" - Liquidity Grab + Bullish RSI Divergence
2. "SELL Signal" - Liquidity Grab + Bearish RSI Divergence
═══════════════════════════════════════════════════════════════
📈 RECOMMENDED SETTINGS BY TIMEFRAME
5-15 Min Charts:
• Lookback: 10-15
• RSI Length: 14
• RSI Div Lookback: 3-5
1H-4H Charts:
• Lookback: 20-30
• RSI Length: 14
• RSI Div Lookback: 5-7
Daily Charts:
• Lookback: 30-50
• RSI Length: 14
• RSI Div Lookback: 7-10
═══════════════════════════════════════════════════════════════
Good luck and trade safe! 🚀

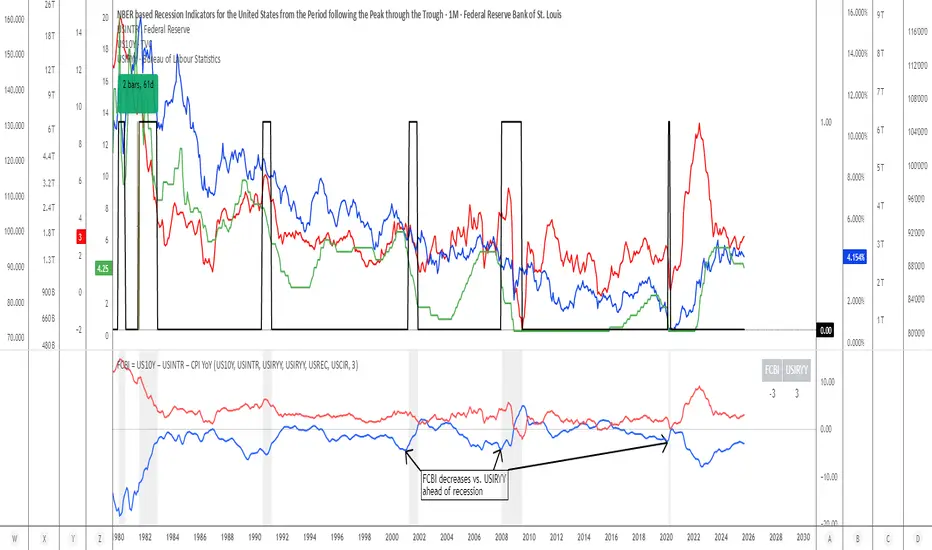
FCBI Brake PressureBrake Pressure (FCBI − USIRYY)
Concept
The Brake Pressure indicator quantifies whether the bond market is braking or releasing liquidity relative to real yields (USIRYY).
It is derived from the Financial-Conditions Brake Index (FCBI) and expresses the balance between long-term yield pressure and real-rate dynamics.
Formula
Brake Pressure = FCBI − USIRYY
where FCBI = (US10Y) − (USINTR) − (CPI YoY)
Purpose
While FCBI measures the intensity of financial-condition pressure, Brake Pressure shows when that brake is being applied or released.
It captures the turning point of liquidity transmission in the financial system.
How to Read
Brake Pressure < 0 (orange) → Brake engaged → financial conditions tighter than real-rate baseline; liquidity constrained.
Brake Pressure ≈ 0 → Neutral zone → transition phase between tightening and easing.
Brake Pressure > 0 (teal) → Brake released → financial conditions looser than real-rate baseline; liquidity flows freely → late-cycle setup before recession.
Zero-Cross Logic
Cross ↑ above 0 → FCBI > USIRYY → brake released → liquidity acceleration → typically 6–18 months before recession.
Cross ↓ below 0 → FCBI < USIRYY → brake re-engaged → tightening resumes.
Historical Behavior
Each major U.S. recession (2001, 2008, 2020) was preceded by a Brake Pressure cross above zero after a negative phase, signaling that long yields had stopped resisting Fed cuts and liquidity was expanding.
Practical Use
• Identify late-cycle turning points and liquidity inflection phases.
• Combine with FCBI for a complete macro transmission picture.
• Watch for sustained positive readings as early macro-recession warnings.
Current Example (Oct 2025)
FCBI ≈ −3.1, USIRYY ≈ +3.0 → Brake Pressure ≈ −6.1 → Brake still engaged. When this crosses above 0, it signals that liquidity is free flowing and the recession countdown has begun.
Summary
FCBI shows how tight the brake is. Brake Pressure shows when the brake releases.
When Brake Pressure > 0, the system has entered the liquidity-expansion phase that historically precedes a U.S. recession.
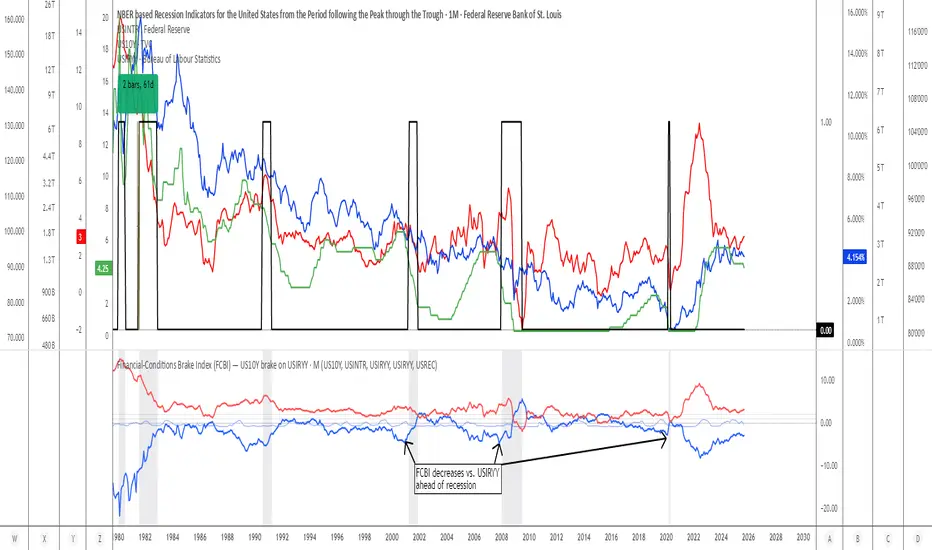
Financial-Conditions Brake Index (FCBI) — US10Y brake on USIRYYFinancial-Conditions Brake Index (FCBI) – US10Y Brake on USIRYY
Concept
The Financial-Conditions Brake Index (FCBI) measures how U.S. long-term yields (US10Y) interact with the Federal Funds Rate (USINTR) and inflation (CPI YoY) to shape real-rate conditions (USIRYY).
It visualizes whether the bond market is tightening or loosening overall financial conditions relative to the Federal Reserve’s policy stance.
Formula
FCBI = (US10Y) − (USINTR) − (CPI YoY)
How It Works
The FCBI expresses the difference between the long-term yield curve and short-term policy rates, adjusted for inflation. It shows whether the long end of the curve is amplifying or counteracting the Fed’s stance.
FCBI > +2 → Strong brake → Long yields remain elevated despite easing → tight conditions → recession delayed.
FCBI +1 to +2 → Mild brake → Financial transmission slower; lag ≈ 12–18 months.
FCBI 0 to +1 → Neutral → Typical early post-cut environment.
FCBI < 0 → Accelerator → Long yields and inflation expectations falling → liquidity flows freely → recession often follows within 6–14 months.
How to Read the Chart
Blue line (FCBI) shows the strength of the financial brake.
Red line (USIRYY) represents the real yield baseline.
Recession shading (gray) marks NBER recessions for comparison.
FCBI < USIRYY → Brake engaged → financial conditions tighter than real-rate baseline.
FCBI > USIRYY → Brake released → long end easing faster than policy → liquidity surge → late-cycle setup.
Historically, U.S. recessions begin on average about 14 months after the first Fed rate cut, and a decline of the FCBI below zero often precedes that window.
Practical Use
Use the FCBI to identify when policy transmission is blocked (brake engaged) or flowing (brake released).
Cross-check with yield-curve inversions, Fed policy shifts, and inflation expectations to estimate macro timing windows.
Current Example (Oct 2025)
FCBI ≈ −3.1, USIRYY ≈ +3.0 → Brake still engaged.
Once FCBI rises above USIRYY and crosses positive, it signals the “brake released” phase — historically the final liquidity surge before a U.S. recession.
Summary
FCBI shows how tight the brake is.
USIRYY shows how fast the car is moving.
When FCBI rises above USIRYY, the brake is released — liquidity accelerates and the historical recession countdown begins.

RBLR - GSK Vizag AP IndiaThis indicator identifies the Opening Range High (ORH) and Low (ORL) based on the first 15 minutes of the Indian equity market session (9:15 AM to 9:30 AM IST). It draws horizontal lines extending these levels until market close (3:30 PM IST) and generates visual signals for price breakouts above ORH or below ORL, as well as reversals back into the range.
Key features:
- **Range Calculation**: Captures the high and low during the opening period using real-time bar data.
- **Line Extension**: Lines are dynamically extended bar-by-bar within the session for clear visualization.
- **Signals**:
- Green triangle up: Crossover above ORH (potential bullish breakout).
- Red triangle down: Crossunder below ORL (potential bearish breakout).
- Yellow labels: Reversals from breakout levels back into the range.
- **Labels**: "RAM BAAN" marks the ORH (inspired by a precise arrow from the Ramayana), and "LAKSHMAN REKHA" marks the ORL (inspired by a protective boundary line from the same epic).
- **Customization**: Toggle signals on/off and select line styles (Dotted, Dashed, Solid, or Smoothed, with transparency for Smoothed).
The state-tracking logic prevents redundant signals by monitoring if price remains outside the range after a breakout. This helps users observe range-bound behavior or directional moves without built-in alerts. This indicator is particularly useful for day trading on longer intraday timeframes (e.g., 15-minute charts) to identify session-wide trends and avoid noise in shorter frames. For best results, apply on intraday timeframes on NSE/BSE symbols. Note that lines and labels are limited to the script's max counts to avoid performance issues on long histories.
**Disclaimer**: This indicator is for educational and informational purposes only and does not constitute financial, investment, or trading advice. Trading in financial markets involves significant risk of loss and is not suitable for all investors. Past performance is not indicative of future results. Users should conduct their own research, consider their financial situation, and consult with qualified professionals before making any investment decisions. The author and TradingView assume no liability for any losses incurred from its use.
