TPO Levels [VAH/POC/VAL] with Poor H/L, Single Prints & NPOCs### 🎯 Advanced Market Profile & Key Level Analysis
This script is a unique and comprehensive technical analysis tool designed to help traders understand market structure, value, and key liquidity levels using the principles of **Auction Market Theory** and **Market Profile**.
This script is unique (and shouldn't be censored) because :
It allows large history of levels to be displayed
Accurate as possible tick size
Doesn't draw a profile but only the actual levels
Supports multi-timeframe levels even on the daily mode giving macro context
There is no indicator out there that does it
While these concepts are universal, this indicator was built primarily for the dynamic, 24/7 nature of the **cryptocurrency market**. It helps you move beyond simple price action to understand *why* the market is moving, which is especially crucial in the volatile crypto space.
### ## 📊 The Concepts Behind the Calculations
To use this script effectively, it's important to understand the core concepts it is built upon. The entire script is self-contained and does not require other indicators.
* **What is Market Profile?**
Market Profile is a unique charting technique that organizes price and time data to reveal market structure. It's built from **Time Price Opportunities (TPOs)**, which are 30-minute periods of market activity. By stacking these TPOs, the script builds a distribution, showing which price levels were most accepted (heavily traded) and which were rejected (lightly traded) during a session.
* **What is the Value Area (VA)?**
The Value Area is the heart of the profile. It represents the price range where **70%** of the session's trading volume occurred. This is considered the "fair value" zone where both buyers and sellers were in general agreement.
* **Point of Control (POC):** The single price level with the most TPOs. This was the most accepted or "fairest" price of the session and acts as a gravitational line for price.
* **Value Area High (VAH):** The upper boundary of the 70% value zone.
* **Value Area Low (VAL):** The lower boundary of the 70% value zone.
VAH and VAL are dynamic support and resistance levels. Trading outside the previous session's value area can signal the start of a new trend.
***
### ## 📈 Key Features Explained
This script automatically calculates and displays the following critical market-generated information:
* **Multi-Timeframe Market Profile**
Automatically draws Daily, Weekly, and Monthly profiles, allowing you to analyze market structure across different time horizons. The script preserves up to 20 historical sessions to provide deep market context.
* **Naked Point of Control (nPOC)**
A "Naked" POC is a Point of Control from a previous session that has **not** been revisited by price. These levels often act as powerful magnets for price, representing areas of unfinished business that the market may seek to retest. The script tracks and displays Daily, Weekly, and Monthly nPOCs until they are touched.
* **Single Prints (Imbalance Zones)**
A Single Print is a price level where only one TPO traded during the session's development. This signifies a rapid, aggressive price move and an imbalanced market. These areas, like gaps in a traditional chart, are frequently revisited as the market seeks to "fill in" these thin parts of the profile.
* **Poor Structure (Unfinished Auctions)**
A **Poor High** or **Poor Low** occurs when the top or bottom of a profile is flat, with two or more TPOs at the extreme price. This suggests that the auction in that direction was weak and inconclusive. These weak structures often signal a high probability that price will eventually break that high or low.
***
### ## 💡 How to Use This Indicator
This tool is not a signal generator but an analytical framework to improve your trading decisions.
1. **Determine Market Context:** Start by asking: Is the current price trading *inside* or *outside* the previous session's Value Area?
* **Inside VA:** The market is in a state of balance or range-bound. Look for trades between the VAH and VAL.
* **Outside VA:** The market is in a state of imbalance and may be starting a trend. Look for continuation or acceptance of prices outside the prior value.
2. **Identify Key Levels:**
* Use historical **nPOCs** as potential profit targets or areas to watch for a price reaction.
* Treat historical **VAH** and **VAL** levels as significant support and resistance zones.
* Note where **Single Prints** are. These are often price magnets that may get "filled" in the future.
3. **Spot Weakness:**
* A **Poor High** suggests weak resistance that may be easily broken.
* A **Poor Low** suggests weak support, signaling a potential for a continued move lower if broken.
***
### ## ⚙️ Customization & Crypto Presets
The indicator is highly customizable, allowing you to change colors, transparency, the number of historical sessions, and more.
To help traders get started quickly, the indicator includes **built-in layout presets** specifically calibrated for major cryptocurrencies: ** BINANCE:BTCUSDT.P , BINANCE:ETHUSDT.P , and BINANCE:SOLUSDT.P **. These presets automatically adjust key visual parameters to better suit the unique price characteristics and volatility of each asset, providing an optimized view right out of the box.
***
### ## ⚠️ Disclaimer
This indicator is a tool for market analysis and should not be interpreted as direct buy or sell signals. It provides information based on historical price action, which does not guarantee future results. Trading involves significant risk, and you should always use proper risk management. This script is designed for use on standard chart types (e.g., Candlesticks, Bar) and may produce misleading information on non-standard charts.
Educational

Value Investing IndicatorThis is based on PeterNagy Indicator. I just update it from v.4 to v.6 and modify. Open for tweak

GC Checklist Signals (All TF, v6 • SR-safe • Clean blocks)GC (COMEX Gold) checklist strategy with a 3:1 reward-to-risk to your training bot. It enforces the following rules:
Heiken Ashi chart logic for color, wicks, and doji detection
100-EMA filter (only buys above / sells below)
Market structure: higher-low above EMA for buys; lower-high below EMA for sells (simple pivot check)
Clean pullback: at least 2 opposite-color candles; clean = no top wicks (buys) / no bottom wicks (sells)
Entry: on high-volume doji (body ≤ ~12% of range and volume ≥ last 1–3 candles), as soon as it closes
Stops: sell = above doji high; buy = below doji low

GC Checklist Signals (All Timeframes, v6)GC (COMEX Gold) checklist strategy with a 3:1 reward-to-risk to your training bot. It enforces your rules:
Heiken Ashi chart logic for color, wicks, and doji detection
100-EMA filter (only buys above / sells below)
Market structure: higher-low above EMA for buys; lower-high below EMA for sells (simple pivot check)
Clean pullback: at least 2 opposite-color candles; clean = no top wicks (buys) / no bottom wicks (sells)
Entry: on high-volume doji (body ≤ ~12% of range and volume ≥ last 1–3 candles), as soon as it closes
Stops: sell = above doji high; buy = below doji low

Chartlense Dashboard (Data, Trend & Levels)Chartlense Dashboard (Data, Trend & Levels)
Overview
This dashboard is designed to solve two common problems for traders: chart clutter and the manual drawing of support and resistance levels . It consolidates critical data from multiple indicators into a clean table overlay and automatically plots the most relevant S&R levels based on recent price action. The primary goal is to provide a clear, at-a-glance overview of the market's structure and data.
It offers both a vertical and horizontal layout to fit any trader's workspace.
Key Concepts & Calculations Explained
This indicator is more than a simple collection of values; it synthesizes data to provide unique insights. Here’s a conceptual look at how its core components work:
Automatic Support & Resistance (Pivot-Based):
The dashed support (green) and resistance (red) lines are not manually drawn. They are dynamically calculated based on the most recent confirmed pivot highs and pivot lows . A pivot is a foundational concept in technical analysis that identifies potential turning points in price action.
How it works: A pivot high is a candle whose `high` is higher than a specific number of candles to its left and right (the "Pivot Lookback" is set to 5 by default in the settings). A pivot low is the inverse. By automatically identifying these confirmed structural points, the script visualizes the most relevant levels of potential supply and demand on the chart.
Relative Volume (RVOL):
This value in the table is not the standard volume. It measures the current bar's volume against its recent average (specifically, `current volume / 10-period simple moving average of volume`).
Interpretation: A reading above 2.0 (indicated by green text) suggests that the current volume is more than double the recent average. This technique is used to identify significant volume spikes, which can add conviction to breakouts or signal potential market climaxes.
Consolidated Data for Context:
Other values displayed in the table, such as the EMAs (9, 20, 200) , Bollinger Bands (20, 2) , RSI (14) , MACD (12, 26, 9) , and VWAP (on intraday charts), use their standard industry calculations. They are included to provide a complete contextual picture without needing to load each indicator separately, saving valuable chart space.
How to Use This in Your Trading
This dashboard is designed as a tool for confluence and context , not as a standalone signal generator. Here are some ways to integrate it into your analysis workflow:
As a Trend Filter: Before considering a trade, quickly glance at the EMAs and the MACD values in the table. A price above the key EMAs and a positive MACD can serve as a quick confirmation that you are aligned with the dominant trend.
To Validate Breakouts: When the price is approaching a key Resistance level (red pivot line), watch the RVOL value . A reading above 2.0 on the breakout candle adds significant confirmation that the move is backed by strong interest. The same logic applies to breakdowns below a support level.
To Spot Potential Reversals: Confluence is key. For example, if the price is testing a Support level (green pivot line) AND the RSI in the table is approaching oversold levels (e.g., near 30), it can signal a higher probability reversal setup.
About This Indicator
This indicator was developed by the team at ChartLense to help traders declutter their charts and focus on the data that matters. We believe in making complex analysis more accessible and organized. We hope this free tool is a valuable addition to your trading process.

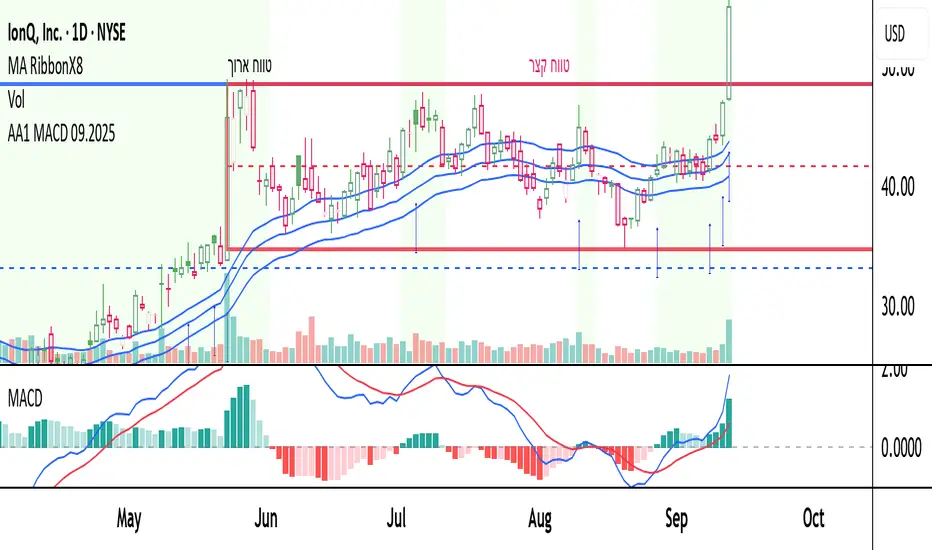
AA1 MACD 09.2025this is a learing project i want to share
the script is open for anyone
I combain some ema's mcad and more indicators to help find stocks in momentum
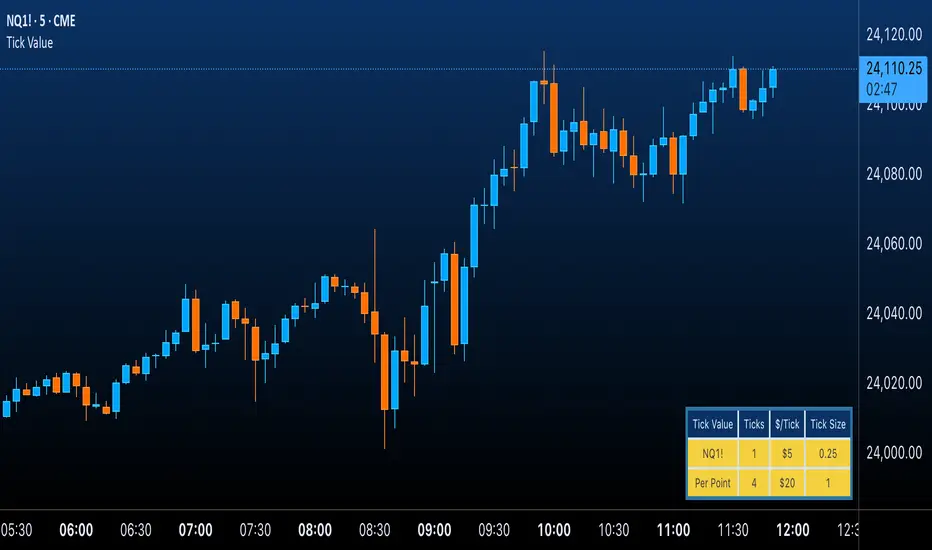
Futures Tick & Point Value [BoredYeti]Futures Tick & Point Value
This utility displays tick size, dollars per tick, and (optionally) a per-point row for the current futures contract.
Features
• Hardcoded $/tick map for common CME/NYMEX/CBOT/COMEX contracts
• Automatic fallback using pointvalue * mintick for any other symbol
• Table settings: adjustable position, text size, customizable colors
• Optional “Per Point” row showing ticks and $/point
Notes
• Contract specs can vary by broker/exchange and may change over time. Always confirm with official specifications.
• Educational tool only; not financial advice.
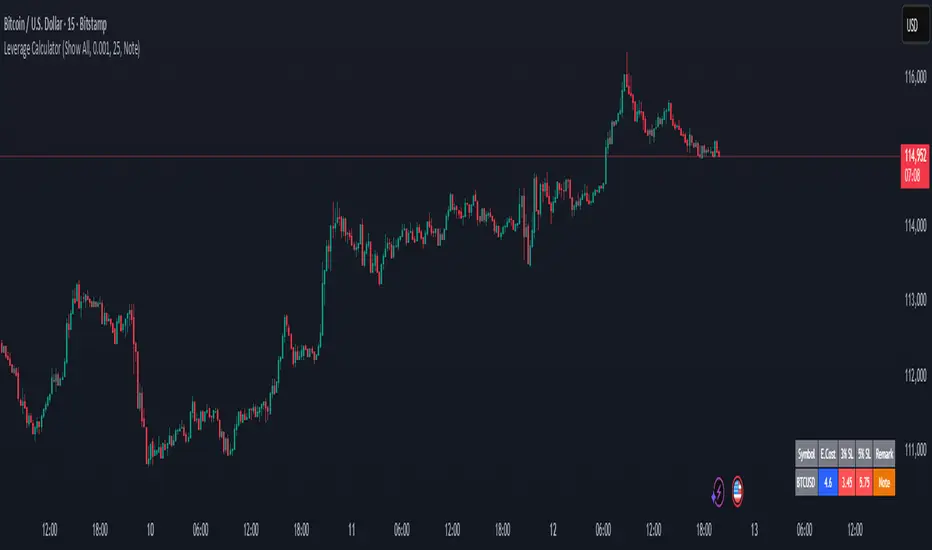
Margin Cost Calculator Screener - Taylor V1.2# Leverage Position Cost Calculator & Stop Lose Cost Screener #
Designed to provide traders with crucial insights into their leveraged positions directly on the TradingView chart.
Key Features:
> Dynamic Display: Choose to view only the estimated entry cost, or a comprehensive overview including potential losses at specific stop-loss levels, and a custom remark.
> Contract Size Input: Easily specify the contract size for your trades.
> Leverage Level Input: Set your desired leverage level, with helpful tooltips explaining the margin requirements for various leverage ratios (e.g., 25x, 10x, 5x) and an included fee estimate.
> Cost Calculation: Accurately calculates the estimated entry cost for your position based on the current market price, contract size, and leverage.
> Stop-Loss Projections: It projects potential losses for stop-loss orders set at 3% and 5% below the entry price, helping you manage risk effectively.
> Clear Table Visualization: All calculated data is presented in a clean, organized table anchored to the bottom-left of your chart, making it easy to reference at a glance.
> Symbol Identification: Automatically displays the short ticker symbol for the asset you are analyzing.
This tool is invaluable for traders who utilize leverage and need a quick, visual way to understand their financial exposure and potential outcomes before entering or managing a trade.
CyberFX EMA21 Strategy (Pine v5)This is a simple indicator that can be used for a simple strategy. It follows the logic of the price always move back to the media, in that case an EMA(21). This give us an opportunity to achieve a better R/R. One important thing here is this indicator works better on trend markets. When the market is in consolidation mode it will show many signals so we need to pay attention and be patient. This indicator works better in 4H timeframes but it can used with other TFs.
The idea behind is:
for a bullish move when the price moves back to the EMA(21) we check the distance between the low value and the EMA(21) value. The best is when the price low crosses the EMA(21) from above. I am considering a 8 pips distance from the price low to the ema as a signal. Then I will wait for the new candle to move above the EMA(21) for a long entry. I also consider at least 50 pips for SL.
for a bearish move the idea is the same but we consider the price high crossing the EMA(21) and the new candle moving below the EMA.
I hope this can be useful and please leave your comment nad critics(but only the constructive one).
Have a safe trade

HUll Dynamic BandEducational Hull Moving Average Wave Analysis Tool
**MARS** is an innovative educational indicator that combines multiple Hull Moving Average timeframes to create a comprehensive wave analysis system, similar in concept to Ichimoku Cloud but with enhanced smoothness and responsiveness.
---
🎯 Key Features
**Triple Wave System**
- **Peak Wave (34-period)**: Fast momentum signals, similar to Ichimoku's Conversion Line
- **Primary Wave (89-period)**: Main trend identification with retest detection
- **Swell Wave (178-period)**: Long-term trend context and major wave analysis
**Visual Wave Analysis**
- **Wave Power Fill**: Dynamic area between primary and swell waves showing trend strength
- **Peak Power Fill**: Short-term momentum visualization
- **Smooth Curves**: Hull MA-based calculations provide cleaner signals than traditional moving averages
**Intelligent Signal System**
- **Trend Shift Signals**: Clear visual markers when trend changes occur
- **Retest Detection**: Identifies potential retest opportunities with specific conditions
- **Correction Alerts**: Early warning signals for market corrections
---
📊 How It Works
The indicator uses **Hull Moving Averages** with **Fibonacci-based periods** (34, 89, 178) and a **Golden Ratio multiplier (1.64)** to create natural market rhythm analysis.
**Key Signal Types:**
- 🔵 **Circles**: Major trend shifts (primary wave crossovers)
- 💎 **Diamonds**: Retest opportunities with multi-wave confirmation
- ❌ **X-marks**: Correction signals and structural breaks
- 🌊 **Wave Fills**: Visual trend strength and direction
---
🎓 Educational Purpose
This indicator demonstrates:
- Advanced moving average techniques using Hull MA
- Multi-timeframe analysis in a single view
- Wave theory application in technical analysis
- Dynamic support/resistance concept visualization
**Similar to Ichimoku but Different:**
- Ichimoku uses price-based calculations → Angular cloud shapes
- MARS uses weighted averages → Smooth, flowing wave patterns
- Both identify trend direction, but MARS offers faster signals with cleaner visualization
---
⚙️ Customizable Settings
- **Wave Periods**: Adjust primary wave length (default: 89)
- **Multipliers**: Fine-tune wave sensitivity (default: 1.64 Golden Ratio)
- **Visual Style**: Customize line widths and signal displays
- **Peak Analysis**: Independent fast signal system (default: 34)
---
🔍 Usage Tips
1. **Trend Identification**: Watch wave fill colors and line positions
2. **Entry Timing**: Look for retest diamonds after trend shift circles
3. **Risk Management**: Use wave boundaries as dynamic support/resistance
4. **Confirmation**: Combine with price action and market structure analysis
---
⚠️ Important Notes
- **Educational Tool**: Designed for learning wave analysis concepts
- **Not Financial Advice**: Always use proper risk management
- **Backtesting Recommended**: Test on historical data before live trading
- **Combine with Analysis**: Works best with additional confirmation methods
---
🚀 Innovation
MARS represents a unique approach to wave analysis by:
- Combining Hull MA smoothness with Ichimoku-style visualization
- Providing multi-timeframe analysis without chart clutter
- Offering retest detection with specific wave conditions
- Creating an educational bridge between different analytical methods
---
*This indicator is shared for educational purposes to help traders understand advanced moving average techniques and wave analysis concepts. Always practice proper risk management and combine with your own analysis.*

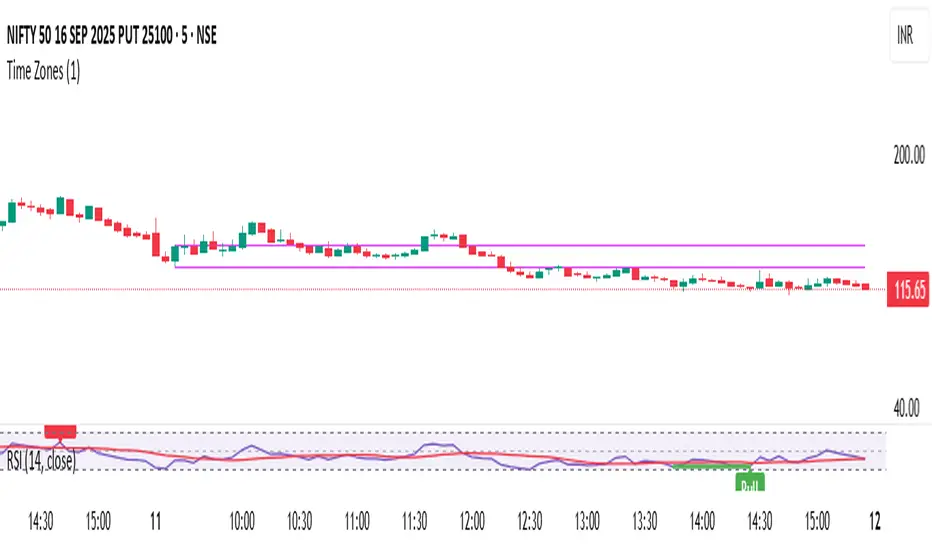
Time ZonesThis indicator plots Horizontal lines for specific time on the chart as per the time selected and then trade accordingly
EMA 200 MultiTF G/R + Cross Alerts by LifeHack Trader1. Indicator Setup
The script starts by defining the version of Pine Script (v5) and creating an indicator called "EMA 200 MultiTF G/R + Cross Alerts by LifeHack Trader."
The overlay=true parameter ensures that the indicator is plotted directly on the price chart.
2. Function to Get EMA200
A custom function getEma200 is defined to retrieve the 200-period Exponential Moving Average (EMA) for a specified timeframe (tf).
This function uses the request.security function to fetch the close price's EMA from different timeframes.
3. Calculate EMA200 for Multiple Timeframes
The script calculates the EMA200 for four timeframes: 15 minutes ("15"), 1 hour ("60"), 4 hours ("240"), and 1 day ("D").
These values are stored in variables (ema15, ema1h, ema4h, ema1d) and represent the EMA for each timeframe.
4. Determine Price Above or Below EMA200 (G/R)
For each timeframe, the script checks whether the closing price is above or below the EMA200.
It uses boolean checks to determine if the price is above the EMA200, assigning the status "G" (Green) for above and "R" (Red) for below.
5. Cross Signal Detection (Up/Down)
The script detects crossovers and crossunders between the price and EMA200 for each timeframe.
A crossover signal is detected when the price crosses above the EMA200 (bullish), and a crossunder signal is detected when the price crosses below the EMA200 (bearish).
These signals are stored in separate variables (crossUp, crossDown).
6. Display a Table with G/R Status and Cross Alerts
A table is created and displayed in the top-right corner of the chart. The table shows the status (G or R) for each timeframe and the cross signal (▲ for crossover, ▼ for crossunder, or - for no cross event).
The table is updated with the respective values for each timeframe every time a new bar is formed.
7. Alert Conditions
The script defines alert conditions based on the crossovers and crossunders.
When a price crosses above the EMA200 (cross-up), an alert is triggered for a potential buy opportunity. When the price crosses below the EMA200 (cross-down), an alert is triggered for a potential sell opportunity.
Alerts are configured for each timeframe (15 minutes, 1 hour, 4 hours, and 1 day).
This script provides a comprehensive system for monitoring price action relative to the EMA200 on multiple timeframes, highlighting crossovers, and delivering visual feedback and alerts based on the price's relationship with the EMA.

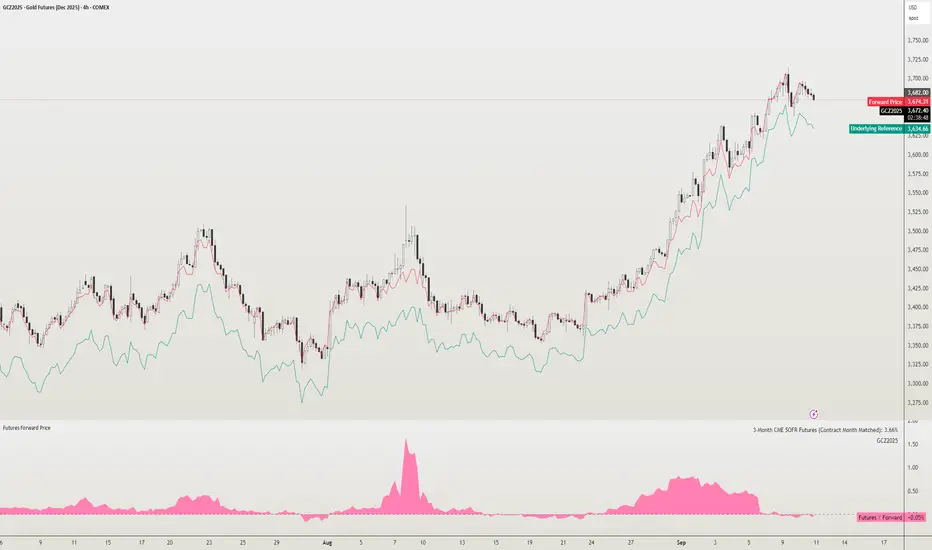
Futures Forward Price [NeoButane]In futures markets, the theoretical value of a futures contract can be derived from its underlying price and cost of carry. By baking in the costs and potential yields, the theoretical forward price then be used in basis against futures prices in place of the underlying spot price.
Usage
The script creates plots on the main chart and a separate window pane. Both are meant to be used to visualize dislocations in the market.
By using a futures vs. forward basis instead of futures vs. spot basis, discounts in the market are clearer.
Last month, the gold futures market GCZ2025 traded >1% above forward price when tariffs were announced and fell back in line once the tariffs were verbally retracted.
View roll spreads over a back-adjusted continuous chart. I guess. I don't think spread traders only look at one chart. This is as educational for me as it is you.
Configuration
The underlying reference needs to be changed to match the futures contract you are using.
The Risk-Free Rate defaults to FRED:SOFR. I found the contract month matched 3-Month SOFR Futures to be the closest for forward price.
Risk-Free Rate: The interest rate source for forward price.
Constant Risk-Free Rate: a static interest rate that can be used in advance of future changes in risk-free rate.
Underlying Reference: spot or index price. Some examples include TVC:SPX, TVC:GOLD, CRYPTO:BTCUSD, TVC:USOIL.
Forward Price Compounding: determines which formula to use. They're similar and become closer as the contract matures.
Alternative Contract: enable and select a futures contract to use it on a chart different than the main.
Storage Cost and Yield: for use with commodities. I haven't found a proper use for them yet but enabling is simple if you are able to.
The following are meant to be used with the continuous formula as they are compounded. However the rate sources don't differ much for the purpose of futures prices.
3-Month CME SOFR Futures
3-Month ICEEUR SONIA Futures
3-Month Osaka TONA Futures
The other rate sources are either meant for futures contracts shorter than quarterly such as monthly crypto futures or were meant to help myself understand how different rates would align with futures prices, like inflation.
What this script does
It uses the cost of carry formula to output the forward price (red line). The underlying reference (green line) is plotted alongside and a futures-derived reference (blue line) can be displayed to see how it looks next to the real reference price.
The data pane displays either the nominal difference or percentage difference between the real futures price and the calculated forward price.
Further reading
www.investopedia.com
www.cmegroup.com
www.oxfordenergy.org
www-2.rotman.utoronto.ca
www.cmegroup.com
3-month rate futures
www.cmegroup.com
www.ice.com
www.bankofengland.co.uk
www.jpx.co.jp
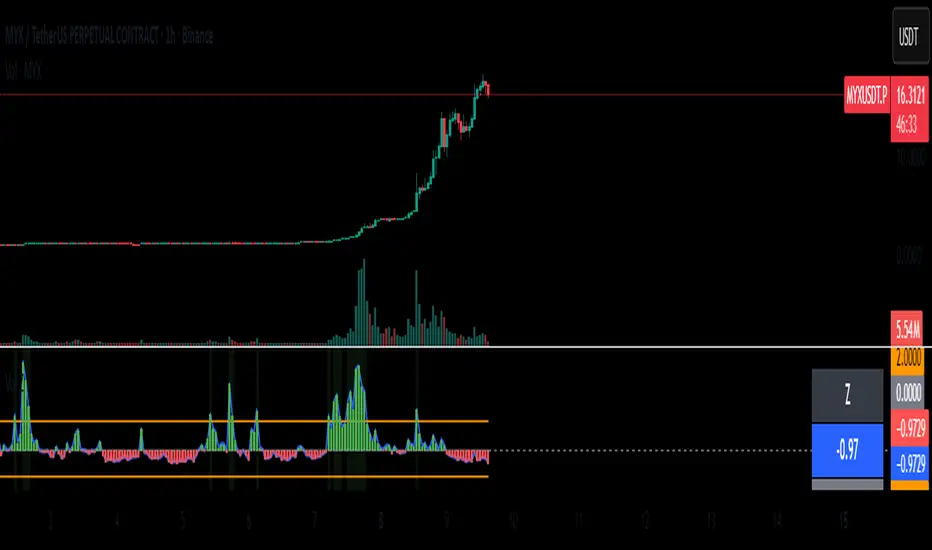
Normalized Volume Z-Score
The Normalized Volume Z-Score indicator measures how unusual the current trading volume is compared to its recent history.
It calculates the z-score of volume over a user-defined lookback period (default: 50 bars), optionally using log-volume normalization.
A z-score tells you how many standard deviations today’s volume is away from its mean:
Z = 0 → volume is at its average.
Z > 0 → volume is higher than average.
Z < 0 → volume is lower than average.
Threshold lines (±2 by default) highlight extreme deviations, which often signal unusual market activity.
How to Trade with It
High positive Z-score (> +2):
Indicates abnormally high volume. This often happens during breakouts, strong trend continuations, or capitulation events.
→ Traders may look for confirmation from price action (e.g., breakout candle, strong trend bar) before entering a trade.
High negative Z-score (< –2):
Indicates unusually low volume. This may signal lack of interest, consolidation, or exhaustion.
→ Traders may avoid entering new positions during these periods or expect potential reversals once volume returns.
Cross back inside thresholds:
When z-score returns inside ±2 after an extreme spike, it may suggest that the abnormal activity has cooled down.
Tips
Works best when combined with price structure (support/resistance, demand/supply zones).
Can be applied to crypto, stocks, forex, futures – anywhere volume is meaningful.
Log normalization helps reduce distortion when some days have extremely large volumes.
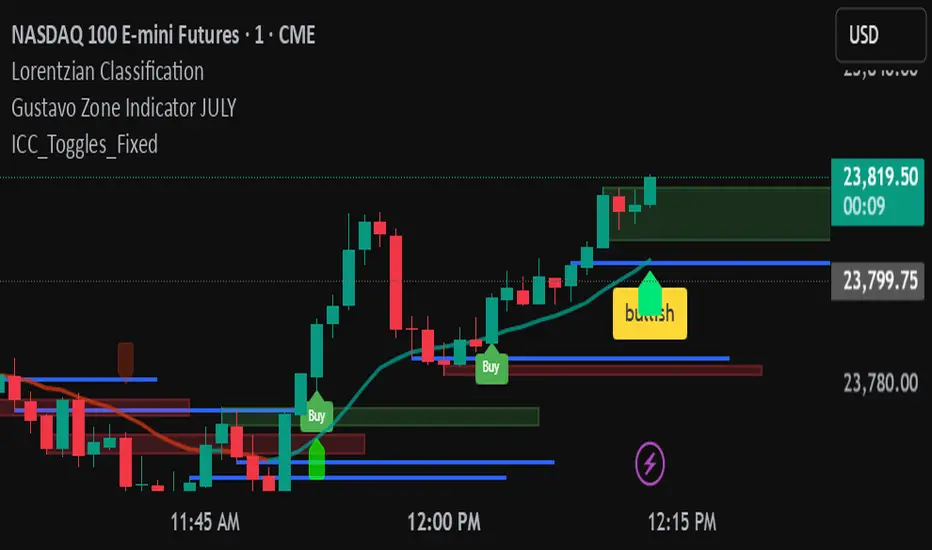
ICC Indicator V6An adjustable Pine Script v6 “ICC” indicator that detects Indication → Correction → Continuation market structure across timeframes with optional volume confirmation, plots swing levels and zones, shows editable labels and toggleable yellow buy/sell triangle signals, and includes debug tools for tuning.
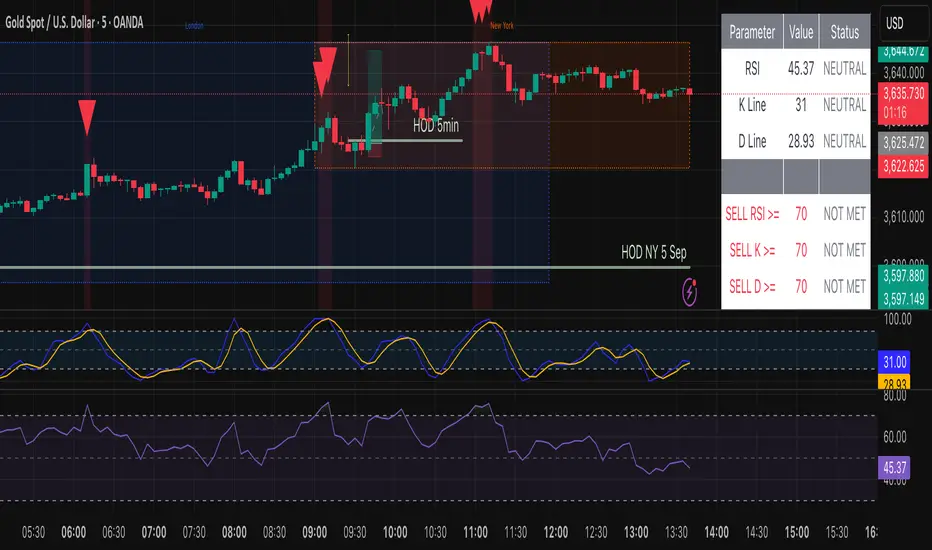
by A.Alasfoor RSI + Stochastic Alert with Doji Confirmationa buy and sell signals upon :
1- Sell : red hammer break (lower body) of 5min , ensure the wick is equal to or longer than the red body range.
2- Buy: Green hammer (upper body) break of 5min , ensure the wick is equal to or longer than the red body range.
Trigger buy/sell upon the break clean at 1min of the body closing level, risking (SL) the earlier 1 min tops/lows.
Credits to Ahmed Alasfoor & Zakariya Hamad AlJulandani by Sumou Oman
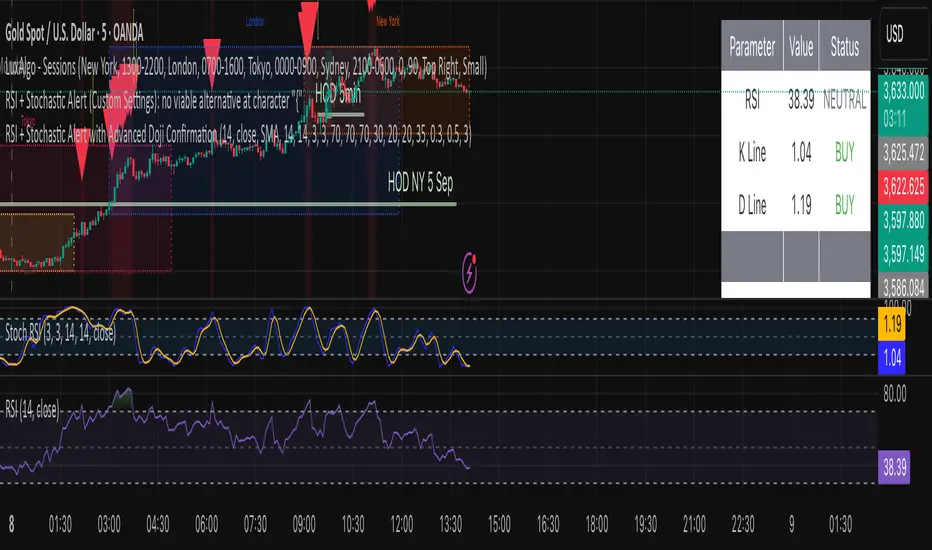
RSI + Stochastic Alert with Advanced Doji ConfirmationCredits to Ahmed Alasfoor and Somou by Zakariya Hamad AlJulandani
عكفة الماكد المتقدمة - أبو فارس ©// 🔒 Advanced MACD Curve © 2025
// 💡 Idea & Creativity: Engineer Abu Elias
// 🛠️ Development & Implementation: Abu Fares
// 📜 All intellectual rights reserved - Copying, modifying, or redistributing is not permitted
// 🚫 Any attempt to tamper with this code or violate intellectual property rights is legally prohibited
// 📧 For inquiries and licensing: Please contact the developer, Abu Fares

عكفة الماكد المتقدمة - أبو فارس ©// 🔒 عكفة الماكد المتقدمة © 2025
// 💡 فكرة وإبداع: المهندس أبو الياس
// 🛠️ تطوير وتنفيذ: أبو فارس
// 📜 جميع الحقوق الفكرية محفوظة - لا يُسمح بالنسخ أو التعديل أو إعادة التوزيع
// 🚫 أي محاولة للعبث بهذا الكود أو انتهاك الحقوق الفكرية مرفوضة قانونياً
// 📧 للاستفسارات والتراخيص: يرجى التواصل مع المطور أبو فارس
// 🔒 Advanced MACD Curve © 2025
// 💡 Idea & Creativity: Engineer Abu Elias
// 🛠️ Development & Implementation: Abu Fares
// 📜 All intellectual rights reserved - Copying, modifying, or redistributing is not permitted
// 🚫 Any attempt to tamper with this code or violate intellectual property rights is legally prohibited
// 📧 For inquiries and licensing: Please contact the developer, Abu Fares

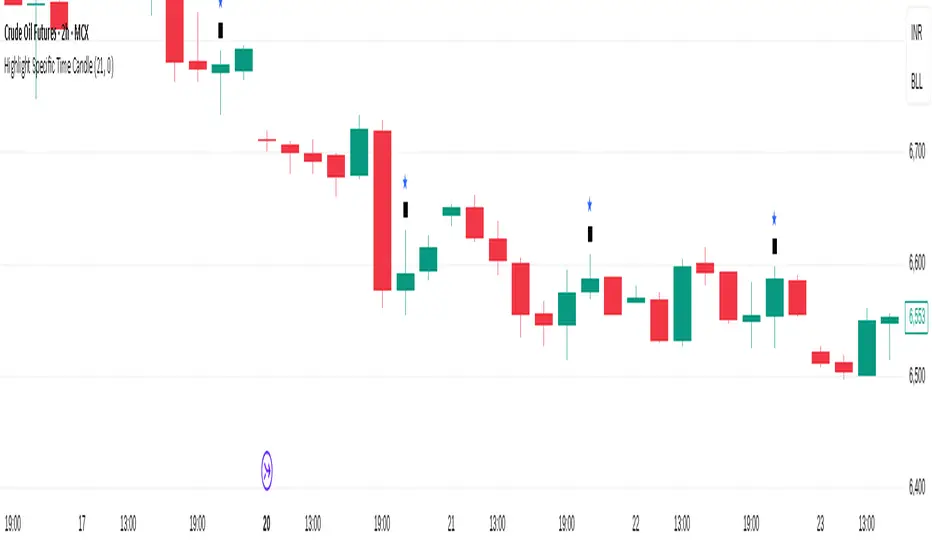
Highlight Specific Time CandleThis is a simple Pine Script tool that marks candles occurring at a chosen time of the day. You can set the hour and minute (in 24-hour format) from the inputs, and whenever a candle’s timestamp matches that time, the indicator highlights it with a symbol above the bar and an optional background colour.
This is useful for:
Identifying key intraday times (e.g., market open, midday, closing).
Spotting how price reacts at scheduled events (economic data releases, news times).
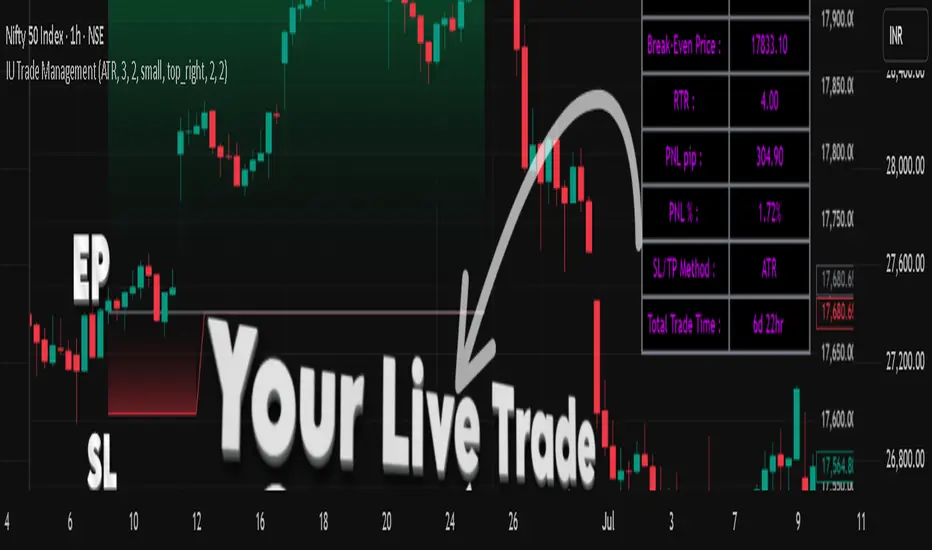
IU Trade ManagementDESCRIPTION
IU Trade Management is a powerful utility tool designed to help traders manage their trades with precision and clarity. It provides automated Stop Loss, Take Profit, and Break Even calculations using multiple customizable methods. Along with clear SL/TP plotting on the chart, it also displays a detailed trade status table that tracks every important detail including entry price, SL/TP levels, break-even, PNL, and trade duration. This tool is perfect for traders who want to manage risk and rewards visually and systematically.
USER INPUTS :
-Entry Candle Time: Default 20 Jul 2021 00:00 +0300 (select the candle from which the trade begins)
- Entry Price: Default 2333 (define the price at which the trade is executed)
- Trade Direction: Default Long (choose between Long or Short)
- SL/TP Method: Default ATR (options: ATR, Points/Pips, Percentage %, Standard Deviation, Highest/Lowest, Previous High/Low)
- Risk to Reward: Default 3 (set custom risk-to-reward ratio)
- Use Break Even: Default false (option to enable break-even)
- Plot Break Even Line: Default false (option to display BE line)
- RTR of Break Even Point: Default 2 (factor used for BE calculation)
SL/TP Method Specific Inputs:
- ATR Length: Default 14
- ATR Factor: Default 2
- Points/Pips: Default 100
- Percentage: Default 1%
- Standard Deviation Length: Default 20
- Standard Deviation Factor: Default 2
- Highest/Lowest Length: Default 10
Trade Status Table Settings:
- Show Trade Status: Default true
- Table Size: Default small (options: normal, tiny, small, large)
- Table Position: Default top right
- Frame Width: Default 2
- Table Color: Default black
- Frame Color: Default gray
- Border Width: Default 2
- Border Color: Default gray
- Text Color: Default purple (RGB 212, 0, 255)
HOW TO USE THE INDICATOR:
1. Set the entry candle time and entry price manually.
2. Select whether the trade is Long or Short.
3. Choose the preferred SL/TP calculation method (ATR, Percentage, Points, STD, High/Low, Previous High/Low).
4. Define your risk-to-reward ratio and enable break-even if required.
5. The indicator will automatically plot your Entry, Stop Loss, Take Profit, and Break Even levels on the chart.
6. A detailed trade management table will appear, showing trade direction, SL, TP, PNL (points and %), SL/TP method, and total trade time.
WHY IT IS UNIQUE:
- Offers multiple methods to calculate SL and TP (ATR, Percentage, Points, Standard Deviation, High/Low, Previous High/Low)
- Built-in Break Even functionality for risk-free trade management
- Real-time PNL tracking in both points and percentage
- Trade status table for complete transparency on all trade details
- Visual plotting of SL, TP, and Entry with color-coded zones for clarity
HOW USER CAN BENEFIT FROM IT :
- Helps traders manage risk and reward with discipline
- Eliminates guesswork by automating SL and TP levels
- Provides clear visual guidance on trade exits and risk management
- Enhances decision-making with live trade tracking and performance statistics
- Suitable for manual traders as a trade manager and for strategy developers as a risk management reference
Global Liquidity Proxy (Fed + ECB + BoJ + PBoC)Global Liquidity Proxy (Fed + ECB + BoJ + PBoC) Vs BTC
