Moving Average ProjectionDisplays 2-5 moving averages (solid lines) and projects their future trajectory (dashed lines) based on current trend momentum. This helps you anticipate where key MAs are heading and identify potential future support/resistance levels.
Important: Projections show where MAs would move IF the current trend continues—they're not predictions. Market conditions change, so use projections as planning tools, not trading signals.
General Settings
Number of MAs (2-5) controls how many moving averages display on your chart. Start with 2-3 to avoid clutter. Projection Bars (1-100) determines how far into the future to project—use 10-20 for intraday charts and 20-40 for daily charts. Lookback for Slope (2-100) sets the number of bars used to calculate trend slope, where shorter lookbacks are more responsive and longer ones are smoother. The default of 20 works well for most situations.
Individual MA Settings (MA 1-5)
Each MA has four settings: Length sets the period for the MA (common values are 9, 20, 50, 100, and 200), Type lets you choose between SMA, EMA, WMA, HMA, VWMA, or RMA (EMA is most popular), Color sets the historical MA line color, and Projection Color sets the projected line color (usually a lighter or transparent version of the main color).
MA Types Quick Reference: EMA is most popular and responsive to recent prices. SMA gives equal weight to all periods and is the smoothest. HMA is very responsive with low lag. VWMA incorporates volume data.
Quick Setup Examples
Day Trading: 3 MAs (9/21/50 EMA), 10-15 projection bars, 10-15 lookback
Swing Trading: 2 MAs (50/200 EMA), 20-30 projection bars, 20 lookback
Scalping: 2 MAs (9/20 EMA), 5-10 projection bars, 5-10 lookback
How to Use
Trend Identification: An uptrend shows price above rising MAs with projections pointing up. A downtrend shows price below falling MAs with projections pointing down. Consolidation appears as flat MAs with horizontal projections.
Support & Resistance: Rising MA projections act as future dynamic support levels, while falling MA projections act as future dynamic resistance levels.
Anticipating Changes: Watch for projected MA crossovers before they happen. When projections converge, expect volatility or consolidation. Steep projections suggest unsustainable trends, so be cautious. Flat projections indicate ranging markets.
Trade Planning: Check the current trend using MA alignment, then look at projections to gauge trend continuation likelihood. Use projected MA levels for potential targets or stop placement.
Important Tips
When Projections Work Best: Projections are most reliable in stable trending markets with consistent momentum, low volatility environments, and away from major news events.
When to Be Cautious: Use caution during high volatility or choppy price action, around major economic releases, when projections show extreme or parabolic angles, and during trend transitions.
Combine With Other Analysis: Don't trade projections alone. Use them alongside price action, volume, support and resistance levels, and other indicators for confirmation.
Best Practices
Start with 2-3 MAs to avoid chart clutter. Match your projection and lookback bars to your trading timeframe. Use consistent color schemes for quick interpretation. Adjust settings as market conditions change. Always use proper risk management—projections are planning tools, not guarantees.
Troubleshooting
Projections not showing: Check that Projection Bars > 0 and you're viewing the most recent bar
Chart too cluttered: Reduce number of MAs or increase projection color transparency
Projections too volatile: Increase lookback bars or switch to EMA/SMA from HMA
Can't see certain MAs: Verify "Number of MAs" setting includes them (MA 3 won't show if set to 2)
ממוצע נע אקספוננציאלי (EMA)

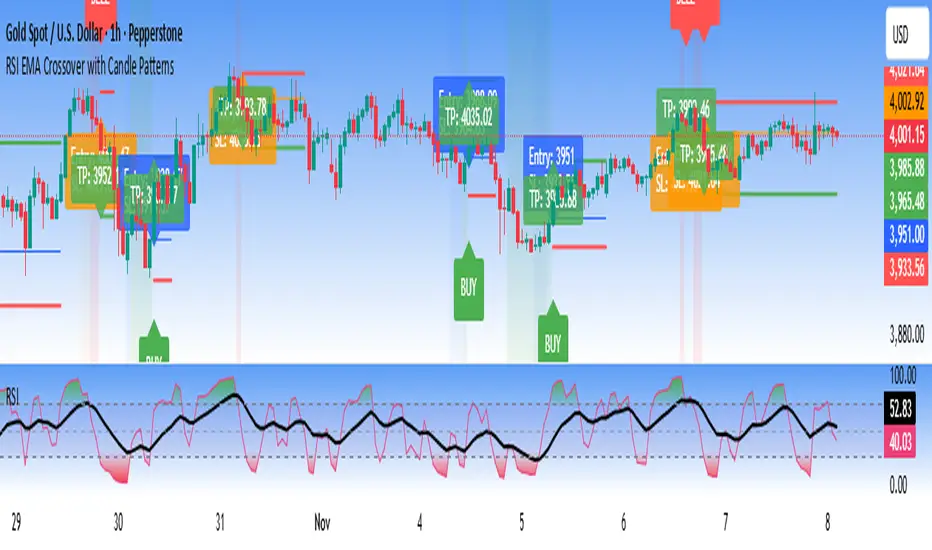
RSI EMA Crossover with Price ActionThe RSI and RSI's EMA Crossover with Price Action (1:2 Risk-Reward) strategy combines Momentum, Trend confirmation, and Basic price-action logic to generate high-probability trade setups with Proper Risk Management.
This script identifies entries when the RSI crosses a key threshold and aligns with an RSI - EMA crossover, confirming Exhaustion of a current trend and Price action confirms the Change in Trend direction. It integrates price action filters to avoid false signals during low-volatility or choppy conditions.
The strategy also includes a risk-management module, setting a fixed 1:2 risk-to-reward ratio — automatically placing a take-profit target twice the size of the stop loss. Also the Stop loss can be adjusted to nearest swing low or last 3 candles Low. to avoid Stoploss hunt.
Features
✅ RSI and EMA crossover confirmation for directional bias
✅ Basic price-action validation (optional filters)
✅ Configurable stop-loss and take-profit levels (default 1:2)
✅ Visual trade markers for entries and exits
Disclaimer: This script is intended for educational and research purposes only. It should not be considered financial advice or a guaranteed trading system. Users are encouraged to test and optimize parameters before using in live markets.
The 5-min StratOverview
The 5-min Strat Indicator V1 is a precision tool designed for intraday futures trading on instruments such as MNQ, MES, and other U.S. equity index futures. It marks out critical levels from Pre-Market and Regular Trading Hours (RTH) to support breakout, reversal, and trend-following strategies.
This indicator includes:
Previous Day High (PDH) and Low (PDL) from RTH session only (9:30 AM to 4:00 PM EST)
Pre-Market High (PMH) and Low (PML) from 4:00 AM to 9:30 AM EST
48 EMA and 200 EMA
Clean, right-aligned labels for each key level
⏱️ Intended Timeframe
✅ 5-minute timeframe ONLY
❌ Not designed for 1-min, 15-min, or higher timeframes
Built using 5-min data to precisely define Pre-Market and RTH levels
🌐 Markets
Futures contracts like:
MNQ (Micro Nasdaq)
MES (Micro S&P)
NQ, ES (standard contracts)
Can be adapted for stocks or ETFs, but built around futures session logic
📌 Key Sessions
Pre-Market Session: 04:00 AM to 09:30 AM EST
PMH/PML captured in real time
Locked after 09:30 AM
Regular Trading Hours (RTH): 09:30 AM to 4:00 PM EST
PDH/PDL captured only from this time window
Locks at end of day and displays the next session
🚨 Non-Negotiables / Must-Know Constraints
Feature Constraint
Timeframe Must be used on 5-minute charts
Timezone All sessions are based on EST (New York)
Symbol Type Built and tested for futures like MNQ/MES
Pre-Market Lock PMH/PML are only locked after 9:30 AM EST
RTH Data PDH/PDL ignore overnight sessions — only 9:30–16:00
Labels Automatically reset each day and appear on the price axis
🎯 Usage Tips
Combine with price action at these levels for breakouts or fades
Use the EMAs for directional bias
Great for layering onto automated strategy logic (strategy version available)

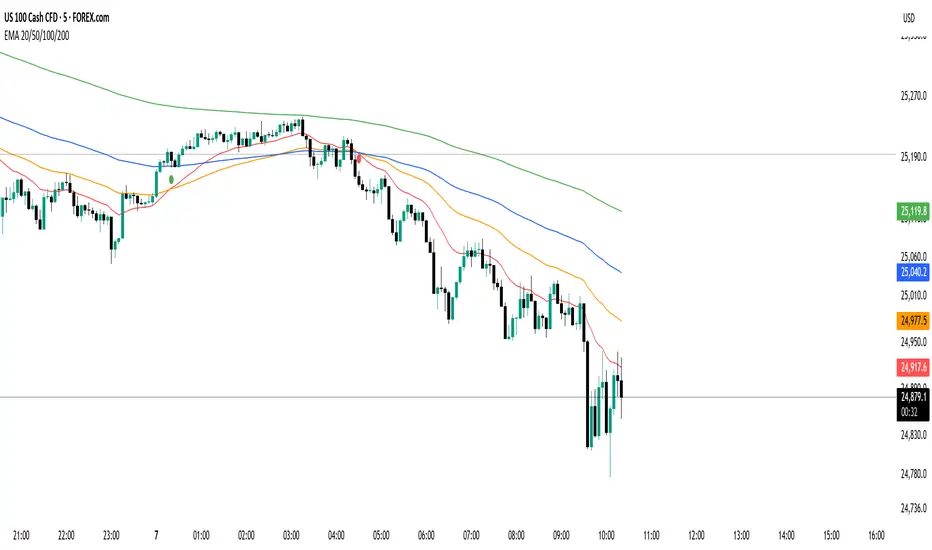
EMA 20/50/100/200 Trader IkkaEMA 20/50/100/200 📊 + Crossover Alerts 🔔 Trader Ikka
This indicator plots four key Exponential Moving Averages (EMA 20, 50, 100, and 200) to help identify trends.
It also detects and marks bullish 🟢 and bearish 🔴 crossovers between the EMA 20 and EMA 50, signaling potential trend reversals or continuations.
✨ Features:
📊 Plots EMA 20, 50, 100, and 200 with color-coded lines
🟢🔴 Highlights bullish and bearish crossovers between EMA 20 & EMA 50
🔔 Built-in alert conditions for automated notifications
⚡ Useful for identifying momentum shifts and entry/exit zones
QuantumFlow MTF System Extended
QuantumFlow MTF System Extended
Multi-Timeframe Directional Flow & Volatility Alignment Engine — Higher-Timeframe Edition
The QuantumFlow MTF System Extended is a higher-timeframe analytical framework that expands upon the original QuantumFlow concept.
While the base version focuses on short-term structures (1M – 15M), this edition is designed for traders who need to observe medium- to long-term directional harmony across the 30M, 45M, 1H, 2H, 3H and 4H timeframes.
Its purpose is to provide a structured, non-repainting overview of how momentum and volatility align over broader market horizons — helping traders understand the prevailing directional flow rather than predicting future prices.
Concept
The system aggregates confirmed Supertrend directions from each higher timeframe, converting them into normalized bullish or bearish values.
These values are then processed through dual-layer EMA momentum filters that validate the directional strength of each component.
The resulting matrix displays a precise snapshot of how higher-timeframe market structures are synchronized — serving as a compass of directional alignment rather than a buy/sell signal generator.
A multi-ATR framework defines adaptive volatility zones, allowing each instrument to react proportionally to its intrinsic volatility profile.
This approach smooths sensitivity shifts that often occur between intraday and multi-hour structures, delivering consistent analytical behavior across asset classes.
How It Works
Confirmed Multi-Timeframe Supertrend
Each timeframe produces a close-confirmed Supertrend direction, ensuring signal stability and preventing repainting.
Adaptive Multi-ATR Model
Multiple ATR instances with distinct deviation factors define dynamic volatility thresholds that self-adjust to market conditions.
Dual EMA Momentum Validation
Two independent EMA layers filter and confirm each Supertrend direction, improving directional clarity and reliability.
Flow Totals Engine
The indicator sums all timeframe states into real-time bullish/bearish totals and percentage ratios, clearly visualized within a single panel.
Configurable Alerts (Optional)
Users may set threshold-based alerts when directional alignment reaches specified intensity levels (for example, when all timeframes are synchronized).
Full Customization
All visual elements — colors, text, background, and layout — can be adjusted to match personal preferences or chart themes.
Intended Use and Benefits
Observe how higher-timeframe trends align to reveal medium-term directional bias.
Quantify the balance of bullish vs bearish momentum across multiple timeframes.
Combine with lower-timeframe analysis (e.g. the original QuantumFlow System) to establish multi-layer confirmation between short- and mid-term flows.
Maintain awareness of trend synchronization or divergence without relying on subjective chart interpretation.
This indicator does not provide trading signals, forecasts, or financial advice.
It is an analytical tool intended to assist users in studying market structure and volatility behavior.
Chart Display
QuantumFlow Extended presents a unified dashboard that lists each analyzed timeframe, its active directional state, and the overall flow balance in numeric and percentage form.
It functions seamlessly on all instruments and can be used standalone or alongside the original short-term version.
Access
This is an invite-only indicator.
To request access or additional information, please contact the author privately via the TradingView profile.

Analog Flow [KedArc Quant]Overview
AnalogFlow is an advanced analogue based market projection engine that reconstructs future price tendencies by matching current price behavior to historical analogues in the same instrument. Instead of using traditional indicators such as moving averages, RSI, or regression, AnalogFlow applies pattern vector similarity analysis - a data driven technique that identifies historically similar sequences and aggregates their subsequent movements into a smooth, forward looking curve.
Think of it as a market memory system:
If the current pattern looks like one we have seen before, how did price move afterward?
Why AnalogFlow Is Unique
1. Pattern centric - it does not rely on any standard indicator formula; it directly analyzes price movement vectors.
2. Adaptive - it learns from the same instrument's past behavior, making it self calibrating to volatility and regime shifts.
3. Non repainting - the projection is generated on the latest completed bar and remains fixed until new data is available.
4. Noise resistant - the EMA Blend engine smooths the projected trajectory, reducing random variance between analogues.
Inputs and Configuration
Pattern Bars
Number of bars in the reference pattern window: 40
Projection Bars
Number of bars forward to project: 30
Search Depth
Number of bars back to look for matching analogues: 600
Distance Metric
Comparison method: Euclidean, Manhattan, or Cosine (default Euclidean)
Matches
Number of top analogues to blend (1-5): Top 3
Build Mode
Projection type: Cumulative, MeanStep, or EMA Blend (default EMA Blend)
EMA Blend Length
Smoothness of the projected path: 15
Normalize Pattern
Enable Z score normalization for shape matching: true
Dissimilarity Mode
If true, finds inverse analogues for mean reversion analysis: false
Line Color and Width
Style settings for projection curve: Blue, width 2
How It Works with Past Data
1. The system builds a memory bank of patterns from the last N bars based on the scanDepth value.
2. It compares the latest Pattern Bars segment to each historical segment.
3. It selects the Top K most similar or dissimilar analogues.
4. For each analogue, it retrieves what happened after that pattern historically.
5. It averages or smooths those forward moves into a single composite forecast curve.
6. The forecast (blue line) is drawn ahead of the current candle using line.new with no repainting.
Output Explained
Blue Path
The weighted mean future trajectory based on historical analogues.
Smoother when EMA Blend mode is enabled.
Flat Section
Indicates low directional consensus or equilibrium across analogues.
Upward or Downward Slope
Represents historical tendency toward continuation or reversal following similar conditions.
Recommended Timeframes
Scalping / Short Term
1m - 5m : Short winLen (20-30), small ahead (10-15)
Swing Trading
15m - 1h : Balanced settings (winLen 40-60, ahead 20-30)
Positional / Multi Day
4h - 1D : Large windows (winLen 80-120, ahead 30-50)
Instrument Compatibility
Works seamlessly on:
Stocks and ETFs
Indices
Cryptocurrency
Commodities (Gold, Crude, etc.)
Futures and F&O (both intraday and positional)
Forex
No symbol specific calibration needed. It self adapts to volatility.
How Traders Can Use It
Forecast Context
Identify likely short term price path or drift direction.
Reversal Detection
Flip seekOpp to true for mean reversion pattern analysis.
Scenario Comparison
Observe whether the current regime tends to continue or stall.
Momentum Confirmation
Combine with trend tools such as EMA or MACD for directional bias.
Backtesting Support
Compare projected path versus realized price to evaluate reliability.
FAQ
Q1. Does AnalogFlow repaint?
No. It calculates only once per completed bar and projects forward. The future path remains static until a new bar closes.
Q2. Is it a neural network or AI model?
Not in the machine learning sense. It is a deterministic analogue matching engine using statistical distance metrics.
Q3. Why does the projection sometimes flatten?
That means similar historical setups had no clear consensus in direction (neutral expectation).
Q4. Can I use it for live trading signals?
AnalogFlow is not a signal generator. It provides probabilistic context for upcoming movement.
Q5. Does higher scanDepth improve accuracy?
Up to a point. More depth gives more analogues, but too much can dilute recency. Try 400 to 800.
Glossary
Analogue
A past pattern similar to the current price behavior.
Distance Metric
Mathematical formula for pattern similarity.
Step Vector
Difference between consecutive closing prices.
EMA Blend
Exponential smoothing of the projected path.
Cumulative Mode
Adds sequential historical deltas directly.
Z Score Normalization
Rescaling to mean 0 and variance 1 for shape comparison.
Summary
AnalogFlow converts the market's historical echoes into a structured, statistically weighted forward projection. It gives traders a contextual roadmap, not a signal, showing how similar past setups evolved and allowing better informed entries, exits, and scenario planning across all asset classes.
Disclaimer
This script is provided for educational purposes only.
Past performance does not guarantee future results.
Trading involves risk, and users should exercise caution and proper risk management when applying this strategy.

ATR SL/TP Precision Zones (Dots)ATR SL/TP Precision Zones (Dots) is a volatility-based tool designed to help traders set accurate Stop Loss and Take Profit levels based on real market volatility — not fixed pips or emotion.
This indicator uses ATR (Average True Range) multiplied by 1.2 to calculate dynamic distance bands.
Instead of drawing a ribbon or channel, it places simple dots above and below each candle:
Upper Dot (Green) → Suggested Take Profit / Price Stretch Zone
Lower Dot (Red) → Suggested Stop Loss Cushion / Support Expansion Zone
Because ATR measures market volatility, these dots expand during high volatility and tighten during slow markets, helping traders avoid stop-loss hunts and premature exits.
Why This Works
Most traders lose because:
They set SL too close → stopped out by noise
They set TP too far → price never reaches it
This tool calibrates those distances automatically based on real price movement behavior.
ATR = volatility
Volatility = market breathing room
This indicator ensures your trade has room to breathe, increasing win consistency.
Best Use Cases
Scalping
Swing trading
Trend continuation entries
Reversal confirmations with support/resistance
Works on Crypto / Forex / Stocks / Futures

KD-NewAutoTrade for Future Trading - Heikin Ashi candles The KD-NewAutoTrade strategy is a dynamic trend-following indicator designed for scalping and swing trading across crypto, forex, and index futures. It combines the precision of EMA crossovers, RSI momentum, and ADX trend strength to deliver clear Buy/Sell signals with high reliability.
🔹 Core Logic
EMA Fast & Slow Crossover – Identifies short-term and long-term trend shifts.
RSI Confirmation – Filters out false signals by requiring RSI to cross custom Buy/Sell thresholds.
ADX Filter – Ensures trades only trigger when market trend strength exceeds your chosen ADX minimum.
🔹 Key Features
Visual Buy/Sell triangles directly on the chart.
Customizable inputs for EMA, RSI, and ADX lengths.
Works efficiently on all timeframes and all markets (Crypto, Indices, Stocks, Commodities).
Optional background highlights for active trade zones.
Alert conditions for both BUY and SELL setups – ready to use in automated strategies or alert bots.
🔹 Recommended Usage
Use Heikin Ashi candles
Works best on 1M - 5M timeframes.
Combine with volume or higher-timeframe trend confirmation for stronger signals.


(15M) Gold Daily SignalQuick Start
Symbol XAUUSD, timeframe 15m.
Defaults: TP 50 pips, SL 150 pips.
Wait for green (long) or red (short) background after bar close.
Place orders at the plotted Entry / TP / SL; optional scale-ins at E1/E2.
Max signals kept on chart – housekeeping only (limits old drawings).
Alerts
Turn Green → ready-to-buy signal.
Turn Red → ready-to-sell signal.
Create alerts once per bar close and keep the default message or customize.

ALMA & EMA Ribbon by zdmreThis indicator combines a unique trend-following signal with a classic EMA ribbon to provide a clear view of the market trend.
The main signal line is not based on a typical ATR. Instead, it uses an Arnaud Legoux Moving Average (ALMA) as its baseline and calculates support/resistance bands using Standard Deviation. This creates a responsive trend line that adapts well to volatility. This is paired with a simple EMA Ribbon to help confirm momentum.
What It Does
ALMA + SD Trend Line: This is the core of the indicator. It uses an ALMA as the baseline (instead of a simple MA) and Standard Deviation for the bands. This tends to be more responsive than many traditional trend-following indicators.
Buy/Sell Signals: Simple "B" and "S" labels appear on your chart when the trend is calculated to have changed direction.
EMA Ribbon: A standard Fast/Slow EMA ribbon is plotted to give you a secondary confirmation of momentum. The fill between the EMAs changes color (green for bull, red for bear).
On-Screen Dashboard: A clean info panel in the corner shows you the current status of all components at a glance:
Current Signal (Long/Short)
Price vs. Trend Line (Above/Below)
Trend Strength (%)
EMA Trend (Bullish/Bearish)
Momentum
Fully Customizable: You can toggle every visual element on or off (the signals, the ribbon, the bar coloring, the dashboard) to keep your chart clean.
Settings
Trend Settings:
Factor: This is the main setting. It's the Standard Deviation multiplier. A higher value makes the line less sensitive (fewer signals). A lower value makes it more sensitive (more signals).
SD Length: The lookback for the Standard Deviation.
ALMA Settings:
ALMA Length, Sigma, Offset: Standard controls for the ALMA's smoothness and responsiveness.
EMA Ribbon:
Fast EMA & Slow EMA: Set the lengths for your ribbon.
Visual Settings:
Checkboxes to toggle all visual components (signals, ribbon, dashboard, etc.).
You can set up alerts in TradingView for the following events:
🟢 Long Signal: Triggers on a new "B" (Buy) signal.
🔴 Short Signal: Triggers on a new "S" (Sell) signal.
⚠️ Price Crossed Trend: Triggers any time the price closes across the main trend line.
#DYOR

Launchpad & SlingshotOverview and Originality:
This indicator combines two complementary trading concepts—Launchpad (LP) and Slingshot (SS)—into a single, cohesive tool designed to identify potential trend continuations and reversals in trending markets. Launchpads provide context on overall trend alignment via stacked moving averages, acting as a filter for higher-probability setups, while Slingshot pinpoints precise entry timing during short-term pullbacks or bounces within those trends. This synergy reduces false signals by requiring both trend confirmation (LP) and momentum shift (SS), making it more robust than using either in isolation. Unlike simple merges, this script adds original enhancements such as a "curling" filter on the shortest Launchpad MA to ensure directional momentum, separate configurable MAs for bullish/bearish Slingshot thresholds, and combined LP/SS alerts for chained patterns (e.g., LP following SS). These improvements aim to enhance usability for trend-following strategies, particularly in volatile stocks or forex pairs, by providing visual labels, alerts, and multi-timeframe support without overcomplicating the core logic.
Underlying Concepts:
Launchpad (LP): Based on the idea of moving average "stacking," where shorter-period MAs align above longer ones in uptrends (bullish stack) or below in downtrends (bearish stack). This detects when price is in a strong, aligned trend phase, similar to how Guppy Multiple Moving Averages identify trend strength through ribbon compression/expansion. The script uses up to four customizable MAs (default: 8/21/50/200 EMAs of close), calculating the highest/lowest among included ones as the key crossover level. A signal triggers when the stack forms from a non-stacked state and price crosses the extreme MA, indicating potential trend acceleration.
Slingshot (SS): Draws from Scot1and's bullish pattern, which looks for price to remain below a 4-period EMA of highs for three consecutive bars (signaling a controlled pullback), then close above it (indicating rebound momentum). This script symmetrizes it for bearish cases using a separate 4-period EMA of lows, allowing detection of breakdowns after temporary bounces in downtrends. The separation of bull/bear sources is an original adaptation to better capture market structure asymmetry—highs for resistance in uptrends, lows for support in downtrends—reducing noise compared to a single-source approach.
The components work together by allowing users to spot "LP after SS" patterns: a Slingshot pullback/rebound followed by a Launchpad stack crossover, which often signals stronger continuations. This chained logic is grounded in momentum trading principles, where short-term mean reversion (SS) aligns with longer-term trend bias (LP) for improved risk-reward entries.
How It Works: The script calculates signals on each bar as follows:
Launchpad Calculations:
Build an array of included MAs (users can exclude any via inputs).
Check for stacking: For bull LP, shorter MAs > longer ones; for bear, shorter < longer.
Require a transition from non-stacked to stacked state.
Price must cross above the highest MA (bull) or below the lowest (bear).
Original filter: The shortest MA must be "curling" up (current > previous for bull) or down (current < previous for bear) to confirm recent momentum, preventing signals in counter-trend flattenings.
Slingshot Calculations:
Use separate MAs: Bull SS uses EMA of highs (default); Bear SS uses EMA of lows.
For bull SS: Close below bull MA for the prior N bars (default 3), then close above it.
For bear SS: Close above bear MA for prior N bars, then close below it.
No additional filters like volume or momentum jumps are applied, staying true to the pattern's simplicity.
Combined and Additional Signals:
"LP after SS": Triggers if LP occurs immediately after an SS, highlighting high-conviction setups.
Stack alerts: Pure stack with price above/below extremes, for trend monitoring.
All MAs can use multi-timeframe data via the timeframe input.
Alerts are set for each condition, and labels appear on the chart (configurable visibility, size, colors). Labels combine (e.g., "Bull LP & SS") if both trigger simultaneously.
How to Use It: Add the script to your chart via TradingView's indicator menu. Default settings suit daily/intraday charts for trending assets like stocks in bull markets (e.g., tech sector during rallies).
Interpretation:
Bull SS: Look for labels during uptrends; enter long on close above the blue Bull SS MA line after a 3-bar pullback. Use as a dip-buy signal.
Bear SS: In downtrends, enter short on close below the purple Bear SS MA after a 3-bar bounce.
Bull LP: Confirms trend strength; enter long on crossover if shortest MA is rising (green label).
Bear LP: Short entry on downside crossover with falling shortest MA (red label).
Prioritize "LP after SS" for layered confirmation—e.g., SS rebound leading into LP acceleration.
Monitor stack alerts for overall bias; avoid trading against the stack.
Customization:
Launchpad Group: Adjust lengths/sources/types; exclude MAs for simpler stacks (e.g., just 50/200 for long-term).
Slingshot Group: Change length (4 default), type (EMA), sources (high/low defaults), or preceding bars (3 default).
Display: Toggle labels, set timeframe (e.g., "D" for daily MAs on hourly chart), adjust offset for label positioning.
Test on historical data: Apply to strong trenders like AAPL or BTC; backtest entries with stops below recent lows.
For best results, combine with volume confirmation or broader market context—e.g., above 200-day MA for longs. This is not financial advice; always use risk management.

SA_EMA Combo + UT BotEMA Combo + UT Bot is an indicator designed to make it easier to track trend direction and momentum reversals on the same chart.
The indicator combines multiple EMA lines (50/100/150/200) with a short- and medium-term EMA cloud. This cloud visually shows whether the market is in a bullish or bearish trend through color changes.
In addition, it uses the UT Bot algorithm to generate buy and sell signals adapted to market volatility. These signals are triggered when the price crosses the ATR-based trailing stop level.
Users can choose to use Heikin Ashi candles and adjust signal sensitivity via the Key Value parameter. This allows traders to follow overall trends and potential reversal zones using a single tool.
Disclaimer: This indicator is for technical analysis purposes only and should not be considered financial advice.
Developed for Future Alpha Club.
Gildenburg ValueGildenburg Value
Purpose: Trend-strength indicator using three moving averages (fast/mid/slow) to identify Bull/Bear/Neutral zones and generate precise crossover signals.
Default parameters: fast = 8, mid = 13, slow = 21, MA type = EMA.
Zones:
Bull: fast > mid > slow
Bear: fast < mid < slow
Neutral: any other ordering
Signals:
BUY: fast crosses above mid, the post-crossing order is fast > mid > slow, and close > slow.
SELL: fast crosses below mid, the post-crossing order is fast < mid < slow, and close < slow.
Optional filter: minimum percentage gap between fast and mid to ignore weak crosses.
Visualization: three MAs on the chart, optional cloud between fast and mid colored by zone, signal arrows/labels, and alertconditions.
Adjustable settings: MA type (SMA/EMA/WMA/VWMA), MA periods, cloud on/off, show signals, minimum distance threshold.
Use to confirm trends and filter false entries.

EMA21The indicator includes 5x the EMA, which can be freely selected. The default settings are 5 min, 10 min, 15 min, 1 h, and 4 h. If a candle crosses an EMA, the wick of the candle is longer than that of the EMA, and if the candle body is above the EMA, it indicates a buy or sell accordingly.

TradeBee Vol-Pr SentimentThis indicator analyzes volume-weighted price sentiment and short-term scalp potential. It calculates buying vs. selling pressure based on intrabar price positioning and overlays a sentiment label ("Buy", "Sell", or "WAIT") depending on price behavior relative to a moving average. Additionally, it detects scalp setups using percent movement, slope, and volume acceleration — ideal for short-term momentum traders.
The sentiment and scalp signals are displayed in a floating table on the chart, with customizable position and label size.
- Vol-Price Sentiment:
"Buy" → Price above MA and buying pressure dominant
"Sell" → Price below MA and selling pressure dominant
"WAIT" → No clear bias
- Scalp Signal:
"Long Scalp" → Strong upward move with slope and volume confirmation
"Short Scalp" → Strong downward move with slope and volume confirmation
"No Setup" → No qualifying scalp conditions
Its optimal to have Wait/Buy and Long Scalp showing when entering a trade.

Goldencrossover - ema 5 over 13&26Goldencrossover - ema 5 over ema13& ema26 over the same candle.
Both up and down. If there is any such crossover during the same candle, then the indicator will highlight.

Phase Coherence Index (PCI) — Hilbert Prototype v0.1Phase Coherence Index (PCI) — Hilbert Prototype v0.1
✨ Concept:
The Phase Coherence Index (PCI) measures the degree of phase alignment among multiple trend components derived from band-filtered price signals.
In simpler terms, PCI quantifies how “in-sync” short, mid, and long-term market oscillations are.
A high PCI (values near 100) means the market’s cyclical components are moving together — a state of phase alignment that typically accompanies sustained, directional trends.
A low PCI (values near 0) indicates phase disorder or divergence between timeframes — often seen during transitions, chop, or volatility compression phases.
✨ How it works:
1. Multi-Band Extraction
The price series is decomposed into three frequency bands using a simple EMA-difference
bandpass filter:
Short-term band
Mid-term band
Long-term band
2. Hilbert Quadrature Approximation
For each band, a Hilbert-style quadrature signal (Q) is estimated using an Ehlers-inspired FIR kernel with coefficients h0=0.0962 and h1=0.5769.
The original bandpass (I) and its quadrature (Q) form a complex phasor that carries instantaneous phase information.
3. Phase Extraction
The arctangent of Q/I gives the phase angle (−π to π).
Each band’s phase represents the “timing” of its oscillation relative to price movement.
4. Coherence Calculation
All three band phases are converted to unit phasors (cos φ, sin φ).
The average of these phasors is taken, and the magnitude of the resulting vector defines the PCI value:
PCI = |mean_phasor| × 100
PCI = 100 → perfect phase alignment
PCI = 0 → complete phase randomness
5. Smoothing and Regime Coloring
The raw PCI is lightly smoothed by EMA to stabilize readings.
A simple SuperTrend regime filter (ATR length 5, factor 6) colors the PCI line:
Green: uptrend regime
Red: downtrend regime
Gray: low-coherence or neutral zone
✨ How to interpret PCI
High PCI (≥70):
Indicates strong phase coherence — multi-timeframe alignment, stable directional energy.
Often coincides with trend persistence or mature momentum phases.
Low PCI (≤30):
Suggests phase dispersion or regime transition — signals are desynchronized across bands.
Common near reversals, volatility compressions, or sideways congestion.
Cross-phase Transitions:
Rapid drops in PCI often precede periods of uncertainty or trend fatigue.
Rising PCI after a contraction suggests emerging order or trend formation.
✨ Visualization
PCI Line:
Displays phase coherence magnitude (0–100).
Color changes dynamically with SuperTrend regime.
Dotted Reference Levels:
70 (high coherence), 30 (low coherence), 50 (midline).
Optional Label:
When PCI is high, a text label appears indicating whether the average phase bias leans bullish or bearish.
✨ Practical Use
Combine PCI with momentum or volatility tools (e.g., RSI, ATR, DFI) to detect when multiple timeframes become synchronized.
Use PCI drops (<30) as early warnings for possible trend exhaustion or market disorder.
Use PCI rises (>70) as confirmation of trend continuation or emerging coherence.
✨ Limitations
PCI measures phase alignment, not directional bias. It should be combined with a directional filter (e.g., SuperTrend, slope, or moving average).
The Hilbert approximation is not a true analytic signal, but a real-time proxy optimized for stability.
PCI is best interpreted as a structural context indicator rather than a direct entry signal.
✨ Educational intent
This script is designed for quantitative study and visualization of phase alignment, not for direct trading advice.
It demonstrates how Hilbert-style phasors and vector averaging can reveal coherence across timescales — a foundational concept for spectral, cyclical, and structural analysis.
✨ Disclaimer
This script is provided for educational purposes only.
It does not constitute financial advice.
Trading involves risk; use at your own discretion.
© 2025 Trading Playground Labs — “Phase Coherence Index (Hilbert Prototype v0.1)
───────────────────────────────
📘 한국어 설명 (Korean translation below)
───────────────────────────────
Phase Coherence Index (PCI) — Hilbert Prototype v0.1 (한국어 설명)
✨ 개념
Phase Coherence Index (PCI) 는 여러 주기의 추세 구성 요소들 간에 위상의 정합 정도를 측정하는 지표입니다.
쉽게 말하면, 시장의 단기·중기·장기 진동(사이클)들이 서로 얼마나 “같은 박자”로 움직이는지를 수치화한 것입니다.
PCI 값이 100에 가까울수록 시장의 주기적 구성 요소들이 함께 움직이고 있다는 뜻이며,
이는 일반적으로 지속적인 방향성 추세(trend persistence) 상태를 의미합니다.
반대로 PCI 값이 0에 가까울수록 각 주기의 움직임이 서로 엇박자 상태로 흐르며,
이는 전환기(chop), 혼돈(chaos), 혹은 압축(squeeze) 상태를 반영합니다.
✨ 작동 원리
1. 다중 밴드 추출
가격 데이터를 3개의 주파수 대역으로 분리합니다.
단기 (short-term band)
중기 (mid-term band)
장기 (long-term band)
각 대역은 빠른 EMA와 느린 EMA의 차이(EMA difference)로 얻은 단순한 밴드패스로 계산됩니다.
2. Hilbert 직교 성분 근사
각 밴드에 대해 Ehlers 계열 FIR 필터를 이용한 Hilbert 근사 신호(Q)를 계산합니다.
원본 밴드패스 신호(I)와 Q를 결합하면 복소 위상(phasor) 를 구성할 수 있고,
이를 통해 각 대역의 순간 위상(instantaneous phase) 을 추정합니다.
3. 위상 계산
Q/I의 아크탄젠트 값을 구하면 위상각 φ(−π ~ π)가 도출됩니다.
이 위상은 해당 주기의 진동 타이밍을 나타냅니다.
4. 위상 정합(Phase Coherence) 계산
각 밴드의 위상을 단위 페이저 벡터 (cos φ, sin φ)로 변환합니다.
세 벡터의 평균을 구하고, 그 평균 벡터의 크기를 0~100 스케일로 변환한 값이 PCI입니다.
PCI = |평균 페이저| × 100
PCI = 100 → 완전한 위상 일치
PCI = 0 → 완전한 위상 무질서
5. 스무딩 및 추세 컬러링
계산된 PCI는 EMA로 약간 평활화되어 안정적으로 표시됩니다.
또한, SuperTrend 레짐 필터(ATR=5, Factor=6) 로 추세 방향에 따라 색이 바뀝니다:
초록색: 상승 추세
빨간색: 하락 추세
회색: 저정합 / 중립 구간
✨ 해석 방법
PCI ≥ 70 (높은 정합)
여러 타임프레임이 같은 방향으로 동기화되어 있는 상태입니다.
이는 추세 지속성, 모멘텀 유지, 구조적 안정 상태를 의미합니다.
PCI ≤ 30 (낮은 정합)
각 주기 간 위상 불일치가 심해지며, 시장이 방향을 잃거나 변곡점에 근접한 상황입니다.
보통 조정기, 변동성 축소, 횡보 국면에서 자주 나타납니다.
급격한 변동 (Phase Transition)
PCI가 급격히 하락하는 구간은 추세 피로(trend fatigue) 또는 혼돈 국면 진입의 신호일 수 있으며,
이후 PCI가 상승하기 시작하면 새로운 질서(추세 형성) 가 시작될 가능성을 의미합니다.
✨ 시각화 구성
PCI 라인:
위상 정합도의 크기(0~100)를 표시합니다.
SuperTrend 방향에 따라 색이 동적으로 변합니다.
점선 기준선:
70(높은 정합), 50(중간), 30(낮은 정합) 기준으로 시각화됩니다.
평균 위상 라벨:
PCI가 높을 때, 평균 위상의 방향이 상승(bullish) 인지 하락(bearish) 인지를 라벨로 표시합니다.
✨ 활용 방법
RSI, ATR, DFI 등 다른 모멘텀/변동성 지표와 함께 사용하면, 복수 타임프레임 동기화 구간을 탐지할 수 있습니다.
PCI 하락(30 이하)은 추세 피로 또는 혼돈 진입의 신호로, PCI 상승(70 이상)은 질서 회복 또는 추세 지속의 신호로 해석할 수 있습니다.
추세 전환, 조정, 또는 모멘텀 재편성 구간을 감지하는 데 유용합니다.
✨ 한계점
PCI는 방향성(Direction)을 직접 측정하지 않고, 구조적 정합(Alignment) 만 측정합니다. 따라서 반드시 방향 필터(SuperTrend, MA 기울기 등)와 함께 해석해야 합니다.
Hilbert 근사는 완전한 복소 해석 신호가 아니라, 실시간 안정성을 중시한 근사 모델입니다.
PCI는 진입 시그널용보다는 시장 구조 인식용 보조 지표로 적합합니다.
✨ 교육적 목적
이 스크립트는 위상 정합(phase coherence) 개념의 시각화와 정량적 연구를 위한 목적으로 설계되었습니다.
힐버트 변환 기반 위상 벡터(phasor) 와 벡터 평균화(vector averaging) 의 개념을 통해
시장의 다중 시간 구조 간 일관성(coherence)을 탐색할 수 있습니다.
✨면책
이 지표는 교육 목적으로만 제공됩니다.
투자 조언이 아니며, 모든 트레이딩 결정의 책임은 사용자에게 있습니다.
© 2025 Trading Playground Labs — Phase Coherence Index (Hilbert Prototype v0.1)
Developed for structural & spectral analysis of market phase alignment.

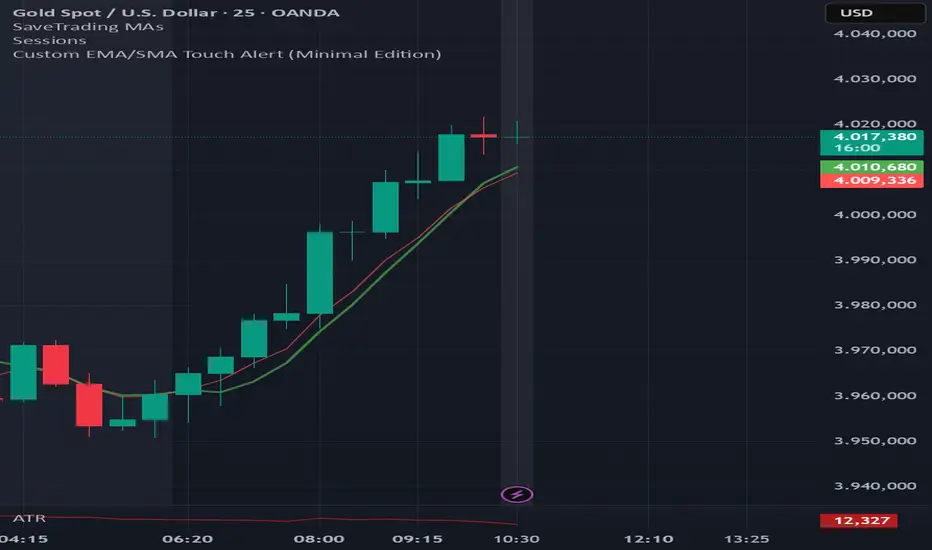
EMA6 or SMA6 Touch AlertThis script monitors the market and notifies you whenever the price touches either the 6-period EMA or the 6-period SMA.
It helps identify potential pullbacks, reaction points, or entry zones, as price interaction with these moving averages often signals short-term market shifts.
What the script does:
Calculates the EMA 6 and SMA 6
Detects if price touches either moving average within the candle
Plots both lines on the chart for visibility
Allows you to set alerts to receive automatic notifications
Best suited for:
Scalping
Day Trading
Pullback Entries
Short-term trend reactions
(15M) Gold Daily Signal — Invite OnlyQuick Start
Symbol XAUUSD, timeframe 15m.
Defaults: TP 50 pips, SL 150 pips.
Wait for green (long) or red (short) background after bar close.
Place orders at the plotted Entry / TP / SL; optional scale-ins at E1/E2.
Max signals kept on chart – housekeeping only (limits old drawings).
Alerts
Turn Green → ready-to-buy signal.
Turn Red → ready-to-sell signal.
Create alerts once per bar close and keep the default message or customize.

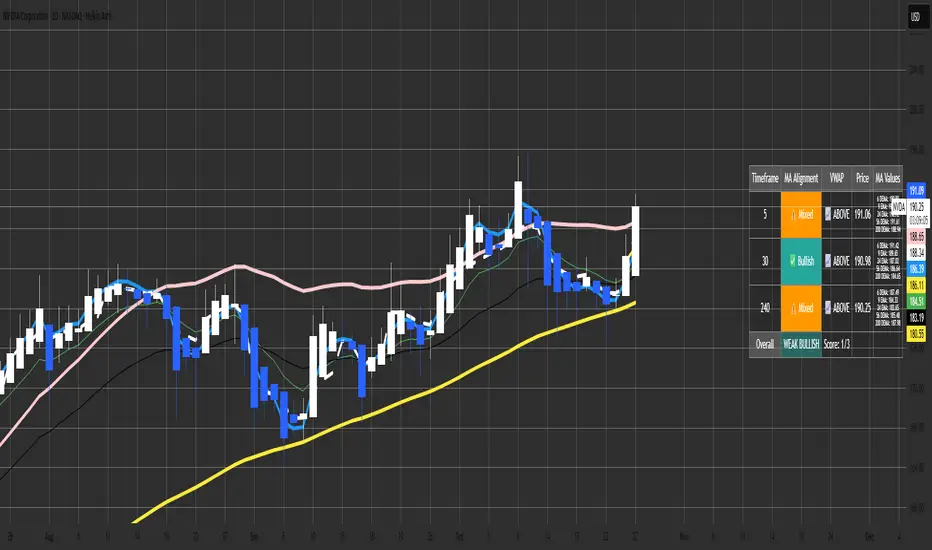
Malama's MTF MA Alignment ScannerMalama's Multi-Timeframe Moving Average Alignment Scanner (MTF MA Scanner) is an overlay indicator designed to simplify trend analysis by evaluating the alignment of multiple moving averages (MAs) across user-defined timeframes. It scans for bullish (MAs stacked ascending), bearish (descending), or mixed/neutral configurations, incorporating a VWAP (Volume Weighted Average Price) filter to contextualize price position relative to volume-based equilibrium. The result is a compact dashboard table summarizing signals from up to three timeframes, helping traders spot confluence for entries or reversals without manually switching charts. This tool draws from classic MA ribbon concepts but adds flexible MA types, dynamic sorting, and an overall trend score for quicker multi-TF insights.
Core Mechanics
The indicator processes data in layers to detect alignment and bias:
Moving Average Calculation: Supports five customizable MAs per timeframe, with types including Simple (SMA), Exponential (EMA), Double Exponential (DEMA for reduced lag), Smoothed (SMMA), or Butterworth 2-Pole filter (a low-lag recursive smoother approximating Ehlers' design for cleaner signals). Defaults use EMAs at lengths 6, 9, 21, 56, and 200—shorter for fast trends, longer for structure. Users enable/disable each independently.
Alignment Detection: For enabled MAs, it dynamically sorts them by length (shortest first) and checks their relative order: All ascending (shortest MA > longest) signals "Bullish" (uptrend strength); all descending signals "Bearish" (downtrend); otherwise "Mixed" or "Neutral" (if <2 MAs). This avoids bias from unsorted plots.
VWAP Integration: Computes session-anchored VWAP (daily/weekly/monthly) as a volume-weighted mean, classifying price as "Above" (bullish bias) or "Below" (bearish) to filter alignments—e.g., bullish MA stack above VWAP strengthens longs.
Multi-Timeframe Aggregation: Pulls MA and VWAP data from up to three timeframes (e.g., current, 5m, 15m) using secure requests without lookahead bias. It consolidates into a table: Per-TF rows show alignment status (with icons: ✅ Bullish, ❌ Bearish, ⚠️ Mixed, ➖ Neutral), VWAP icon/status (📈 Above, 📉 Below), current price, and optional MA values (e.g., "9 EMA: 1.2345").
Overall Summary: Counts bullish/bearish TFs for a net score (e.g., 2/3 bullish = "Weak Bullish"), highlighting confluence in the final row.
This setup emphasizes regime detection: Aligned short-term MAs confirm momentum, while longer ones validate structure, all filtered by VWAP for volume context.
Why This Adds Value & Originality
Standard MA crossovers or ribbons often clutter charts or require manual TF switches, leading to analysis fatigue. Here, the mashup of diverse MA types (e.g., lag-reduced DEMA with smooth Butterworth) into a sortable alignment check creates a "trend thermometer" that's adaptable—e.g., EMAs for responsiveness in forex, SMAs for stocks. The VWAP layer adds a fair-value anchor absent in pure MA tools, while the dashboard condenses MTF data into one glanceable view with a net score, reducing cognitive load. It's not a simple merge: Dynamic UDT-based sorting ensures consistent evaluation regardless of user tweaks, and optional value display aids precise level targeting. This makes it uniquely practical for confluence trading, evolving basic alignment into a scannable system without repainting risks.
How to Use
Setup: Add to your chart (overlay=true). In inputs: Enable TFs (e.g., 1H for structure, 15m/5m for entries); customize MAs (e.g., switch to DEMA for volatile crypto); set VWAP anchor (Daily for intraday). Toggle table position/size and chart plots.
Interpret the Dashboard (top-right default):
Per-TF Rows: Green cells for Bullish (long bias); red for Bearish (short); orange for Mixed (caution); gray for Neutral/low data. Check VWAP for confirmation—e.g., Bullish + Above = strong buy setup.
MA Values Column (if enabled): Lists current levels (e.g., "21 EMA: 4500.50") for support/resistance pulls.
Overall Row: "Strong Bullish" (all green) for aggressive longs; "Weak" variants for scaled entries. Score like "2/3" shows TF agreement.
Trading Application: On a 1H chart, look for 3/3 Bullish with price above VWAP for longs—enter on pullback to shortest MA. Use alerts (e.g., "All Timeframes Bullish") for notifications. Best on liquid assets (e.g., EURUSD, SPX) across 15m-4H. Combine with price action for edges.
Customization Tips: Disable unused MAs to declutter; test Butterworth on noisy data for smoother aligns.
Limitations & Disclaimer
Alignments lag by MA lengths and TF resolutions, so they're directional filters—not precise entries (pair with candlesticks). VWAP resets on anchors, potentially skewing mid-session. In sideways markets, "Mixed" dominates—avoid forcing trades. No built-in risk management; backtest on your symbols (e.g., via Strategy Tester) to validate. Results use historical data without guarantees—markets evolve. Not financial advice; trade at your own risk. For feedback, comment publicly.1.1s
Better DEMAThe Better DEMA is a new tool designed to recreate the classical moving average DEMA, into a smoother, more reliable tool. Combining many methodologies, this script offers users a unique insight into market behavior.
How does it work?
First, to get a smoother signal, we need to calculate the Gaussian filter. A Gaussian filter is a smoothing filter that reduces noise and detail by averaging data with weights following a Gaussian (bell-shaped) curve.
Now that we have the source, we will calculate the following:
n2 = n/2 (half of the user defined length)
a = 2/(1+n)
ns
Now that we have that out of the way, it is time to get into the core.
Now we calculate 2 EMAs:
slow EMA => EMA over n
fast EMA => EMA over n2 period
Rather then now doing this:
DEMA = fast EMA * 2 - slow EMA
I found this to be better:
DEMA = slow EMA * (1-a) + fast EMA * a
As a last touch I took a little something from the HMA, and used a EMA with period of √n to smooth the entire the thing.
The Trend condition at base is the following (but feel free to FAFO with it):
Long = dema > dema yesterday and dema < src
Short = dema < dema yesterday and dema > src
Methodology
While the DEMA is an amazing tool used in many great indicators, it can be far too noisy.
This made me test out many filters, out of which the Gaussian performed best.
Then I tried out the non subtractive approach and that worked too, as it made it smoother.
Compacting on all I learned and smoothing it bit by bit, I think I can say this is worth looking into :).
Use cases:
Following Trends => classic, effective :)
Smoothing sources for other indicators => if done well enough, could be useful :)
Easy trend visualization => Added extra options for that.
Strategy development => Yes
Another good thing is it does not a high lookback period, so it should be better and less overfit.
That is all for today Gs,
Have fun and enjoy!

Adaptive Trend OscillatorAdaptive Trend Oscillator (ATO) — Publishing Description and User Guide
Purpose
The Adaptive Trend Oscillator (ATO) is a research and decision‑support indicator designed to help traders assess momentum, trend stability, and changing volatility conditions within a single, unified panel. It provides a configurable signal line, optional confidence bands, adaptive zones, and contextual Bollinger Band cues. ATO is intended for educational and analytical use on TradingView charts and does not execute trades or make investment recommendations.
Methodology (High‑Level Overview)
ATO integrates several well‑known concepts into a cohesive framework while avoiding proprietary implementation details:
- Core Oscillator: A smoothed momentum line derived from standard price‑based calculations (e.g., RSI) with confidence‑aware coloring to reflect relative stability and recent behavior.
- Signal Candle Visualization: A Heikin‑Ashi style signal candle, computed from the oscillator series, helps users visually interpret direction, strength, and transitions. Smoothing controls reduce jitter in the open component to improve readability.
- Volatility Regime Detection: Rolling dispersion and average comparisons classify conditions into Low/Medium/High volatility regimes. This regime context informs confidence scoring and adaptive visualization.
- Adaptive Zones: Overbought/Oversold zones adjust to market conditions using observed distribution and lookback windows, offering dynamic boundaries that can better reflect regime changes compared with fixed thresholds.
- Bollinger Context: Bands applied to the oscillator series provide cues about contraction (squeeze), expansion (divergence), and convergence. Optional fills highlight changing states while remaining purely informational.
- Confidence Bands: Optional envelopes around the oscillator estimate uncertainty ranges derived from recent behavior and regime context. These bands are visual aids, not predictions.
- Performance Mode: An optional toggle that simplifies visuals (thinner lines, reduced fills, disabling inner layers) to improve responsiveness on devices or layouts where rendering cost matters. Calculations remain unchanged.
Inputs and Configuration (Summary)
ATO organizes settings for clarity and quick start:
- Quick Start & Display Toggles: Show/hide key elements such as adaptive zones, confidence bands, and Bollinger fills; enable Performance Mode for faster rendering.
- Core Signal Tuning: Adjust smoothing for the signal candle open, choose theme, and set lookback parameters used in the underlying oscillator and contextual measures.
- Visualization Layers: Confidence bands, inner/outer envelopes, and color themes can be enabled or disabled as needed.
Intended Use and Application
- ATO is most effective as a complementary tool. Use it alongside price action, volume, risk management rules, and broader market context.
- Signals should be validated with multiple factors (support/resistance, higher‑timeframe bias, and instrument characteristics). Parameter tuning is recommended for different assets and timeframes.
- The indicator does not generate trade orders. Any buy/sell interpretations are at the user’s discretion and should be independently evaluated.
Limitations and Risks
- No Guarantees: The indicator cannot predict future prices. Visual cues reflect historical and current data only.
- Lag and Whipsaws: Smoothing improves stability but introduces lag. During range‑bound or choppy conditions, oscillators may experience false starts or rapid flips.
- Data Quality and Availability: Calculations rely on TradingView‑provided data, which may include delays or revisions depending on the data source and subscription.
- User Configuration: Improper or aggressive settings may reduce effectiveness. Always backtest and forward‑test configurations before use.
Required Disclosures and Regulatory Statements
- Educational Use Only: ATO is provided for informational and educational purposes. It does not constitute investment advice, solicitation, or a recommendation to buy or sell any security or derivative.
- No Advisor Relationship: The publisher is not acting as a broker, dealer, investment advisor, or fiduciary. Users are solely responsible for decisions made using the indicator.
- Past Performance: Past performance, whether shown in charts or inferred from historical signals, does not guarantee future results.
- Risk of Loss: Trading and investing involve substantial risk. You can lose more than your initial capital. Consider your financial situation, risk tolerance, and seek advice from a qualified, licensed professional where appropriate.
- Jurisdictional Compliance: Users must comply with all applicable laws and regulations in their jurisdiction and with TradingView’s Terms of Use and House Rules.
Attribution and Code Notes
- ATO relies on standard Pine Script constructs and common analytical concepts (e.g., RSI, Bollinger Band‑style dispersion, Heikin‑Ashi visualization). No external data sources are accessed.
- Calculations and visual layers are original work tailored for research utility. Specific implementation details are intentionally summarized to respect intellectual property and maintain clarity.
Publishing‑Friendly Content Guidelines
- No exaggerated claims, guarantees, or sensational language are used. Descriptions focus on functionality, method, and limitations.
- The indicator is positioned as a tool for research and decision support, not as a promise of profit or certainty.
Getting Started (Suggested Workflow)
1) Add ATO to your chart and choose a theme suitable for your background (Light/Dark).
2) Enable/disable visualization layers (Adaptive Zones, Confidence Bands, Bollinger Fill) to match your preference.
3) Adjust signal smoothing and lookback parameters to fit your instrument and timeframe; conservative settings generally produce steadier signals.
4) Optional: Turn on Performance Mode if you use multiple panels or need faster UI responsiveness; this simplifies visuals while preserving calculations.
5) Validate signals with price structure, volume context, and higher‑timeframe bias before making any decision.
Support and Contact
- For questions or feedback, please use TradingView direct messages to the publisher’s account: .
- Personal financial advice is not provided. Support is limited to general usage guidance and technical questions about the indicator.
Final Reminder
ATO is a tool for analysis, not a guarantee of outcomes. Always manage risk, perform independent research, and remember that past performance does not guarantee future results.
