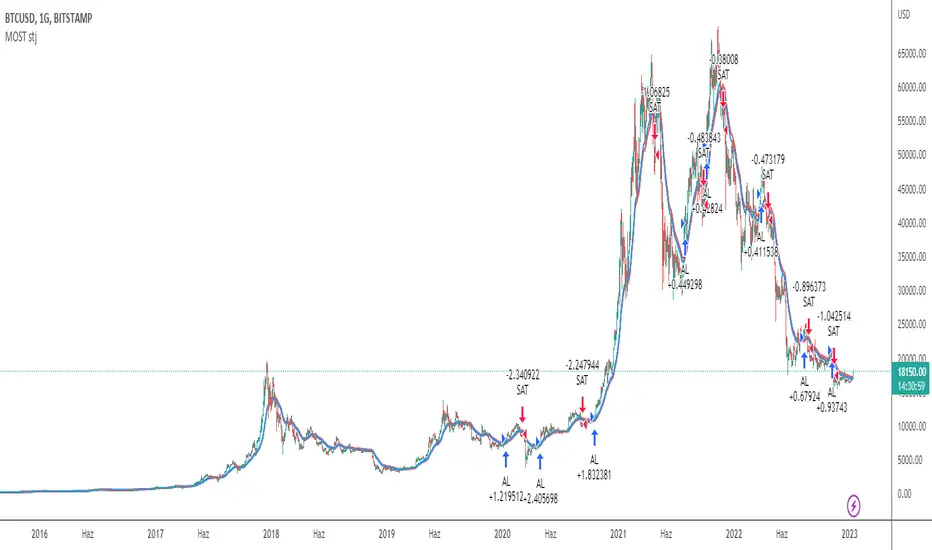
ElanStrategy v2.0A trend-following strategy with a twist.
I worked on the premise that Bitcoin price swings can not be predicted properly, since it's such a heavily manipulated market. Therefore, I chose to work with following the trend instead of predicting reversals.
It uses a weighted average of short, medium, and long range MA's.
This is the second version (see link below for v1.0), The main difference is that this new version uses a less binary position - it will change the position more gradually.
This one will automatically correct for bar duration, and works well from 1 to 4 hour charts. (1 hour chart seems to have data going back to only 2018/01/01 at the moment of writing, so I recommend using the 2H chart or higher)
Previous version:
ממוצע נע אקספוננציאלי (EMA)


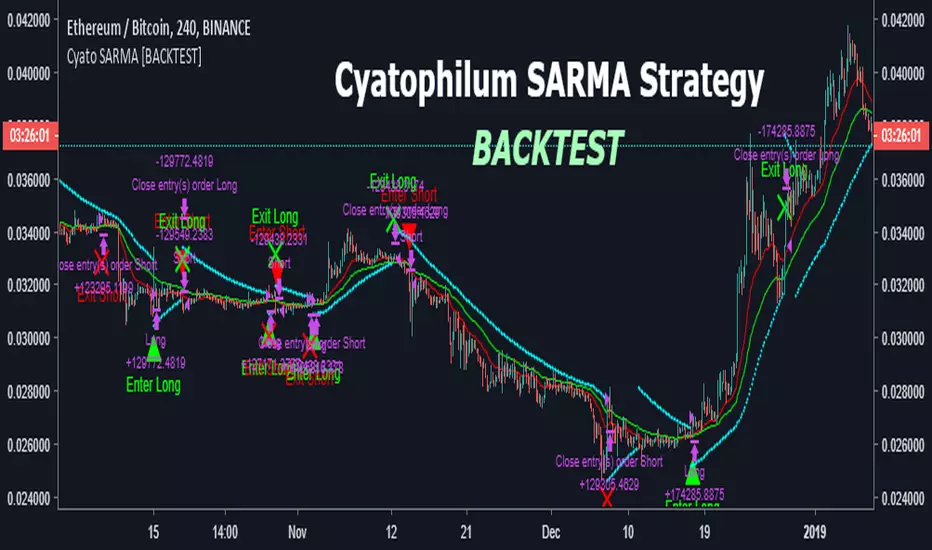
Cyatophilum SAR-MA Strategy [BACKTEST]An Automated Strategy based on Parabolic SAR and EMAs. Works on any timeframe and market.
Backtest is done using the largest period TradingView has to offer for 1H. Net profit is calculated using the Strategy Tester, with only long entries at Green triangles and exits at red triangles. Profit can be greater if you short Sell signals (red triangles). Commission used is 0.05%.
This strategy is going to be on my website later because it was commissioned by a customer and I had to publish it quickly. You can get access if you purchase the Cyatophilum Indicators. blockchainfiesta.com
I will publish an Alert Setup version soon.
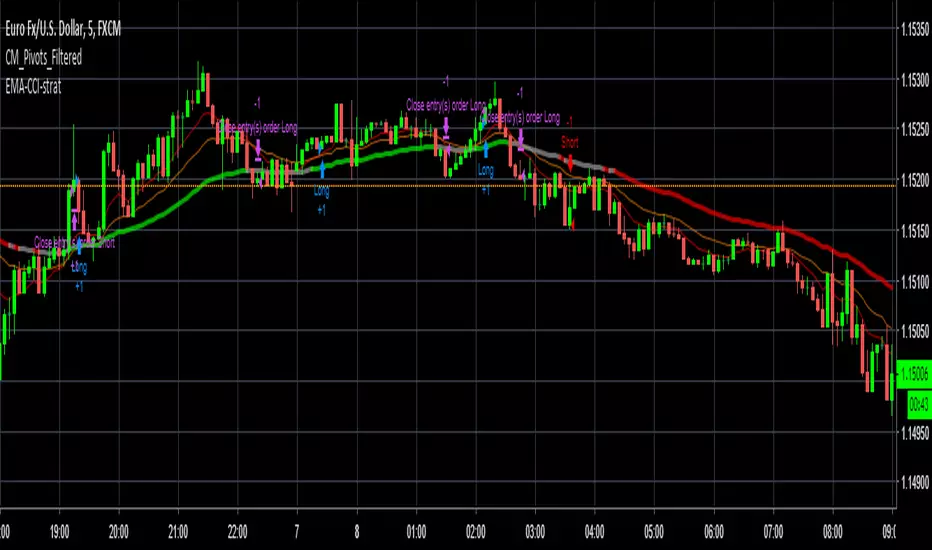
[Strategy] CCI EMA scalping [DEV]Recommended timeframe: 5M or higher
Based on EMA crosses and CCI levels.
Take profit can be also at Pivot levels like Daily/Weekly
Stop loss should be between 12-15 pips.
This strategy is still under development!

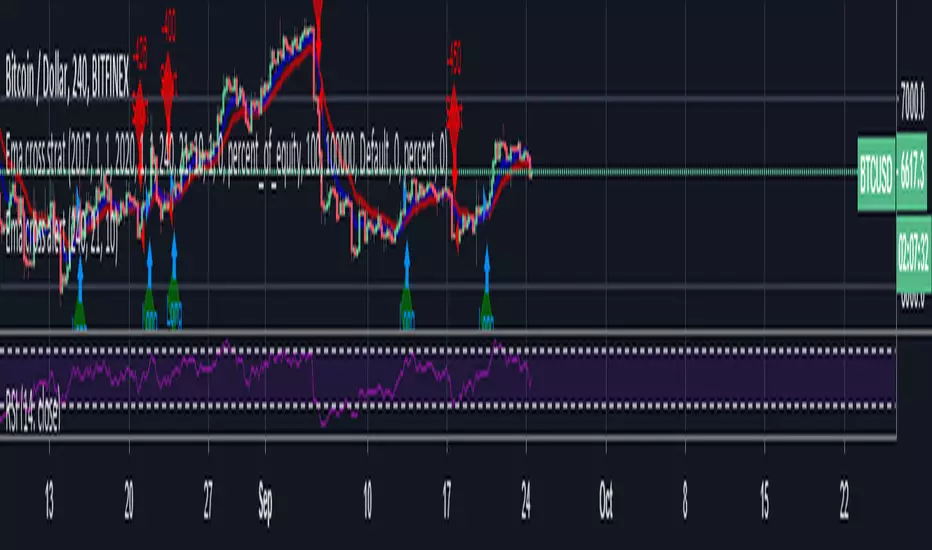
Ema cross strat / Turtle Trading This is just a simple EMA cross strategy which is meant to be similar to Turtle Trading Strategy.
It uses in default 4 Hour 21 / 10 EMA to long or short. This is not perfect but in the long run it will profit. Works best in bull market.
LINK TO ALERT :
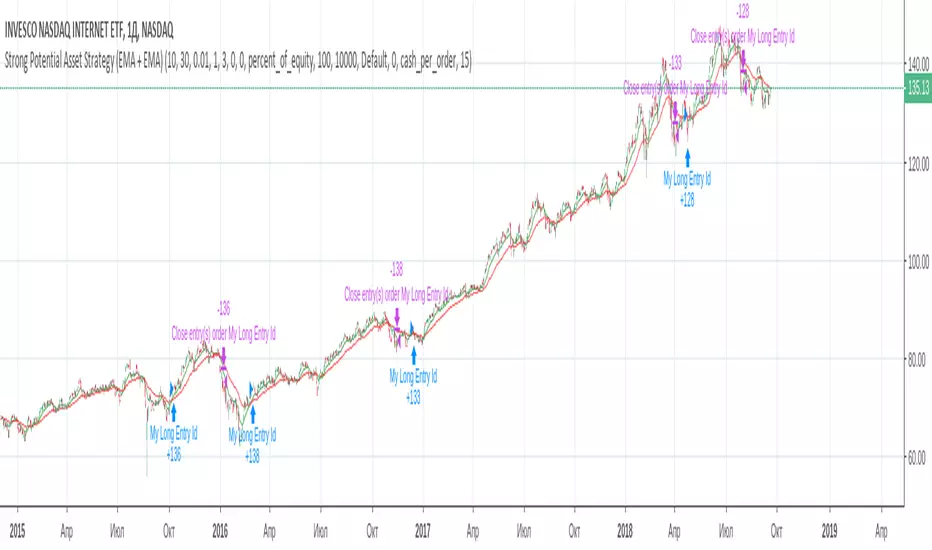
Strong Potential Asset Strategy (EMA + EMA)During experiments with the market, I found out that simple strategy is the best solution. However, I decided to bring some of my ideas on the 2 MA strategy.
- Instead of SMA - there will be 2 EMA, so the strategy will be more sensitive to the latest data;
- There is an option, which regulates the difference between those 2 EMAs, this should protect us from false trend enter;
- There is an option "Exit tolerance", which regulates how much could be the difference between 2 EMAs after crossover. This supposed to protect us from the false trend exit.
Hope this will be helpful :)

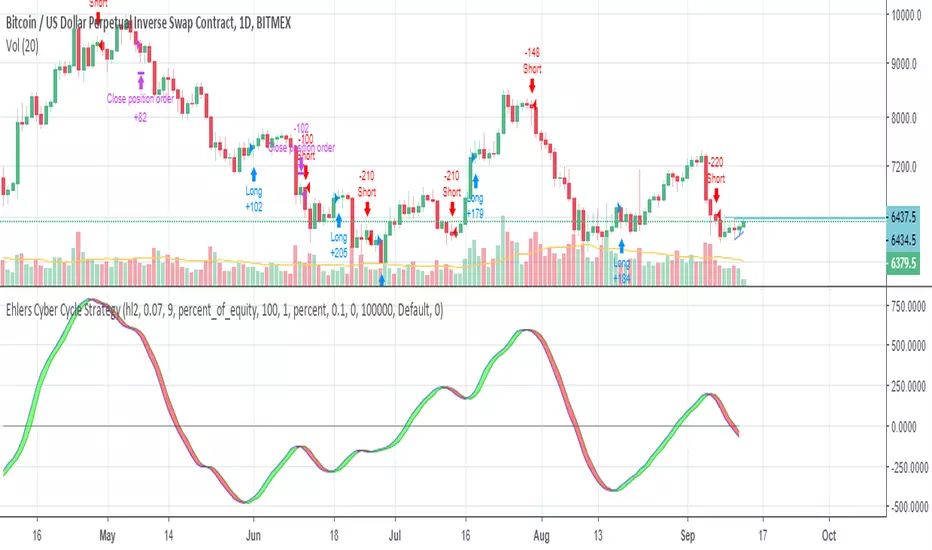
Ehlers Cyber Cycle StrategyEhlers Cyber Cycle Strategy by John Ehlers from his book "Cybernetic Analysis for Stocks and Futures".

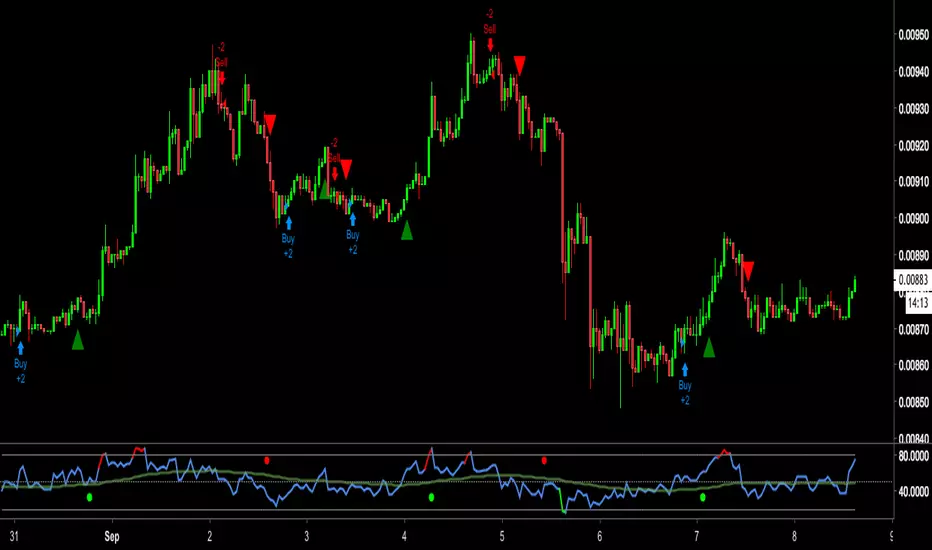
Coinsolos Wonderfull Strategy 1h ChartSet your chart 1h resolution and follow the signs. 94% profitable trade for 275 trades between 01.01.2018 and 11.09.2018


WW buy/sellGreen and Red Triangles tell the overall trend
buy/sell are pretty obvious, what they do
the way i use it is:
long (buy) 50% of your position size when we have buy and then long (buy) another 50% when i get the green triangle
short (sell) 50% of your position size when we have sell and then short (sell) another 50% when i get the red triangle
also, i look at my RSI indicator to confirm the entry and exits
RSI is above green line and indicator says buy, it's a safe long
RSI is below green line and indicator says sell, it's a safe short
won't be able to describe much as the more you use it, more you get used to it
cheers!


[STRATEGY]EMA 30/60 Cross Strategystrategy based on EMA 30/60 cross
works best on 4hr timeframes & high-midcaps

BTCUSD - 4H - Cyatophilum Golden X - RSI [BACKTEST]This indicator is a custom combo of Ema crosses, RSI divergences and Support/resistance , engineered to make the most profit possible.
ABOUT THE STRATEGY
The Net Profit (Gross profit - Gross loss) is calculated with a commission of 0.05% on each order.
Each trade is made with 1 BTC : The backtest buys 1 BTC and sells 1 BTC.
If you decided to Short or Long, profits can be higher, but trade at your own risk.
To use this strategy on a ALT/BTC market (for trading altcoins), change the default Order Size from 1 Contract to 100% of Equity.
There are two kind of buy signals : Green and Blue triangles, that are two great Buy/Long entries.
There are also two kind of sell signals: Red and Orange triangles, that are two great Sell/Short entries.
The indicator comes with automatic Alerts that trigger on Green and Blue triangles for a Buy Alert, or that trigger on Red and Orange triangles for a Sell Alert.
If you are interested in purchasing the indicator and want to try it, then please leave a comment.
An alert setup indicator version is available on my profile.
-----------------------------------------------------------------------------------------
I am also available for PineScript Development and Reverse Engineering.
Join my discord:
discord.gg

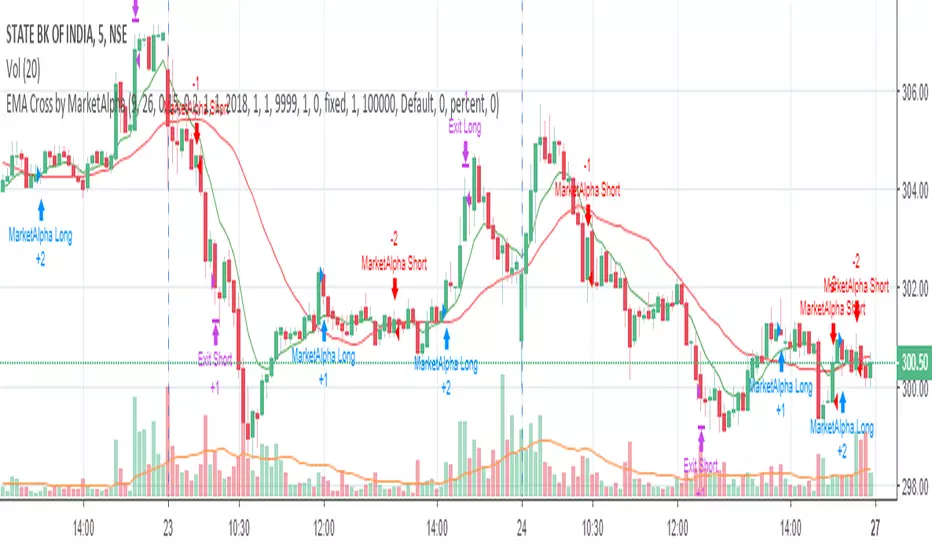
EMA Cross by MarketAlphaSignals are generated when EMA(FastLength) and EMA(SlowLength) cross each other.
Below are the additional user parameters:
1. User defined backtesting period
2. User defined Target and StopLoss percentage points

3-forcesThis strategy has three components.
Philakones EMAs are a sequence of five fibonacci EMAs. They range from 55 candles (green) to 8 candles (red) in length. A strong trend or breakout is marked by the emas appearing in sequence of their length from 8 to 55 or vice versa.
These EMAs are also used to signal an exit. Only two EMAs are used for exit signals - when the 13 EMA crosses over/under the 55 EMA .
RSI gives a bullish signal when 40 > rsi > 70. Exit signals are oversold (30) or overbought (70)
Stochastics give a bullish signal when stoch < 80 and an exit signal when > 95.
Results include 3 ticks of slippage and taker fees of .002. Provides a pretty smooth equity curve with a 73% win rate and beats buy and hold by than 10x (returns about 60x overall) since start of 2017.
