ממוצע נע אקספוננציאלי (EMA)

Gunbot Deluxe TunersThis script combines all of the other Gunbot tuners along with Okkie's mode into a complete all in one simulation of Gunbot with the ability to mix and match buy and sell strategies of any combination.
No public requests or donations for access to this script will be granted. Anyone interested in obtaining this script must contact me privately either here or preferably through Telegram. No exceptions.
NOTICE: By requesting access to this script you acknowledge that you have read and understood that this is for research purposes only and I am not responsible for any financial losses you may incur by using this script!

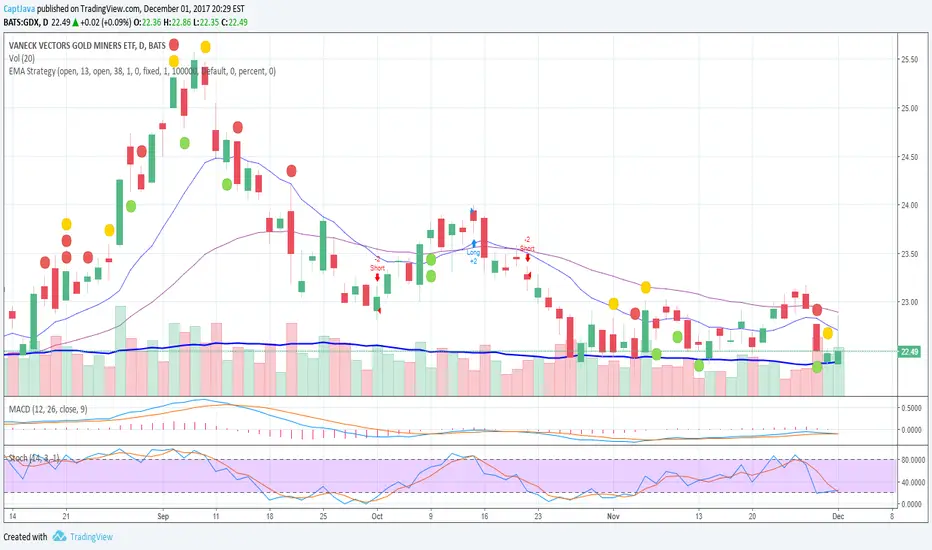
EMA StrategyThis strategy is in testing and development.
**USE AT YOUR OWN RISK. **
This defaults to a 13/48 EMA using the closing price. When the fast EMA crosses above the slow it triggers a buy. When it crosses below the slow EMA it triggers a sell and potentially a short, but that is not implemented. Stops, trailing stops, and pyramiding to be added. The purpose of this strategy is to signal recommended entry and exit point and back test whether the strategy works. It is not intended to be an automated buy/sell script.
* stop loss added. Not yet configurable from the settings panel. Defaults to 8% from the entry price.
TODO:
Add the ability to configure the stop-loss level in the settings panel
Add trailing stop functionality
Add profit taking, likely configurable sell targets (2:1 risk to reward gain for example)
Add another signal or two to help improve odds of making a winning trade.

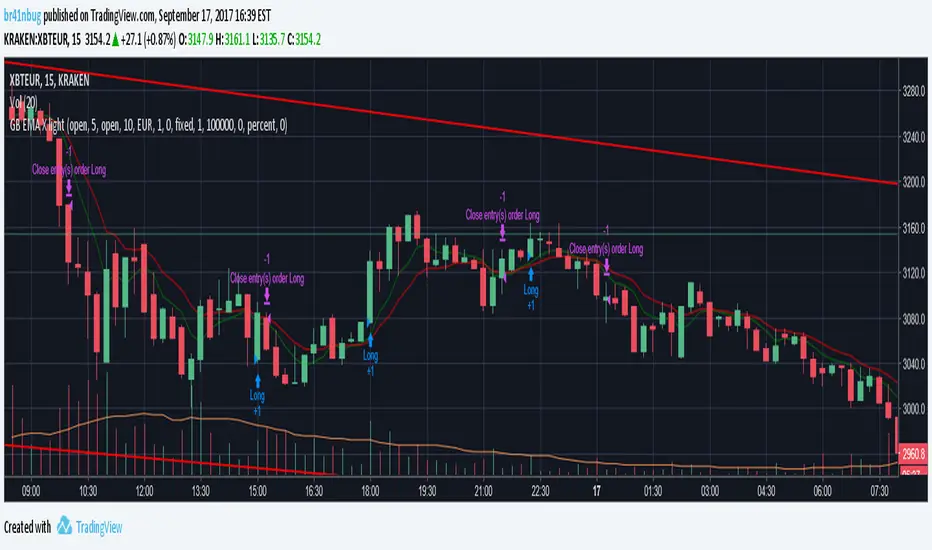
Grahn Gyllene KorsGrahn Gyllene Kors strategy is an idea that was brought to me and I was asked to create for the client to be used as an early alert signal for when BTC 0.05% is trending. The client has graciously now decided that this should be shared with everyone.
This is an EMA / Trend Explorer useful for identifying trends before EMA's cross and also identifying and experimenting with various EMA lengths and candle trends. There will be a companion Alert study for this released soon in which signals may be sent to the user via sms or email.
EMA Fast and EMA Slow may be adjusted in length and color and their display may be turned on or off.
Bullish X% F/S controls what percentage the EMA Fast should be above EMA Slow before considered bullish and is represented by the Green band on the chart.
Neutral > Y% < is what percentage surrounding the EMA Slow should be considered neutral and is represented by the Yellow band on the chart.
Bearish Z% S/F controls what percentage the EMA Fast should be below EMA Slow before considered bearish and is represented by the Red band on the chart.
Trend Enable determines whether Trend Strength is enforced in addition to EMA divergence.
Bull Strength is the number of candles ranging from 0 to 5 that should be consecutively higher in value before considered to be a trend.
Bear Strength is the number of candles ranging from 0 to 5 that should be consecutively lower in value before considered to be a trend.

GunbotXT TSSLSimulation of GunbotXT TSSL (trailing stop / stop limit) strategy useful for fine tuning settings and backtesting.
Once you have been granted access, you will receive notification in TradingView (Bell).
Then right click on Chart area -> click "Insert Indicator..." -> click "Invite-Only Scripts" -> click "GunbotXT TSSL" -> Add To Chart
At bottom -> click "Strategy Tester" -> click the "Gear" icon (Format) -> Input your desired settings to test.
Red = SellSTEP
Purple = SellGAIN
Red = SellSTOP
Blue/Yellow (changes) = FLowMA (lowest of 2 EMA's)
Blue = FastMA (off by default)
Yellow = SlowMA (off by default)
Orange = BuyPROTECT (BUY_LEVEL)
Green = BuySTOP
Green = BuySTEP
NOTICE: By requesting access to this script you acknowledge that you have read and understood that this is for research purposes only and I am not responsible for any financial losses you may incur by using this script!

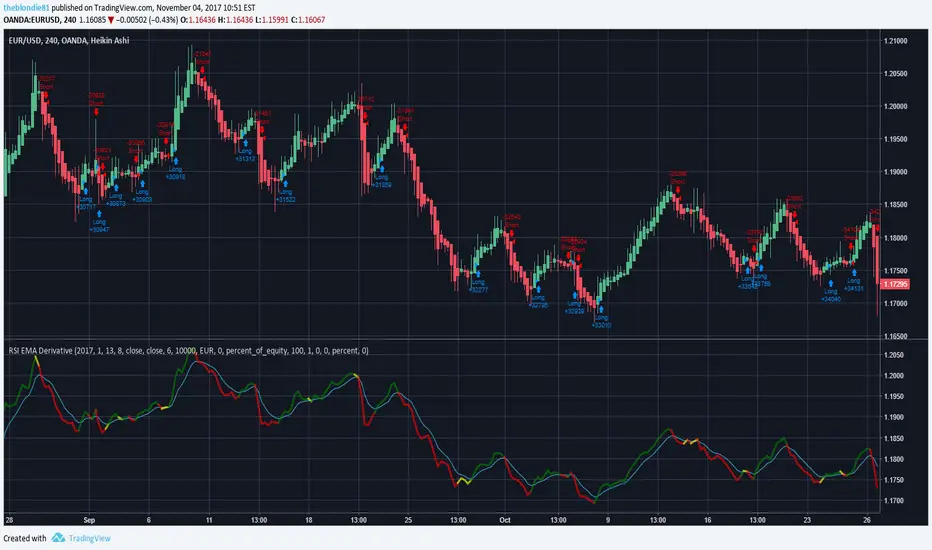
RSI EMA DerivativeUse Heiken Ashi candles to follow trends more easily.
4h or 24h time-frame is advised but any time-frame works.
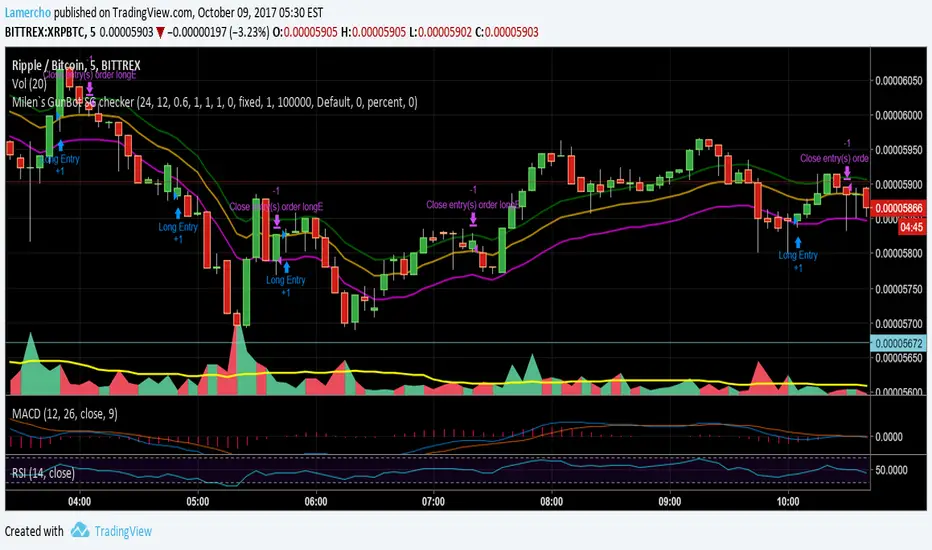
Milen`s GunBot SG checkerThis is simple checker for StepGain GunBot strategy.
The script still didnt take trendwatcher into account!
If you like it, please hit me with some dust:
BTC: 3QCxsgHwZEoW64pkQ1JG4U8Cs3rhQGJ5Zv
ETH: 0x28395c84C9DcdbB36a706075Be3F721F942250aE
DASH: XekM9Jdk4MFiCgHxbbwwaDL2z2tHW2ZCev
LTC: MNDrTr3jXP8fhHcHGw5p2MDKXn17LoB4cd
ZEC: t1QRGZENkuEKboWGr6pMjneQHQyPVnZM5LL
True Strength Indicator BTCUSD 2HScript based on True Strength Index (TSI) and RSI
A technical momentum indicator that helps traders determine overbought and oversold conditions of a security by incorporating the short-term purchasing momentum of the market with the lagging benefits of moving averages. Generally a 25-day exponential moving average (EMA) is applied to the difference between two share prices, and then a 13-day EMA is applied to the result, making the indicator more sensitive to prevailing market conditions.
!!! IMPORTANT IN ORDER TO AVOID REPAITING ISSUES
!!! USE Chart resolution >= resCustom parameter, suggestion 2H
Yellow zones indicates that you can claim position for better profits even before a claim confirmation.
Dark zones indicates areas where RSI shows overbought and oversold conditions.
BTCUSD

ema200ct-strategyDeveloper: Andrew Palladino
Date: 9/26/2017
Description: Takes counter trend trades back to the 200 EMA when bars since an EMA 200 touch exceeds a predefined bar count and vertical distance to EMA is large. The trade is closed at the 200 EMA.

Best SuperTrend LTCUSDIf you want get access for super Trend with the best and optimum values for:
LTCUSD profit +%120
ETHUSD profit +%80 aka Best SuperTrend ETHUSD chart 30m
OMGUSD profit +%115
BCHUSD profit +%80
LTCUSD profit +%125
(XRP,DASH coming soon, these profits include trading fee %0.2)
Fee 0.015BTC per week
Contact me by chat for a free demo
LTCUSD

Best SuperTrend ETHUSD chart 30mBest SuperTrend
Provides a strategy for ETHUSD with the best profits on cryptos
it uses specific parameters for an optimum short/long actions for this currency
Contact me by chat for a free demo.
If you want get access for super Trend with the best and optimum values for:
LTCUSD profit +%120
ETHUSD profit +%80
OMGUSD profit +%115
BCHUSD profit +%80
LTCUSD profit +%125
(XRP,DASH coming soon, these profits include trading fee %0.2)
Fee per week 0.015BTC
ETHUSD

DEMA Double Exponential Moving Average Strategy@Moneros 2017
Based on The DEMA is a fast-acting moving average that is more responsive to market changes than a traditional moving average
en.wikipedia.org
!!!! IN ORDER TO AVOID REPAITING ISSUES !!!!
!!!! DO NOT VIEW IN LOWER RESOLUTIONS THAN res/2 PARAMETER !!!!
for example res = 120 view >= 60m res = 60 view >= 30m
the length of the DEMA sampling shouldn't be longer than a candle
Best profits tested on BTCUSD
res = 105 slowPeriod = 2 fastPeriod = 32
res = 125 slowPeriod = 3 fastPeriod = 21
res = 120 slowPeriod = 2 fastPeriod = 32
res = 130 slowPeriod = 1 fastPeriod = 24
res = 40 slowPeriod = 4 fastPeriod = 93
res = 60 slowPeriod = 1 fastPeriod = 67
BTCUSD

Cuathro EMA StrategyIt's a long term script based on multiples EMA, crossover and crossunder.
Based on two good scripts CM Sling and OCC.
Always adjust resolution at least twice than chart.
Enjoy it! BTCUSD

EMA EnvelopeThis is an attempt to convert gunbot's SG strategy into a proper TradingView strategy. The problem is that SG Sell Level relies on % above purchase price, which we don't actually know in TradingView. So we could try to get the average of the next bar or something, which maybe this is what the Slippage setting is? I'm not sure.
Anyways, using % above EMA does actually work as a strategy a bit. It's nothing like Turtle Rules by tmr0 though!
Will keep working on this gradually; feedback greatly appreciated!

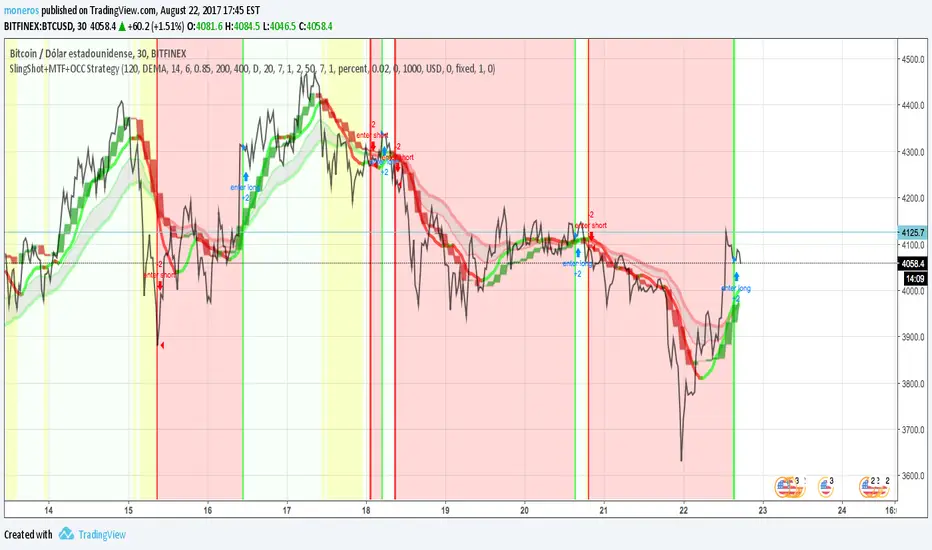
SlingShot + MTF + Open Close Cross StrategyIt's a merge of three really good scripts CM sling shot, CM MTC and Open Close Cross
Indicates open and close with Sling shot and shots after peaks by MTC and OCC.
Yellow zones before drop prices, green bar, red bar for open and close.
imgur.com
9/21 EMAS Cross Under/Over - EGAV1.3 FinalSimple signal buy and sell with emas crossing, works way better in daily charts

9/21 MovingAvg Cross Signal EGAV.35Simple buy/sell signal with 9 & 21 ema cross over/under, works better in Daily Charts

SlingShot by PuffySniffs out key EMA divergences and cross overs to catch large moves and abandon bad trades.
Expect 50/50


HL2 - 22 EMA Cross for RenkoEURUSD
This is a simple strategy to use for those who like Renko bars. I ONLY use it on Renko.
Basic idea is that when the Renko bar closes above or below the 22 EMA, you go long or short.
However, some of the frustrations I've had with any strategy shared in Tradingview is so few folks put in the ability to set a stop or a profit target or the ability to set a specific time to trade. I have added those to this strategy. (And I for the life of me can not remember where I got the code for the the time, I need to find you!).
Special note: If you have never used the Renko bars in Tradingview, make sure you click the Format option next to whatever pair you are looking at and change it from Traditional to ATR. You can set it for a static pip amount if you want. But ATR at first will help you decide which amount of pips you should throw in.
This is my first published strategy so if I screwed up on anything or didn't explain it very well, please let me know!!

Combining Exponential And Volume Weighting Backtest The related article is copyrighted material from Stocks & Commodities 2009 Oct
You can change long to short in the Input Settings
Please, use it only for learning or paper trading. Do not for real trading.
