Engulfing Candlestick ScannerThis Indicator is used to Identify Engulfing Candles. It work on any timeframe.
נר אינגלפינג Engulfing Candle

S9 ToolkitGENERAL OVERVIEW:
The S9 Toolkit is a multi-layered market structure and volume analysis indicator. It combines volumetric support and resistance, trendlines, engulfing candlesticks & zones, session volume profile, swing highs/lows, moving averages, and a checklist dashboard into one framework. Each component works independently while staying aligned with the others.
This indicator was developed by Flux Charts in collaboration with S9 Trades.
WHAT IS THE THEORY BEHIND THIS INDICATOR?:
The core idea is that price movement encodes behavior, not just direction. Candles show where price traded, but they don’t reveal how committed buyers or sellers were or whether a move was truly accepted or rejected. The S9 Toolkit exposes these behaviors by watching how price reacts at structurally important areas and by analyzing volume during those interactions.
Structure defines where the market is operating. Highs, lows, zones, and trends mark areas where the market has responded before. Volume adds context by showing the level of participation at those locations. Strong reactions, weak follow-through, repeated tests, and clean breaks each convey different information.
Market structure also changes over time. A zone that holds multiple tests may remain important, while one that breaks cleanly may lose relevance. The toolkit tracks these interactions so traders can see how structure evolves rather than treating levels as fixed. Sessions matter too. Markets behave differently across trading windows, and volume distribution shifts throughout the day. By incorporating session-based profiling and higher-timeframe alignment, the toolkit accounts for these differences.
The purpose of the S9 Toolkit is to clarify what the market is doing now and how that relates to earlier structure. It organizes price, volume, and structural change into a clear framework, helping traders make decisions with better context.
S9 TOOLKIT FEATURES:
The S9 Toolkit indicator includes 8 main features:
Volumetric Support & Resistance Zones
Trendlines Structure
Engulfing Candlesticks & Zones
Swing Highs/Lows
Session Volume Profile
EMAs & Directional Bias Dashboard
Checklist Dashboard
Alerts
Each component operates independently while sharing the same underlying market structure and confirmation logic. Detailed explanations for each component are provided in the sections that follow.
VOLUMETRIC SUPPORT AND RESISTANCE ZONES:
🔹 What is Support & Resistance?
Support and resistance are areas on the chart where price previously showed a meaningful reaction. Support is a price area where buying activity was sufficient to slow down or reverse a decline and is displayed in the lower portion of price movement, while resistance is a price area where selling activity was sufficient to slow down or reverse an advance, and is shown in the upper portion of price movement. These zones represent areas where bullish and bearish pressure accumulated and where price is more likely to react again when revisited.
The S9 Toolkit treats support and resistance as price zones. Price does not interact with one exact level but with a range where previous reactions occurred. These zones make it easier to observe whether price reacts, pauses, or moves through the same range when revisited.
(Screenshot: only Support Resistance Zones Enabled)
🔹 How the Indicator Identifies Support & Resistance
The S9 Toolkit identifies support and resistance using confirmed market structure.
◇ Step 1: Confirmed Swing Detection
The indicator first detects confirmed swing highs and swing lows using a user-defined pivot length. A swing is only confirmed after price has completed the required number of bars on both sides, ensuring that structure does not repaint.
Confirmed swing lows are used to identify support
Confirmed swing highs are used to identify resistance
(Screenshot: Pivot swing detection)
◇ Step 2: Zone Construction
Once a swing is confirmed, the indicator constructs a price zone.
The zone is created around the confirmed swing pivot
The zone boundaries are offset above and below the pivot using a fixed Daily Average True Range (ATR) value
The ATR value is used only to define the initial zone size and does not change after the zone is created
Each zone is plotted forward in time so future price interaction can be observed.
(Screenshot: Zones instead of Lines - based on ATR)
◇ Step 3: Overlap Filtering
To reduce clutter and redundant structure, newly detected zones are compared against existing zones of the same type. If a new zone overlaps too closely with an existing active zone, it is not created
(Screenshot: Ignoring overlapping zones)
🔹 Volumetric Information
Each zone displays the volume information accumulated during its formation. This includes total volume and the percentage breakdown between bullish and bearish activity. By embedding this information directly within the zone, the indicator allows traders to evaluate the character of the trading activity that created the structure.
◇ How volume is calculated
During zone formation, volume is accumulated using lower-timeframe data. Volume is classified as bullish when a bar closes at or above its open, and bearish when a bar closes below its open. This provides a consistent approximation of buying versus selling volume without requiring bid/ask data.
(Screenshot: Bullish Volume vs Bearish Volume)
◇ How volume is displayed
Each zone displays:
The total volume traded during zone formation
A percentage value indicating which side was dominant
For support zones, the percentage represents bullish volume
For resistance zones, the percentage represents bearish volume
◇ Imbalance Zones
In some cases, a zone may show volume dominance that does not align with its type. For example, a resistance zone may display a higher bullish volume percentage, or a support zone may display a higher bearish volume percentage. This indicates that price reversed despite greater activity from the opposing side during formation. These imbalanced zones are displayed the same way as other zones and provide additional information about how price reacted within that range.
(Screenshot: Imbalance Zones)
🔹 Breaks & Retests
After a zone is created, the S9 Toolkit tracks how price interacts with it over time.
◇ Retests
A retest occurs when price returns to a zone after moving away, trades into its price range, and reacts without breaking through the zone boundaries. The retest is only counted after the bar closes, ensuring that transient intrabar touches are not treated as valid retests.
(Screenshot: Retests)
◇ Breaks
A break occurs when price moves beyond a zone’s boundary according to the selected invalidation method.
(Screenshot: Zone breaks)
Breaks are evaluated only on confirmed bars. Intrabar price movement does not trigger break conditions, ensuring that only completed price action updates the zone state.
Once a break is confirmed, the zone is marked as broken and its internal state is updated. The zone no longer qualifies as active support or resistance and can optionally remain on the chart in a visually muted form.
🔹Settings
◇ Volumetric Info
Enables or disables the display of volumetric information inside support and resistance zones. When enabled, each zone shows the total volume traded during its formation along with the bullish and bearish volume distribution. When disabled, zones are displayed without any volume data.
◇ Pivot Length
The Pivot Length setting controls how many bars on each side of a price point are required to confirm a swing high or swing low, used to create support and resistance zones. A zone is only formed after the swing is fully confirmed. Higher Pivot Length values require more confirmation bars, resulting in fewer support and resistance zones based on larger, more established price moves. Lower values confirm swings more quickly, creating more frequent zones that reflect finer structural detail. Pivot Length only affects how support and resistance zones are identified and does not change the zone size or behavior after creation.
(Pivot Length: 5 Detects more zones)
(Pivot Length: 20 Detects fewer zones)
◇ Strength
The strength value represents the number of confirmed retests a support or resistance zone has received. Strength increases only when a valid retest occurs and is capped at a maximum of three. Zones are displayed only when their strength meets or exceeds the user-defined Strength setting. This value does not change after a zone is broken.
(Screenshot: Strength 1, 2 ,3 zones displayed)
◇ Higher-Timeframe Zones
The S9 Toolkit allows support and resistance zones to be calculated on a higher timeframe and projected onto the active chart. When a higher timeframe is selected, zone creation, retests, and breaks are all evaluated using that timeframe's data, while the zones themselves are displayed on lower timeframes without recalculation. This allows traders to observe how lower-timeframe price interacts with zones that were formed using higher-timeframe price action and a wider price range.
(Screenshot: Higher Timeframe Zones)
◇ Invalidation method
The S9 Toolkit allows users to control how a break is confirmed by selecting an invalidation method.
Close-based Invalidation: A break is confirmed only when price closes beyond the zone boundary. Wick penetration alone is ignored. This method requires price to fully accept beyond the zone before it is marked as broken.
Wick-based Invalidation: A break is confirmed when price wicks beyond the zone boundary, even if the candle closes back inside the zone. This method is more sensitive and captures early or aggressive break attempts.
(Screenshot: Zone Breaks with Close)
(Screenshot: Zone Breaks with Wick)
◇ Display Nearest
The Display Nearest setting controls how many of the closest support and resistance zones are shown on the chart relative to the current price. Only the nearest active zones above and below price are displayed, while older or more distant zones are hidden. This helps reduce visual clutter and keeps the focus on the most immediately relevant support and resistance areas without removing or recalculating any underlying zones.
(Screenshot: Display nearest 2 zones)
◇ Breaks & Retests
These settings control the visibility and appearance of break and retest markers on support and resistance zones. Users can independently enable or disable break markers and retest markers. Color settings allow customization of how bullish and bearish retests and zone breaks are displayed on the chart, making it easier to distinguish different types of interactions. Turning these options off hides the markers without affecting how zones are calculated.
◇ Show invalidation Zones
The Show Invalidated Zones setting controls whether support and resistance zones remain visible after they are broken. When enabled, zones that have been invalidated are kept on the chart in a visually muted form. This allows users to see where zones were previously active without treating them as current support or resistance. When disabled, invalidated zones are removed from the chart once a break is confirmed, keeping the display focused only on active zones.
(Screenshot: Historical Zones are muted)
TRENDLINES:
🔹 What is a Trendline
A bullish trendline is a line drawn by connecting higher swing lows, showing that price is making progressively higher lows over time. As long as price continues to respect this line, upward movement remains intact. A bullish trendline is typically tested from above, and a break occurs when price closes below the line.
(Screenshot: Bullish Trendline)
A bearish trendline is a line drawn by connecting lower swing highs, showing that price is making progressively lower highs over time. As long as price respects this line, the downward movement remains intact. A bearish trendline is typically tested from below, and a break occurs when price closes above the line.
(Screenshot: Bearish Trendline)
🔹How it works
In the S9 Toolkit, trendlines are constructed using confirmed swing points. Each trendline is created only after a valid sequence of pivots is identified, ensuring that lines are based on completed price movement rather than interim fluctuations. Once drawn, a trendline extends forward and is continuously evaluated as new price data forms. Trendlines and volumetric zones work together in the S9 Toolkit. Zones highlight areas where price interacts and trades, while trendlines show the overall directional structure. When viewed together, they help traders see whether price is moving in line with the current structure or beginning to move away from it.
🔹How the indicator detects trendlines
◇ Step 1: Detect confirmed swing pivots
The S9 Toolkit identifies confirmed swing highs and swing lows using the selected Swing Length setting. A pivot is only confirmed after the required number of bars have formed on both sides, ensuring completed structure and non-repainting behavior.
(Screenshot: Confirmed swing pivots)
◇ Step 2: Form and validate a candidate trendline
When a new pivot is confirmed, the indicator attempts to connect it with the previous pivot of the same type. For bearish trendlines, the new swing high must be lower than the previous swing high. For bullish trendlines, the new swing low must be higher than the previous swing low.
(Screenshot: New Lower High)
◇ Step 3: Apply strength filtering
Each valid candidate trendline is evaluated using a slope-based strength calculation derived from the relative size of the swing legs between the pivots, rather than a simple angle measurement. If the calculated strength does not meet the user-defined Strength threshold, the trendline is filtered out and not displayed.
(Screenshot: Strength Calculation)
◇ Step 4: Extend the trendline and draw the zone
Validated trendlines are extended forward by the number of bars defined in the Extend By setting. A shaded zone is drawn around the line using ATR-based padding so price interaction is observed as an area rather than a single line.
(Screenshot: S9 Toolkit’s Trendlines)
🔹 Swing Length
The Swing Length setting controls how swing points are identified for trendline construction. A swing point is confirmed only after the specified number of bars has formed on both sides of the pivot. A higher swing length requires more bars to confirm each pivot, resulting in fewer swing points and trendlines that reflect longer-term price movement. A lower swing length confirms pivots more frequently, producing more swing points and shorter-term trendlines that react more quickly to price changes.
(Screenshot: Trendlines with Smaller Swing Length)
(Screenshot: Trendlines with Higher Swing Length)
🔹Strength filtering
The strength setting controls how selective the trendline detection is. Higher strength values require more pronounced directional moves between swing points, filtering out flatter or weaker trendlines. Lower values allow more trendlines to appear, including those with gentler slopes. This allows traders to adjust sensitivity based on their preferred level of structural detail.
(Screenshot: Low strength zones, Flatter Slope)
(Screenshot, High Strength Zones, Weaker Filtered out)
🔹Trendline extension and lifecycle
Once established, trendlines extend forward by a user-inputted number of bars and remain active until invalidated by confirmed price behavior. A trendline does not disappear simply because the price moves away from it. Its relevance is reassessed only when the price decisively breaks through it.
(Screenshot: Trendlines Keep Extending Until Invalidation)
🔹Extend By
The Extend By setting controls how far a trendline is extended forward after its last confirmed pivot or break. The value defines the number of bars the trendline continues beyond that point for ongoing reference.
(Screenshot: Extend by Example)
🔹Show Last
The Show Last setting limits the number of most recent trendlines displayed on the chart. Older trendlines beyond this limit are hidden to reduce visual clutter.
(Screenshot: Show Last Settings)
🔹 Regular Breaks
A regular break occurs when price closes beyond the trendline on a confirmed bar. Intrabar movement is ignored, ensuring that only completed candles can invalidate a trendline. Regular breaks are evaluated using the same confirmed-bar logic as support and resistance zones.
(Screenshot: Regular Breaks)
🔹 Engulfing Breaks
An engulfing break occurs when a valid engulfing candle forms at the trendline. Instead of requiring a close beyond the line, the engulfing pattern itself is used as the break condition. Engulfing breaks are also evaluated only on confirmed bars and can be enabled independently of regular breaks.
(Screenshot: Engulfing Breaks)
The engulfing candlesticks used for trendline break detection follow the same criteria described later in this write-up in the Engulfing Candlesticks section below, where the pattern is explained in detail.
After a break, the trendline stops extending and is marked with a break label.
🔹Hide Invalidated Trendlines
When enabled, trendlines are removed from the chart after a confirmed break to reduce chart clutter and keep the focus on active directional structure. When disabled, broken trendlines remain visible for reference, allowing users to see where previous directional boundaries existed without treating them as valid trendlines.
(Screenshot: Only Valid Trendlines displayed)
🔹How to interpret trendline breaks and continuation
Trendlines should be viewed for directional reference, not as buy or sell signals. When price respects a trendline, it suggests the market is continuing in the same direction, and structure remains aligned. When reactions become weaker or price starts overlapping the line, it may indicate that directional strength is fading.
Clear breaks, especially when they occur near zones or alongside volume changes, often show that the market is re-evaluating its direction. When trendlines align with volumetric zones, price reactions tend to be more meaningful. When they do not align, the mismatch itself becomes useful information.
The S9 Toolkit highlights these relationships so traders can observe whether direction and structure remain aligned or begin to separate.
ENGULFING CANDLE BEHAVIOR AND ZONES:
🔹What is an engulfing candlestick
An engulfing candlestick occurs when a candle completely overtakes the body of the previous candle in the opposite direction. The current candle closes beyond the prior candle’s range, showing that price moved decisively during that bar rather than continuing the previous movement. This type of candlestick highlights a clear shift in short-term price direction compared to the preceding candle and marks areas where price momentum changes abruptly.
A bullish engulfing candlestick forms when a bearish candle is followed by a larger bullish candle that fully engulfs the previous candle’s body and closes above its high.
(Screenshot: Bullish Engulfing)
A bearish engulfing candlestick forms when a bullish candle is followed by a larger bearish candle that fully engulfs the previous candle’s body and closes below its low.
(Screenshot: Bearish Engulfing)
🔹 How the indicator detects engulfing candlesticks
◇ Step 1: Compare candle direction
The indicator first checks whether the previous candle and the current candle are in opposite directions. A bullish engulfing requires the previous candle to be bearish and the current candle to be bullish. A bearish engulfing requires the previous candle to be bullish and the current candle to be bearish.
(Screenshot: Bullish Candle/ Bearish Candle)
◇ Step 2: Apply body-size requirement
The indicator then checks that the current candle’s body is significantly larger than the previous candle’s body. This requirement filters out weak or marginal engulfing candles and focuses only on more decisive price movement.
(Screenshot: Weak Body vs Strong Body)
◇ Step 3: Confirm range takeover with a close beyond the prior bar
After the size condition is met, the indicator requires the current candle to close beyond the previous candle’s range:
Bullish engulfing candles must close above the previous candle’s high.
Bearish engulfing candles must close below the previous candle’s low.
(Screenshot: Closing above previous high)
◇ Step 4: Highlight the engulfing candle on the chart
When an engulfing candlestick is detected, the indicator highlights the candle using direction-specific colors. Bullish engulfing candles and bearish engulfing candles are colored separately based on the user’s Engulfing Candlesticks color settings, allowing quick visual identification on the chart.
(Screenshot: Highlighting the Engulfing Candle)
🔹Engulfing Zones
When a valid engulfing candlestick is detected, the toolkit constructs an engulfing zone based on the price range of the engulfing candlestick. For bullish engulfing, the zone spans from the current bar's high down to its open. For bearish engulfing, the zone spans from the current bar's open down to its low. These zones persist forward in time and can be revisited, tested, or invalidated like other structural elements. The toolkit tracks whether price later returns to mitigate (trade through) these zones.
(Screenshot: Engulfing Zones)
🔹Show Last
This setting limits the number of engulfing zones displayed on the chart. When set to a value such as 5, only the five most recent engulfing zones that have not yet been mitigated are shown, while all others are hidden to reduce chart clutter.
(Screenshot: Last 2 Engulfing Zones)
🔹How to interpret engulfing behavior
Engulfing behavior should be read as a sign of decisive price movement. A bullish engulfing event shows that buying pressure was strong enough to overcome the prior bar's range and close higher. A bearish engulfing event shows the same for selling pressure.
The most important information comes from what happens next. Continued movement in the same direction suggests follow-through, while overlap or hesitation suggests the move may be temporary.
Engulfing behavior becomes more contextually significant when it aligns with other toolkit components. An engulfing event that forms near a volumetric support zone, along a trendline, or close to a session POC may carry more weight than one that appears in open space. The toolkit presents these events as points of interest, allowing traders to evaluate context without treating them as automatic trade signals.
🔹Zone mitigation logic
When price revisits an engulfing zone after its creation, the toolkit tracks whether the zone is mitigated. A zone is marked as mitigated when price trades through it (closes beyond its boundary). Mitigated zones stop displaying, keeping the chart focused on active, unmitigated structure.
By highlighting engulfing behavior and optionally tracking the resulting zones, the S9 Toolkit turns candle patterns into observable reference points. Traders can see where decisive price moves occurred and whether those areas continue to influence later price behavior.
HIGHS AND LOWS STRUCTURAL MARKERS:
🔹How it works
The toolkit marks swing highs and lows as horizontal reference lines on the chart. These represent confirmed pivot points where price changed direction. When price later breaks through a prior swing level, it's marked with a "B" label.
🔹Swing detection
Swing sensitivity is configurable. Lower values detect more swings with finer detail. Higher values detect fewer, more significant pivots. Swings are only marked after confirmation, so they don't repaint.
🔹How to interpret
Swing highs and lows show where price previously reversed. Breaks show where price has moved beyond prior structure. Sequences of higher highs/lows or lower highs/lows help assess directional context.
SESSION VOLUME PROFILE:
🔹How it works
The Session Volume Profile component of the S9 Toolkit organizes traded volume across price for a defined trading session. Volume is arranged vertically across price levels, showing where activity concentrated and where trading interest was limited during that session. This helps identify the price areas where the market spent time trading and building activity. Sessions can be defined explicitly to reflect distinct trading environments, such as regional market opens or custom intraday windows. Each session profile resets independently, allowing traders to observe how value develops and shifts from one session to the next without cumulative distortion.
🔹How volume is distributed across price
Volume is aggregated across all bars within the active session and mapped to price levels using a configurable number of rows. The toolkit divides the session's price range into equal segments and distributes each bar's volume across the rows that the bar's range touches. Volume distribution uses a proportional calculation method where each bar's volume is allocated based on how much of the bar's range falls within each price row. This creates a distribution that highlights high-activity price levels and low-activity gaps. Volume is classified as up or down based on candle direction, providing a consistent way to separate buying and selling activity across the profile.
🔹Point of Control (POC)
The Point of Control represents the price level where the highest amount of volume was traded during the session. It marks the area of greatest trading activity and often acts as a gravitational reference point for price. The POC highlights where the market showed the strongest willingness to transact during that session.
Repeated interaction with a session POC suggests continued interest around that price level, while clean movement away from it can indicate that trading activity is shifting elsewhere.
🔹Value Area High and Low (VAH / VAL)
The Value Area defines the range of prices where the majority of session volume was exchanged. VAH marks the upper boundary of this range, while VAL marks the lower boundary. Together, they frame the area where the market considered prices fair during that session.
Price behavior around VAH and VAL often provides context. Continued trading within the value area reflects concentrated activity, while sustained trade outside of it often coincides with expansion or transition in price behavior.
🔹How to interpret session-based volume structure
Session Volume Profile should be interpreted in conjunction with structure and direction. A session that develops value above prior structure may indicate continuation, while value developing below may suggest reassessment. Sessions with narrow value and low activity often precede expansion, while sessions with wide, overlapping value often reflect consolidation.
By resetting profiles each session, the S9 Toolkit helps traders observe how value shifts over time and how activity changes across different trading environments. Session Volume Profile highlights where trading activity is concentrated and where it is limited, providing a clear context for how price movement develops afterward.
EMA BIAS:
🔹How it works
The toolkit allows users to display up to three exponential moving averages, each with a user-defined length. These EMA lengths can be configured independently, allowing short-, medium-, and longer-term averages to be viewed together on the chart. Each EMA updates continuously as new bars form.
🔹 Price Above the EMAs
When price trades consistently above one or more EMAs, bias relative to those EMAs is considered positive. This indicates that price is accepting higher levels and that upward movement is being maintained. When multiple EMAs are stacked below price and begin to spread apart, it often reflects bullish price discovery, where price is moving higher with momentum.
(Screenshot: Price above ema, Emas spread apart)
🔹Price Below the EMAs
When price trades consistently below one or more EMAs, bias relative to those EMAs is considered negative. This indicates that lower prices are being accepted and downward movement is being maintained. When multiple EMAs are stacked above price and spread apart, it often reflects bearish price discovery, where price is moving lower with strong directional pressure.
(Screenshot: Bearish EMA Direction)
🔹Frequent EMA Crossings and Compression
When price crosses back and forth through the EMAs and the EMAs remain close together, directional bias is unclear. This behavior typically indicates consolidation or range-bound conditions, where price lacks sustained directional movement and reactions at support or resistance are more likely to be rotational rather than trending.
(Screenshot: Frequent Crossing, Range-Bound)
CHECKLIST DASHBOARD:
🔹How it works
The Checklist Dashboard is a context reference tool designed to present selected market conditions in a compact, easy-to-read format. It brings together key observations from the S9 Toolkit and displays them in one place, allowing traders to review structure, direction, and interaction without scanning the entire chart.
Most checklist items are manually assessed and toggled by the trader based on their own reading of the chart. This allows the checklist to function as a disciplined review framework rather than an automated signal generator. The EMA-related item is the only condition that updates automatically based on live price behavior.
🔹How checklist conditions are handled
Each checklist item represents a specific consideration, such as structural alignment, directional bias, or interaction with key zones. Except for EMA, checklist states are user-controlled and reflect the trader's interpretation of current conditions using the toolkit's visual components.
Conditions are presented in a simple binary format to reduce cognitive load. The checklist does not rank, weight, or score conditions. Its purpose is to organize thought, not to make decisions.
🔹How to use the checklist
The Checklist Dashboard is best used as a discipline and a confluence aid. A checklist showing broad alignment can indicate a cleaner market environment, while mixed states can highlight uncertainty, compression, or transition.
Because the checklist is configurable and largely manual, traders can adapt it to different workflows, higher-timeframe analysis, intraday execution, or post-analysis review. Used properly, it helps maintain consistency and situational awareness without introducing mechanical bias or automated decision-making.
INPUTS:
🔹Volumetric Support & Resistance
◇ Enable
Turns volumetric support and resistance zones on or off entirely.
◇ Pivot Length
Defines how many bars on each side are required to confirm a swing pivot.
Higher values produce fewer, more stable zones based on higher-level structure. Lower values produce more frequent zones with finer structural detail.
◇ Strength
Sets the minimum number of valid retests required for a zone to remain active. Strength increases only when price revisits the zone without breaking it. The maximum strength is capped at three.
◇ Timeframe
Allows zones to be sourced from a higher timeframe and projected onto the active chart. When set, all zone logic (creation, retests, breaks) is evaluated on the selected timeframe while remaining historically aligned.
◇ Invalidation Method
Controls how zone invalidation is confirmed:
Close: A zone is invalidated only when the price closes beyond its boundary.
Wick: A zone is invalidated when the price wicks beyond its boundary.
Close-based invalidation is more conservative; wick-based invalidation is more sensitive.
◇ Display Nearest
Limits how many of the closest active zones are displayed.
◇ Volumetric Info
Displays internal volume information inside each zone, including total volume and bullish/bearish percentage split based on candle direction during zone formation.
◇ Retests
Displays retest markers when price revisits a zone and reacts without invalidation.
◇ Breaks
Displays visual markers when a zone is invalidated according to the selected invalidation method.
◇ Show Invalidated Zones
Keeps invalidated zones on the chart in a visually muted state. This preserves historical structure and allows observation of how price behaves around former areas of interest.
🔹Trendlines
Trendline inputs control directional structure derived from confirmed swings.
◇ Enable
Enables or disables all trendline calculations and rendering.
◇ Swing Length
Defines how many bars are required to confirm swing highs and lows used for trendline construction. Higher values emphasize broader directional structure; lower values increase sensitivity.
◇ Strength
Sets the minimum slope strength required for a trendline to be considered valid. Higher values filter out flatter or weaker trendlines.
◇ Extend By
Controls how many bars a trendline extends forward beyond its last confirmed point or break.
◇ Show Last
Limits the number of most recent trendlines displayed to reduce clutter.
◇ Regular Breaks
Marks a trendline break when price closes beyond the trendline.
◇ Engulfing Breaks
Marks a trendline break when a valid engulfing candle occurs at the trendline.
◇ Hide Invalidated Trendlines
Removes broken trendlines from the chart after confirmation.
🔹Engulfing Candlesticks
◇ Bullish Engulfing / Bearish Engulfing
Enables detection of bullish or bearish engulfing candles based on body size and directional criteria.
◇ Engulfing Zones
Creates zones from engulfing candles that can be revisited, tested, or invalidated like other structural elements.
◇ Show Last
Limits how many recent engulfing events or zones remain visible.
🔹Session Volume Profile
◇ Session Volume Profile
Enables session-based volume profiling.
◇ Session
Defines the active session window used to build each profile. Profiles reset automatically at session boundaries.
◇ Volume Mode
Controls how volume is displayed:
Up / Down: Separates volume based on candle direction.
Total: Displays total volume per price row.
Delta: Displays directional imbalance.
◇ Value Area Volume (%)
Defines the percentage of total session volume used to calculate the Value Area.
◇ Row Size
Defines how the session’s price range is divided when constructing the volume profile. Each row represents a discrete price band where volume is aggregated.
◇ Profile Placement
Anchors the volume profile to the left or right of the session range.
◇ Point of Control (POC)
Displays the price level with the highest traded volume for the session.
◇ Value Area High / Low (VAH / VAL)
Displays the upper and lower boundaries of the value area.
◇ Only Show Current Session
Hides historical session profiles and displays only the active session.
🔹Highs & Lows
◇ Highs/Lows
Enables swing high and swing low detection.
◇ Swing Length
Defines how many bars are required to confirm a swing pivot.
◇ Display Nearest
Limits how many recent swing levels are displayed.
◇ Show Breaks
Marks when price breaks beyond a prior swing high or low using confirmed bars.
🔹EMAs
◇ EMA Visibility and Lengths
Controls which EMAs are displayed and their respective lengths.
🔹Checklist Dashboard
◇ Enabled
Shows or hides the checklist dashboard.
◇ Checklist Items (1–5)
Each checklist item consists of:
A manual true/false toggle
A custom label
These reflect the trader’s interpretation of current conditions using the toolkit’s visual components.
◇ EMA Checklist
Automatically displays EMA alignment status. This is the only dynamic checklist item.
◇ Position
Controls where the checklist appears on the chart.
◇ Size
Controls dashboard text and spacing.
ALERTS:
🔹How alerts are triggered
Alerts in the S9 Toolkit notify traders when important structural or behavioral events occur. Each alert is linked to confirmed conditions, so notifications reflect completed market behavior. Alerts trigger only after the condition is confirmed on a closed bar.
Alert logic mirrors the same confirmation rules used throughout the toolkit. If a zone is invalidated, a trendline is broken, or a structural condition changes, the alert fires only once the event is confirmed. This prevents duplicate or misleading alerts caused by intrabar fluctuations or temporary probes.
🔹Available alert types
The S9 Toolkit supports alerts for the following events:
◇ Trendlines:
Bullish Trendline Detection
Bearish Trendline Detection
Bullish Trendline Break
Bearish Trendline Break
◇ Support/Resistance Zones:
Support Zone Detected
Resistance Zone Detected
Support Zone Retest
Resistance Zone Retest
Support Zone Break
Resistance Zone Break
◇ Engulfing Patterns:
Bullish Engulfing Candlestick
Bearish Engulfing Candlestick
◇ Swing Structure:
Swing High Break
Swing Low Break
◇ Moving Averages:
EMA Direction Change (price crosses above or below EMA)
Each alert type can be individually enabled or disabled in the indicator settings.
🔹How to set up alerts
To create alerts, add the S9 Toolkit indicator to your chart and configure which alert types you want to receive in the indicator settings. Then create a TradingView alert on the chart, select the S9 Toolkit indicator, and choose "Any alert() function call" as the condition. This will trigger an alert whenever any of your enabled alert types fires.
PERFORMANCE AND DESIGN CONSIDERATIONS:
🔹Lower-timeframe data handling
Some components of the S9 Toolkit rely on lower-timeframe data to provide more granular volume and structural insight. These requests are handled explicitly and conservatively to avoid excessive data usage or performance degradation. Lower-timeframe logic is applied only where it meaningfully enhances analysis, and safeguards are in place to prevent unnecessary recalculation.
🔹Object limits and performance safeguards
The toolkit actively manages drawing objects such as zones, lines, and profiles to remain within TradingView’s object limits. Older or less relevant objects can be pruned, merged, or visually downgraded to preserve chart performance. This ensures stability even when multiple components are enabled simultaneously.
🔹Non-repainting and confirmation logic
All calculations in the S9 Toolkit are based on confirmed historical data. No component relies on future bars or retroactive adjustment. Structural elements update only when confirmation conditions are met, ensuring that historical analysis remains consistent with real-time behavior. This design principle allows traders to trust that what they see on the chart reflects what was available at the time.
UNIQUENESS:
The S9 Toolkit focuses on contextual analysis by organizing price, volume, and structure into layered components that operate together rather than as isolated signals. It combines volumetric support and resistance zones with internal volume breakdowns, trendline structure, engulfing candlestick detection, session-based volume profiling, and swing structure tracking in a single visual layout. Unlike indicators that focus on one technique at a time, each component in the S9 Toolkit is designed to coexist without overriding the others, allowing traders to observe alignment, disagreement, and transitions in market conditions within the same chart view.

Engulfing Reversal PatternThe Engulfing Reversal Pattern indicator seeks out both bullish and bearish reversal patterns. This indicator offers the user numerous options to modify the indicator to their needs.
Key features:
Ability to adjust the size of the Engulfing candle in comparison to the prior candle
Ability to adjust the number of breakout candles
Indicator adapts to the Time Frame it is being used in
You can choose between identifying only Bearish patterns, only Bullish patterns or both.
Indicator Arrow size can be adjusted in size.

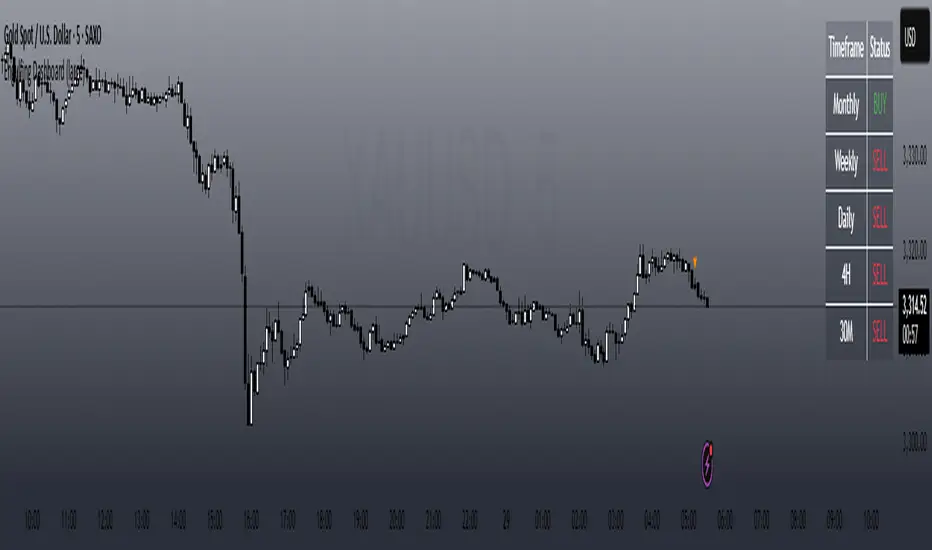
CRT+ Advance Engulfing | @stefandimovCRT+ Lite implements institutional-style Candle Range Theory logic to identify displacement-driven engulfing structures with precision.
The script focuses on wick-based liquidity grabs, strict body closes, and optional higher-timeframe confirmation to highlight structurally valid bullish and bearish reversals.
Includes a Daily-only multi-market scanner and a compact dashboard for fast top-down analysis.
Designed for traders who prioritize structure, execution precision, and HTF alignment.

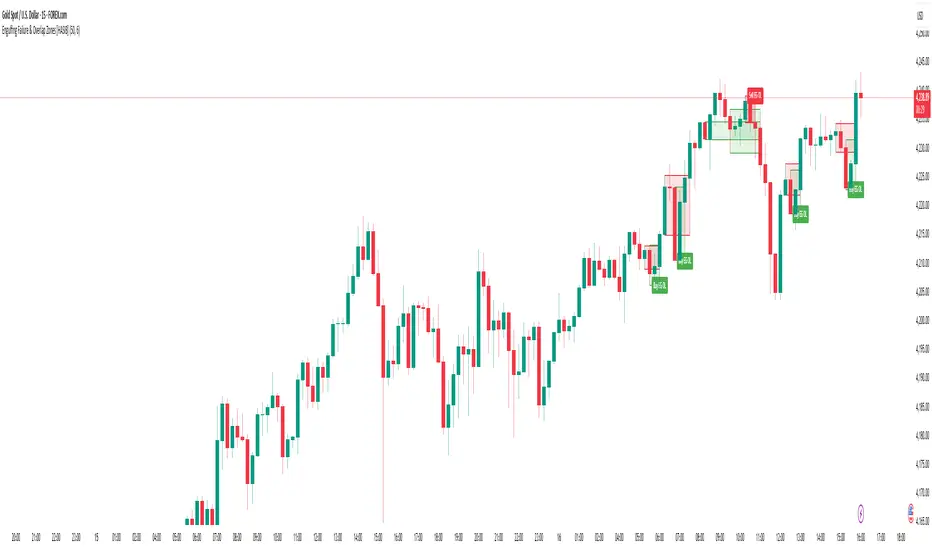
Engulfing Failed Zone Detector by RWBTradeLabEngulfing Failed Zone Detector by RWBTradeLab
A clean, non-repainting tool that focuses on one thing only: showing where strong engulfing patterns failed and the market broke through their base.
What this indicator does
This script automatically scans for confirmed engulfing patterns (Regular & E-Regular) and then tracks where those structures are invalidated.
It highlights two types of failure zones:
1. Buy Engulfing Failed
* A bullish engulfing pattern forms (Regular or E-Regular).
* Later, a bearish candle closes below the base low of that engulfing.
* The zone from the base candle to the failure candle is marked as Buy EG Failed .
2. Sell Engulfing Failed
* A bearish engulfing pattern forms (Regular or E-Regular).
* Later, a bullish candle closes above the base high of that engulfing.
* The zone from the base candle to the failure candle is marked as Sell EG Failed .
Only the first clear failure after each engulfing is drawn, keeping the chart clean and readable.
Visuals on chart
1. A rectangle (box) is drawn from the engulfing base candle to the failure candle.
2. Labels are placed automatically:
* Buy EG Failed (below the zone)
* Sell EG Failed (above the zone)
3. Label distance from the zone is controlled by Text Offset from Box (%).
4. Separate color controls for:
* Buy Engulfing Failed Box Color
* Sell Engulfing Failed Box Color
The label style matches Engulfing Detector by RWBTradeLab for a consistent visual experience.
Alerts
Built-in alerts trigger only on confirmed bar close when a new failure completes:
* Buy EG Failed
* Sell EG Failed
Each alert message includes:
* Brand prefix: RWBTradeLab
* Price
* Time
* Ticker
Perfect for linking with bots, webhooks or alert-based trade management.
Key settings
Candle Length (closed candles)
* Defines how many recent confirmed candles are scanned (the live bar is excluded).
Display toggles
* Buy Engulfing Failed
* Sell Engulfing Failed
* Text
Turn each element ON/OFF to control how much information you want on the chart.
Text Offset from Box (%)
* Controls how far the label is placed from the failed zone, with a safe minimum to keep labels clear and readable.
Non-repainting confirmation
* All detection and alerts are based on closed candles only.
* No signals from the running candle, no repaint tricks.
* Once a failure zone appears, it stays fixed.
Best use
Failed engulfing zones can reveal:
* Broken demand/supply zones
* Liquidity grabs where “smart money” flushed traders out
* Strong momentum shifts after a failed reversal attempt
* Levels where continuation or clean retests often occur
Works on any symbol and timeframe. For best results, combine with:
* Higher timeframe structure
* Key support/resistance or supply/demand mapping
* Your own confirmation tools and risk management
Disclaimer
This indicator is a technical pattern-detection tool, not financial advice. Trading involves risk. Always confirm signals with your own analysis and use proper risk management.
Creator: RWBTradeLab
If this script adds value to your trading, please leave a ⭐ and share your feedback.

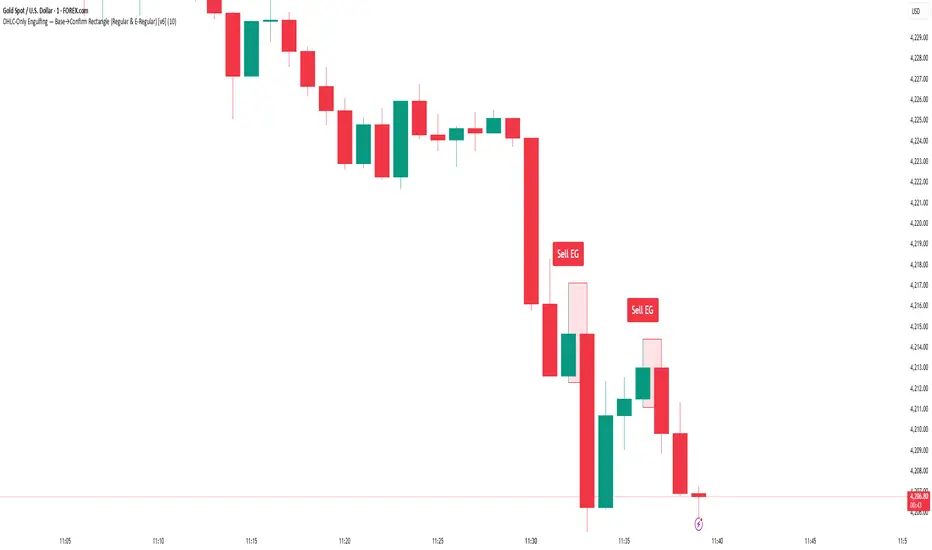
Engulfing Overlap Zone Detector by RWBTradeLabEngulfing Overlap Zone Detector by RWBTradeLab
A focused, non-repainting tool that detects high-value “overlap zones” formed when one engulfing pattern fails and the opposite side immediately takes control.
What this indicator does
Instead of showing every engulfing pattern, this script filters out noise and highlights only Engulfing Overlap Zones:
1. It internally detects both:
* Regular Engulfing (R EG)
* E-Regular Engulfing (ER EG)
2. It then checks for engulfing failure:
* A Sell EG fails when a bullish candle closes above its base high.
* A Buy EG fails when a bearish candle closes below its base low.
3. After the failure, it looks for an opposite-side engulfing confirmation.
4. When the failed zone and the new opposite engulfing zone overlap, the script marks that region as a Buy EG Overlap or Sell EG Overlap zone.
Only these premium, overlap-based structures are shown on the chart.
Visuals on chart
1. Two stacked rectangles are drawn for each overlap setup:
* The failed engulfing zone
* The opposite confirming engulfing zone
2. Clean labels appear at the edge of the overlap:
* Buy EG Overlap (bullish zone)
* Sell EG Overlap (bearish zone)
3. Text distance from the zone is adjustable via Text Offset from Box (%).
4. Separate color controls for:
* Buy Engulfing Overlap Box
* Sell Engulfing Overlap Box
Alerts
Built-in alerts trigger only on confirmed bar close when a new overlap setup completes:
*Buy EG Overlap
*Sell EG Overlap
Each alert message includes price, time and ticker, prefixed with RWBTradeLab for easier filtering and automation.
Key settings
1. Candle Length (closed candles) – Defines how many recent confirmed candles are scanned (current bar is excluded).
2.Display toggles – Turn ON/OFF:
* Buy Engulfing Overlap
* Sell Engulfing Overlap
* Text labels
3. Text Offset from Box (%) – Controls how far the label is placed from the overlap zone, with a safe minimum to keep labels readable.
Non-repainting logic
* All calculations use closed candles only .
* No running-bar signals, no repaint tricks.
* The zones and alerts reflect stable, confirmed structures.
Best use
This indicator is designed to help you spot:
* Liquidity grabs and fake outs followed by real reversals
* Strong continuation zones after a failed attempt by the opposite side
* High-quality reaction areas for entries, pullbacks and retests
Works on any symbol or timeframe. For best results, combine with:
* Higher-timeframe market structure
* Key support/resistance or supply/demand zones
* Your own trade management and confirmation rules
Disclaimer
This script is a technical pattern-detection tool, not financial advice. Trading involves risk. Always use proper risk management and confirm signals with your own analysis.
Creator: RWBTradeLab
If this indicator helps your trading, please leave a ⭐ and share your feedback.

Engulfing CandlesEngulfing Candles highlights two tiers of engulfing structures on the chart:
Strong Engulfing – aggressive, high-conviction outside bars where the real body completely dominates the previous candle.
Regular Engulfing – clean outside bars that still show control, but with looser body conditions.
Both are plotted as dots directly on the price so you can quickly spot liquidity sweeps and potential reversal/continuation zones.
1. Strong Engulfing (Body + Outside Bar)
Concept:
A Strong Engulfing candle is a strict outside bar that both sweeps liquidity and shows decisive control in the body (current body fully covers the previous body).
Strong Bullish Engulfing
Plotted as a solid red dot above the bar.
2. Regular Engulfing (Outside Bar Only)
Concept:
Regular Engulfing marks strict outside bars that still show control, but without requiring the current body to completely engulf the prior body. They are weaker than Strong but still useful context for structure and liquidity sweeps.
Regular Bullish Engulfing
Plotted as a faded red dot above the bar.
3. Inputs & Customization
Strong Engulfing group
Show Strong Bullish Engulfing
Show Strong Bearish Engulfing
Max Upper Wick: Body (Bullish)
Controls how long the upper wick can be relative to the body for strong bullish signals.
Max Lower Wick: Body (Bearish)
Controls how long the lower wick can be relative to the body for strong bearish signals.
Regular Engulfing group
Show Regular Bullish Engulfing
Show Regular Bearish Engulfing
Require Previous Candle Opposite Color
When enabled, regular engulfing requires a color flip (e.g., red → green for bullish engulfing).

Engulfing Detector by RWBTradeLabEngulfing Detector by RWBTradeLab
A clean, non-repainting engulfing pattern detector designed for traders who rely on price action and candle confirmation.
What this indicator does
This script automatically identifies and highlights two types of engulfing patterns on closed candles only:
1. Regular Engulfing (R EG)
* Regular Buy EG: A bullish candle fully engulfs the previous bearish candle’s high.
* Regular Sell EG: A bearish candle fully engulfs the previous bullish candle’s low.
2. E-Regular Engulfing (ER EG)
* Detects “extended” engulfing setups where a strong base candle is followed by 2 or more opposite-color candles and then a confirming engulf close.
* Useful for spotting delayed but powerful reversals.
Visuals on chart
* A rectangle (box) is drawn from the base candle to the confirmation candle.
* Optional text labels appear above/below the box (offset adjustable).
* Separate color controls for:
- Regular Buy / Regular Sell
- E-Regular Buy / E-Regular Sell
Alerts
Built-in alerts trigger only at candle close:
* R Buy EG
* R Sell EG
* ER Buy EG
* ER Sell EG
Each alert includes price and time in the message.
Key settings
* Candle Length: Scans last N closed candles (running candle excluded).
* On/Off toggles: Enable/disable each engulfing type and labels individually.
* Text Offset (%): Controls label distance from the box.
Non-repainting confirmation
All signals and alerts are calculated using confirmed bars only.
No running-bar signals → no repainting.
Best use
Works on any market and timeframe. For higher reliability, combine with:
* Key S/R zones
* Trend direction
* Volume or structure confirmation
Disclaimer:
This indicator is a pattern-detection tool, not financial advice. Trading involves risk; always use proper risk management and confirm signals with your own analysis.
Creator: RWBTradeLab
If you find this useful, please leave a like ⭐ and share your feedback.

Engulfing Failure & Overlap Zones [HASIB]🧭 Overview
Engulfing Failure & Overlap Zones is a smart price action–based indicator that detects failed engulfing patterns and overlapping zones where potential liquidity traps or reversal setups often occur.
It’s designed to visually highlight both bullish and bearish failed engulfing areas with clean labels and zone markings, making it ideal for traders who follow Smart Money Concepts (SMC) or price action–driven trading.
⚙️ Core Concept
Engulfing patterns are powerful reversal signals — but not all of them succeed.
This indicator identifies:
When a Buy Engulfing setup fails and overlaps with a Sell Engulfing zone, and
When a Sell Engulfing setup fails and overlaps with a Buy Engulfing zone.
These overlapping areas often represent liquidity grab zones, reversal points, or Smart Money manipulation levels.
🎯 Key Features
✅ Detects both Buy and Sell Engulfing Failures
✅ Highlights Overlapping (OL) zones with colored rectangles
✅ Marks Buy EG OL / Sell EG OL labels automatically
✅ Fully customizable visuals — colors, padding, and zone styles
✅ Optimized for both scalping and swing trading
✅ Works on any timeframe and any instrument
⚡ How It Helps
Identify liquidity traps before reversals happen
Visually see Smart Money overlap zones between opposing engulfing structures
Strengthen your entry timing and confirmation zones
Combine with your own SMC or ICT-based trading setups for higher accuracy
📊 Recommended Use
Use on higher timeframes (e.g., M15, H1, H4) to confirm major liquidity zones.
Use on lower timeframes (e.g., M1–M5) for precision entries inside the detected zones.
Combine with tools like Order Blocks, Break of Structure (BOS), or Fair Value Gaps (FVG).
🧠 Pro Tip
When a failed engulfing overlaps with an opposite engulfing zone, it often signals market maker intent to reverse price direction after liquidity has been taken. Watch these zones closely for strong reaction candles.
Engulfing Detector [HASIB]Description:
Engulfing Detector is a clean and powerful candlestick pattern indicator designed to automatically detect Bullish and Bearish Engulfing setups on any chart and any timeframe.
This tool helps traders easily spot reversal zones and potential trend continuation entries by highlighting high-probability engulfing candles with clear visual signals.
🔹 Features:
Detects both Bullish and Bearish Engulfing patterns in real time
Works on all timeframes and all assets (Forex, Crypto, Stocks, Indices)
Customizable color alerts for bullish and bearish signals
Lightweight, fast, and optimized for smooth performance
Perfect for price action traders and candlestick strategy lovers
📈 Created with precision and simplicity by Hasib, for traders who love clarity and confidence in their charts.
Intraday Buy/Sell/Average Zones by Chaitu50cIntraday Buy/Sell/Average Zones by chaitu50c
Timeframe:
Tested on the 5-minute chart.
Recommended timeframe: 5-minute
What it does
This indicator marks intraday Buy (green) and Sell (red) zones made by strong close-confirmed breakouts. These zones act as support/resistance. If price later closes through a zone, the zone changes color from that bar forward (support ↔ resistance). It can flip more than once.
How zones form
Single breakout: an opposite-type candle closes beyond the previous candle’s high/low.
Double breakout: a base candle, then two opposite-type candles, and the second one closes beyond the base high/low.
Zone size
Buy zone: from the combo lowest low up to the nearest open/close of the combo.
Sell zone: from the combo highest high down to the nearest open/close of the combo.
Color shift (optional)
If price closes through a zone, it flips color at that bar and behaves as the other side (support ↔ resistance). Flips can happen again later.
Overlap control
When a new zone overlaps an existing same-color zone in the same session, choose:
Merge (combine), or
Suppress (ignore the new one).
Flipped zones use their current color for this.
Right edge & session
All zones extend to the right (your offset). Detection is limited to your chosen session, and you can show only the last N sessions.
---
How to trade (simple)
A) Initial breakout trade
When a new zone forms, that breakout itself can be a trade idea in the breakout direction, The stoploss will be the zone.
B) Zone breakout trade (flip)
If price later closes out of a zone and it changes color, that breakout is another trade opportunity in the new direction.
C) Retrace & average trade
When price retests a zone, wait for a confirmation candle in the zone’s favor
— bullish close for a green zone, bearish close for a red zone — then average entries inside/near the zone.
Place stops just beyond the opposite edge of the zone.
If the zone flips color, stop averaging; bias changed.
---
Key settings
Breakout type: Single and/or Double
Confirm on Close: strict mode (no intrabar preview) or allow intrabar preview that auto-removes if fail
Color Shift on Breaks: on/off
Same-Type Overlap: Merge/Suppress
Session, Sessions to Display, Right Offset, Colors, Max Zones
Reminder: Best results on the 5-minute timeframe (tested and recommended).

Engulfing Pro v1Engulfing Pro v1 — Pro Inside (C2-in-wick) signals
Engulfing Pro v1 finds a precise three-bar sequence designed to catch clean continuations or turns after an impulsive move. The signal—called Pro Inside—fires when price closes back inside the wick of a prior engulfing bar, often indicating a controlled pullback into freshly swept liquidity.
What it detects
Engulfing pre-condition (Bars -2 → -1):
A strict bullish or bearish body engulfing occurs one bar before the signal (larger body, full body containment).
Pro Inside signal (Bar 0 / C2):
The current bar (C2) closes inside the wick of the engulfing bar (C1):
Bullish: C2 closes inside C1’s upper wick
Bearish: C2 closes inside C1’s lower wick
Optional C3 confirmation (info only):
The next bar closes beyond C2’s extreme (above for bullish, below for bearish).
Why it matters
The “close-inside-wick” structure frequently marks a measured pullback after momentum just flipped (engulfing), offering a clear, rules-based entry with defined invalidation.
Inputs
Show Pro Inside (Bullish) — toggle bullish signals
Show Pro Inside (Bearish) — toggle bearish signals
Change bar color on signal (C2) — color C2 (lime/red)
Plot markers — C2 triangles and ✔ on C3 confirmations
Boundary padding (ticks) — nudge wick bounds to reduce marginal touches
Visuals & Alerts
Markers:
“C2” triangle up/down on qualifying bars
“✔” circle on C3 confirmations
Alert names:
Pro Inside (Bullish)
Pro Inside (Bearish)
Pro Inside — Bullish C3 confirmation
Pro Inside — Bearish C3 confirmation
How to use (ideas, not advice)
Entry: Aggressive at/after C2 close; conservative on C3 confirmation.
Stops: Common placements beyond the opposite side of C2, or beyond C1’s wick.
Confluence: Pair with market structure, higher-timeframe bias, or Supply & Demand zones for selectivity.
Timeframes/markets: Works on any symbol/TF; adapt padding for volatility.
Notes
Evaluates on bar close (no look-ahead).
Visual/alert tool for study and workflow—not financial advice.
Always forward-test and risk-manage appropriately.

DTLLC Time & PriceDTLLC Time and Price with Signals
This indicator is built for traders who understand ICT concepts and want a structured, visual way to align time-based price action with key market levels. By combining customizable trading windows, breakout logic, and daily reference points, it helps you identify high-probability trade opportunities while filtering out market noise.
Key Features
1. Dual Custom Time Ranges (Kill Zones)
Set two independent time ranges per day (start/end hour and minute).
Each range identifies the highest high and lowest low within its window.
Built-in breakout detection generates buy/sell signals when price moves beyond these levels.
2. Volatility Filtering
Adjustable volatility threshold based on True Range relative to ATR.
Filters out low-quality signals during choppy, low-volatility conditions.
3. ATR-Based Stop Loss
Custom ATR length and stop-loss multiplier settings.
Automatically plots ATR-based stop levels for triggered trades.
4. Daily Key Levels
Plots Previous Day High, Previous Day Low, and Midnight Open continuously on the chart.
Useful for spotting breakout and reversal opportunities in line with ICT market structure concepts.
5. Liquidity & Engulfing Candle Highlights
Highlights potential liquidity grab zones (yellow candles) when significant highs/lows are set within your lookback period.
Detects bullish (green) and bearish (red) engulfing patterns for added confluence.
6. Visual & Signal Tools
Buy/Sell signals plotted directly on chart (separate colors for Range 1 and Range 2). Continuous plotting of reference levels to maintain market context throughout the session.
Example Use Case:
A common ICT-inspired reversal setup:
Wait for price to sweep the Previous Day’s High or Low during your chosen time range.
Look for a buy or sell signal with volatility confirmation.
Manage risk using the ATR-based stop-loss plot.
Disclaimer: This script is for educational purposes only and is not financial advice. Trade responsibly and always test strategies before applying them in live markets.

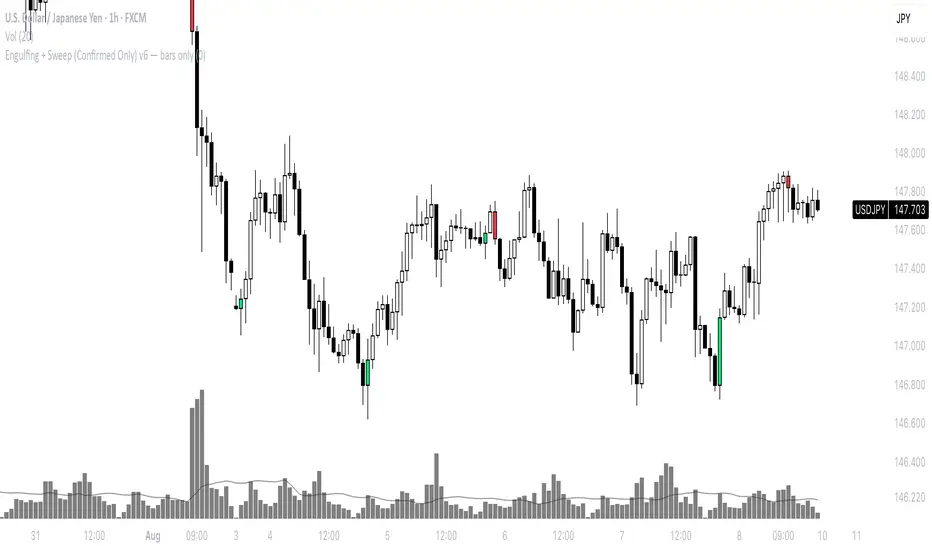
Engulfing + Sweep (Confirmed Only) v6 — bars onlyMarks bullish/bearish engulfing candles with liquidity sweeps and confirms them on the next candle — no repaint.
✳️ Features:
• 🟩 Bullish Engulfing + Low Sweep
• 🟥 Bearish Engulfing + High Sweep
• 🎛 Require opposite-color previous candle (optional)
• 📏 Min body-to-range filter
• 🔔 Alerts on confirmation candle
🎯 Best for:
• Price action & reversal traders
• Liquidity sweep confluence setups
Candlestick Suite–(Phoenix) it colors the major Reversal candlesticks
BullEngulf or BearEngulf or Engulfing() -> DARK_ORANGE
PiercingLine or DarkCloudCover -> CYAN
BullishHarami or BearishHarami -> YELLOW
BullishInsideBar or BearishInsideBar -> WHITE

Engulfing DashboardThis is an indicator that detects candles based on the **Engulfing system** I’ve studied — from **wick to wick**.
It determines whether it’s a Buy or Sell based on the **opening price** and how the candle moves.
Anyone familiar with the Engulfing system will know how to use it.
It’s especially useful for people who use only **one screen** and can’t constantly monitor multiple timeframes.
And don’t forget:
**Trend is your friend.**
Engulfing DashboardThis is an indicator that detects candles based on the **Engulfing system** I’ve studied from **wick to wick**.
It determines whether it’s a Buy or Sell based on the **opening price** and how the candle moves.
Anyone familiar with the Engulfing system will know how to use it.
It’s especially useful for people who use only **one screen** and can’t constantly monitor multiple timeframes.
And don’t forget:
**Trend is your friend.**

Bullish & Bearish Wick MarkerMarks bullish and bearish engulfing candles
Bullish engulfing candle:
when the low is lower than the previous candle low and the body close is higher than the previous candle body
Bearish engulfing cande:
when the high is higher than the previous candle high and the body close is lower than the previous candle body

IL - Bull and Bear Engulfing Detector - v01Description:
This indicator is designed to identify and highlight Bullish and Bearish Engulfing
candlestick patterns on your chart. It offers a high degree of customization
through different engulfing definitions and an optional strictness filter, allowing
traders to tailor the detection to their specific criteria for these common reversal signals.
Features:
- Universal Detection: Identifies both Bullish Engulfing and Bearish Engulfing patterns.
- Configurable Engulfing Modes (via "Engulfing Definition Type" input):
1. "Body (O/C)": Traditional - current body engulfs previous body.
2. "Range (H/L)": Current H/L range engulfs previous H/L range.
3. "Body & Range (Super)": Requires BOTH "Body (O/C)" AND "Range (H/L)" conditions.
- Optional "Larger Body" Filter: Engulfing body must be strictly larger.
- Display Toggles: Options to show/hide Bullish and/or Bearish pattern signals.
- Customizable Colors: Bar colors for bullish/bearish patterns are user-configurable.
- Data Logging: Option to log detected pattern details to the Pine Logs.
- Visual Signals: Patterns marked with plot shapes and optional bar coloring.
How to Use & Interpret:
- Configure "Engulfing Definition Type", "Require Larger Engulfing Body?", display toggles,
and colors in the indicator settings.
- Enable "Log Detected Pattern Examples?" in "Debug Options" to capture data.
- BE = Bullish Engulfing (green triangle below bar). BRE = Bearish Engulfing (red triangle above).
- Use with other analysis methods for confirmation.
Disclaimer: Trading involves substantial risk of loss and is not suitable for all investors.
Past performance is not indicative of future results.

Candle Reversal Matrix TFFCandle Reversal Matrix TFF
This "Engulfing + Shooting Star + Evening Star + Hanging Man + Dark Cloud Cover" indicator is a comprehensive candlestick pattern scanner designed to identify key bearish and bullish reversal signals on your TradingView charts.
Key Features:
Bullish Engulfing: Detects strong bullish reversals where a green candle fully engulfs the previous red candle, signaling potential upward momentum.
Bearish Engulfing: Flags bearish reversals where a red candle engulfs the prior green candle, indicating possible downtrend beginnings.
Shooting Star: Identifies candles with a small body near the low and a long upper wick, commonly marking a bearish reversal after an uptrend.
Evening Star: Detects a three-candle bearish reversal pattern characterized by a large green candle, followed by a small indecisive candle, and a strong red candle closing well into the first candle’s body.
Hanging Man: Spots small-bodied candles with long lower shadows after an uptrend, warning of potential bearish reversals.
Dark Cloud Cover: Recognizes a two-candle bearish reversal where a red candle gaps above and closes below the midpoint of the previous green candle.
Visual Cues:
Each pattern is marked on the chart with distinct colored shapes and labels for easy identification:
Green arrows and labels for bullish signals
Red, orange, purple, yellow, and maroon shapes for bearish patterns, each with unique symbols (↓, ☆, EV, HM, DC)

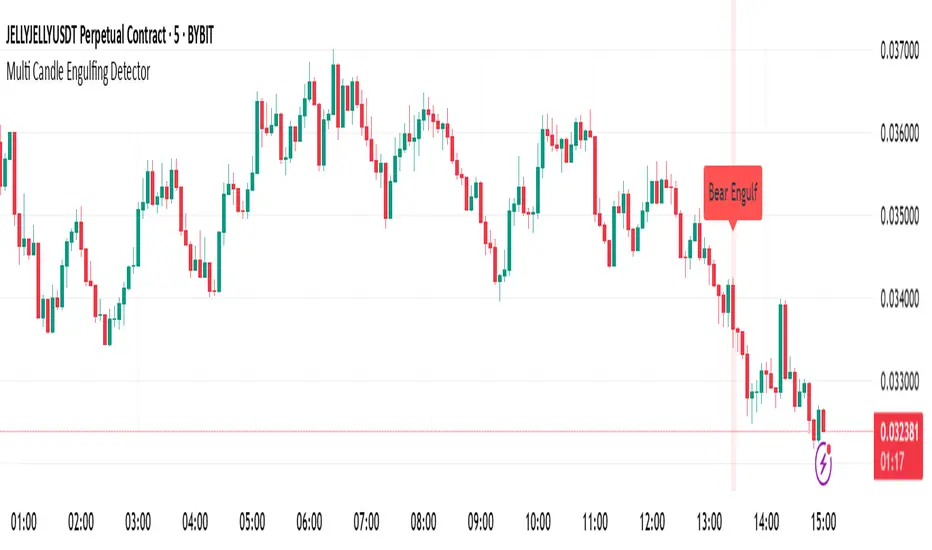
Multi Candle Engulfing Detector🔍 Multi Candle Engulfing Detector
This indicator identifies powerful engulfing candles that consume three or more previous candles — a signal often tied to strong market reversals or continuation moves.
🧠 Features
Detects candles that fully engulf the previous 3 or more candles
Optional filtering: only trigger when the engulfed candles are of the opposite color
Customizable engulf count for greater pattern control
Clear bullish and bearish signal labels on the chart
Alerts integrated: get notified the moment a setup forms
Background highlighting for enhanced visibility
⚙️ Settings
Minimum Number of Candles to Engulf: Default is 3, but can be adjusted
Require Opposite Color: When enabled, the engulfing candle must be opposite in color to the engulfed ones (e.g., green engulfing red)
📈 Use Cases
Spot strong reversal signals at tops and bottoms
Confirm breakout momentum on trend continuation
Use in confluence with other tools like volume or support/resistance
🚨 Alerts
Alerts fire when a bullish or bearish engulfing pattern is detected, allowing for mobile, email, or webhook notifications.
✅ Notes
This script is fully customizable and can be extended into a strategy or scanning tool. Feedback and suggestions are always welcome!
Engulfing Candle with Streaks and CountIdentifies Engulfing Candles + The Number of Consecutive Signals + Identifies 3rd/4th Consecutive Signals + Keeps Count of Most Recent Number of Signals as Decided by User.
- Have coded in the latest version 6
- This script allows the tracking of engulfing candles over a user defined amount of time (candles).
- The script will signal every engulfing candle and its consecutive corresponding number across the entire chart.
- The Engulfing Count box in the bottom right counts how many bullish and bearish engulfing candles have occurred over the number decided by the user.
- The Engulfing Signal that prints is triggered when an opposite next candle prints and the body is over 100% larger than the previous candle. It does not need to "fully engulf" the previous candle, the coding has an allowance for an "equal to and greater/smaller than" the previous close price. This allows for signals were the open of the engulfing candle can be equal to the close of the previous opposite, however the engulfing still must reach an over 100% sizing of the previous to print a signal.
- Where a piercing candle occurs and the open price is within the body of the previous candle, this will void the equation and no matter how big the candle is, it will not trigger an engulfing signal as I was only looking for true engulfing candles.
- The script keeps count of the same consecutive signals no matter the timeframe.
- It will print the consecutive number above or below the signal (depending if bullish or bearish).
- To assist with trend identification the 3rd consecutive signal will print blue, and the 4th consecutive signal will print yellow (or I prefer to use the term "Gold"). This can help filter out the noise on lower timeframes to assist to see where the momentum is going, or if there are signals going against the trend to try trick traders.
- Back testing I found the 3rd and 4th signals are uncommon on higher timeframes and tend to act as fake-outs before the trend reverses.
- Overall a good tool to add to your trend analysis, either for additional confluence or to assist with reversal identification.
- Colors are set as default, but everything can be changed by the user as I didn't want to limit its possibilities.
*** Please note that this script does not take into any consideration candle wicks. Although it can be used with Heikin Ashi it is somewhat unreliable. This indicator is designed to be used with standard candles only ***

Bullish & Bearish Engulfing ProHello Traders!
Overview
The Bullish & Bearish Engulfing Pro indicator is a powerful pattern recognition tool that identifies key reversal points and trend continuation opportunities. These engulfing patterns often mark the beginning of a significant price move and are widely used in technical analysis. For example, in an uptrend, a Bullish Engulfing pattern can provide an ideal pullback entry signal.
This indicator combines traditional candlestick theory with advanced technical filters like trend direction and volatility analysis to offer traders precise, high-confidence signals.
Key Features :
Accurate pattern detection:
Uses refined algorithms to detect true Bullish and Bearish Engulfing patterns, filtering out noise and false positives.
Trend filter:
Customizable Simple Moving Average (SMA) ensures trades are aligned with the market’s broader trend, improving trade success rates.
Volatility awareness:
ATR-based filtering ensures that only statistically significant engulfing patterns are highlighted.
Visual clarity:
Bullish and Bearish Engulfing patterns are displayed with distinct, customizable colors and labels for instant recognition.
Flexible customization:
Users can adjust detection criteria, SMA settings, and visual options to suit their personal strategy.
Filtered signal display:
Option to visualize filtered-out signals to better understand how the logic makes its decisions.
Bullish Engulfing Pattern
Appears after a downtrend or during a pullback in an uptrend
Consists of two candles
A smaller bearish candle
Followed by a larger bullish candle that completely engulfs the previous body
Bearish Engulfing Pattern
Appears after an uptrend or during a pullback in a downtrend
Consists of two candles
A smaller bullish candle
Followed by a larger bearish candle that completely engulfs the previous body
Key differences in this implementation
What makes this indicator unique
Trend and volatility filters
Ensure patterns occur in meaningful market conditions
Comprehensive pattern analysis:
Factors in candle body ratios, wick sizes, and relative size to past candles for smarter detection
Adaptive to market conditions:
Dynamic thresholds based on ATR allow pattern recognition to adjust to different volatility regimes
Educational value:
Visualizing rejected patterns helps traders build intuition and refine their discretion
How to Trade with this Indicator
Engulfing patterns can signal strong reversals or pullback continuations. Use them with trend and volume confirmation to maximize their effectiveness.
snapshot
Bullish Opportunities:
Look for Bullish Engulfing patterns (aqua-colored candles and labels) during or after a pullback in an uptrend.
Bearish Opportunities:
Watch for Bearish Engulfing patterns (orange-colored candles and labels) during or after a rally in a downtrend.
Entry: Enter on the next bar open after the engulfing candle completes.
Stop loss: 2 ticks below/above the engulfing candle’s low/high.
Take profit: Aim for at least a 2R target, a swing high/low or manage the tradewith a trailing stop.
Trend Alignment:
For higher win probability, take trades only in the direction of the SMA-defined trend.
Note: To ensure the candle coloring appears correctly, place the indicator at the top of the object tree.
