Profitability Visualization with Bid-Ask Spread ApproximationOverview
The " Profitability Visualization with Bid-Ask Spread Approximation " indicator is designed to assist traders in assessing potential profit and loss targets in relation to the current market price or a simulated entry price. It provides flexibility by allowing users to choose between two methods for calculating the offset from the current price:
Bid-Ask Spread Approximation: The indicator attempts to estimate the bid-ask spread by using the highest (high) and lowest (low) prices within a given period (typically the current bar or a user-defined timeframe) as proxies for the ask and bid prices, respectively. This method provides a dynamic offset that adapts to market volatility.
Percentage Offset: Alternatively, users can specify a fixed percentage offset from the current price. This method offers a consistent offset regardless of market conditions.
Key Features
Dual Offset Calculation Methods: Choose between a dynamic bid-ask spread approximation or a fixed percentage offset to tailor the indicator to your trading style and market analysis.
Entry Price Consideration: The indicator can simulate an entry price at the beginning of each trading session (or the first bar on the chart if no sessions are defined). This feature enables a more realistic visualization of potential profit and loss levels based on a hypothetical entry point.
Profit and Loss Targets: When the entry price consideration is enabled, the indicator plots profit target (green) and loss target (red) lines. These lines represent the price levels at which a trade entered at the simulated entry price would achieve a profit or incur a loss equivalent to the calculated offset amount.
Offset Visualization: Regardless of whether the entry price is considered, the indicator always displays upper (aqua) and lower (fuchsia) offset lines. These lines represent the calculated offset levels based on the chosen method (bid-ask approximation or percentage offset).
Customization: Users can adjust the percentage offset, toggle the bid-ask approximation and entry price consideration, and customize the appearance of the lines through the indicator's settings.
Inputs
useBidAskApproximation A boolean (checkbox) input that determines whether to use the bid-ask spread approximation (true) or the percentage offset (false). Default is false.
percentageOffset A float input that allows users to specify the percentage offset to be used when useBidAskApproximation is false. The default value is 0.63.
considerEntryPrice A boolean input that enables the consideration of a simulated entry price for calculating and displaying profit and loss targets. Default is true.
Calculations
Bid-Ask Approximation (if enabled): bidApprox = request.security(syminfo.tickerid, timeframe.period, low) Approximates the bid price using the lowest price (low) of the current period. askApprox = request.security(syminfo.tickerid, timeframe.period, high) Approximates the ask price using the highest price (high) of the current period. spreadApprox = askApprox - bidApprox Calculates the approximate spread.
Offset Amount: offsetAmount = useBidAskApproximation ? spreadApprox / 2 : close * (percentageOffset / 100) Determines the offset amount based on the selected method. If useBidAskApproximation is true, the offset is half of the approximated spread; otherwise, it's the current closing price (close) multiplied by the percentageOffset.
Entry Price (if enabled): var entryPrice = 0.0 Initializes a variable to store the entry price. if considerEntryPrice Checks if entry price consideration is enabled. if barstate.isnew Checks if the current bar is the first bar of a new session. entryPrice := close Sets the entryPrice to the closing price of the first bar of the session.
Profit and Loss Targets (if entry price is considered): profitTarget = entryPrice + offsetAmount Calculates the profit target price level. lossTarget = entryPrice - offsetAmount Calculates the loss target price level.
Plotting
Profit Target Line: Plotted in green (color.green) with a dashed line style (plot.style_linebr) and increased linewidth (linewidth=2) when considerEntryPrice is true.
Loss Target Line: Plotted in red (color.red) with a dashed line style (plot.style_linebr) and increased linewidth (linewidth=2) when considerEntryPrice is true.
Upper Offset Line: Always plotted in aqua (color.aqua) to show the offset level above the current price.
Lower Offset Line: Always plotted in fuchsia (color.fuchsia) to show the offset level below the current price.
Limitations
Approximation: The bid-ask spread approximation is based on high and low prices and may not perfectly reflect the actual bid-ask spread of a specific broker, especially during periods of high volatility or low liquidity.
Simplified Entry: The entry price simulation is basic and assumes entry at the beginning of each session. It does not account for specific entry signals or order types.
No Order Execution: This indicator is purely for visualization and does not execute any trades.
Data Discrepancies: The high and low values used for approximation might not always align with real-time bid and ask prices due to differences in data aggregation and timing between TradingView and various brokers.
Disclaimer
This indicator is for educational and informational purposes only and should not be considered financial advice. Trading involves substantial risk, and past performance is not indicative of future results. Always conduct thorough research and consider your own risk tolerance before making any trading decisions. It is recommended to combine this indicator with other technical analysis tools and a well-defined trading strategy.
Entryprice

Profit & Risk CalculatorThe "Profit & Risk Calculator" script in Pine Script (TradingView) is designed to help users calculate potential profit and risk when trading, and to provide alerts when specific price levels are reached (such as entry price, take profit, or stop loss). It includes several components as described below:
1. Input Fields:
The user can manually input various prices: entry price, stop loss price, and take profit price, with steps of 0.25.
There is also an option to input a custom value (e.g., for personal lot sizing) and a total investment amount.
2. Dynamic Lines:
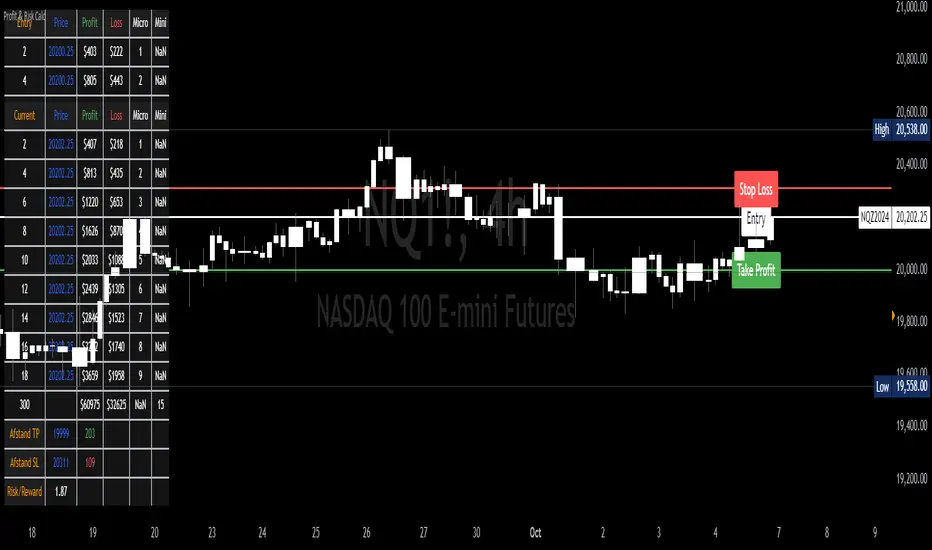
The script draws dynamic horizontal lines for the input prices: entry line (white), stop loss line (red), and take profit line (green).
These lines are automatically updated based on the entered price levels.
3. Labels for the Lines:
Labels are added to the lines to visually indicate the entry, stop loss, and take profit levels on the chart.
4. Long and Short Position Calculations:
The script calculates potential profit and loss for both long (profit if the price goes up) and short (profit if the price goes down) positions.
It also calculates the distance between entry and take profit, and distance between entry and stop loss, along with the risk/reward ratio (RR).
5. Alerts:
The script generates alerts when one of the following conditions is met:
Entry Condition: The price touches or exceeds the entry price (high >= entryPrice).
Stop Loss Condition: The price touches or drops below the stop loss price (low <= stopLossPrice).
Take Profit Condition: The price touches or exceeds the take profit price (high >= takeProfitPrice).
6. Lot Calculations:
The script calculates both micro and mini lot sizes based on a preset table and the custom value.
The results are displayed in a table on the chart.
7. Profit/Risk Table:
The script shows two tables:
One table calculates the profit, loss, and risk/reward ratio based on the input entry price.
A second table shows the same calculations based on the current price.
8. Chart Display:
The script places tables and other visual data on the chart, such as preset values, profit and loss calculations, and the distance from take profit and stop loss to the entry price.
English Explanation of Each Part of the Script
1. Input Fields
The script starts with several input fields where the user can specify the entry price, stop loss price, take profit price, custom value, and investment amount. These values help define the parameters for risk/reward calculations.
2. Dynamic Horizontal Lines
Three horizontal lines are drawn on the chart, representing the entry price, stop loss price, and take profit price. These lines update dynamically based on user input.
3. Dynamic Line Updates
As the user adjusts their inputs, the position of the lines is updated in real-time to match the new price levels. This keeps the chart visually accurate.
4. Labels for Lines
Labels are placed on the chart next to each price line, allowing the user to clearly see which line represents which price level.
5. Long and Short Position Calculations
The script calculates the potential profit or loss for both long (prices go up) and short (prices go down) positions, providing users with an idea of their potential gains or losses.
6. **6. Risk/Reward Ratio Calculation
This calculates the Risk/Reward Ratio (RR) by dividing the distance between the take profit and entry price by the distance between the entry and stop loss price. This gives the trader an idea of how much risk they're taking relative to the potential reward.
7. Alert Conditions
The alert conditions are defined based on the price hitting the set levels:
Entry Condition: If the price goes up and touches the entry level, the alert is triggered.
Stop Loss Condition: If the price drops and hits the stop loss level, the alert is triggered.
Take Profit Condition: If the price rises and reaches the take profit level, the alert is triggered.
8. Alert Configuration
Each condition is linked to an alert that sends a message when the specific price level is touched. The alerts notify the user when the entry, stop loss, or take profit levels are hit.
9. Lot Calculations
The script includes a function that calculates micro and mini lot sizes based on a preset table and a custom value input by the user. This is useful for adjusting lot sizes to the desired amount and determining position sizes for trades.
10. Entry Price-Based Profit & Loss Table
A table is generated on the chart that displays detailed information about the profit, loss, and risk/reward ratio based on the entry price. It helps traders see the potential outcomes for different lot sizes.
11. Current Price-Based Profit & Loss Table
This second table provides similar information as the first but calculates profit, loss, and risk/reward based on the current price. This allows the trader to see how their position performs as the market price changes in real time.