Forex Sessions UTC + customise (DST Support)This Pine Script is designed to highlight forex trading sessions on a TradingView chart, showing which session (Asia, London, New York, Frankfurt, Sydney) is active based on your selected timezone offset and daylight saving time (DST) settings. It also includes an option to highlight session overlaps, like the London-New York and Asia-London overlaps.
Let's break down the script in detail:
### 1. **Inputs**:
* **`timezoneOffset`**:
* This input allows you to select your local timezone offset in hours relative to UTC (e.g., -2 for UTC-2 or +3 for UTC+3). It helps adjust the session times based on your local time.
* **`isDST`**:
* A boolean input that determines if Daylight Saving Time (DST) is active or not. If DST is enabled, the session times will be adjusted by one hour.
### 2. **Function: `timeInDailyRange`**:
This function checks if the current time (bar) is within a given session's start and end time.
* **`startH, startM`**: Start time of the session (hours and minutes).
* **`endH, endM`**: End time of the session (hours and minutes).
* **`tzOffset`**: The timezone offset in hours (which adjusts the start and end times for different regions).
The function handles sessions that cross over midnight. For example, the Asia session starts at 23:00 UTC and ends at 07:00 UTC, so it checks if the current time falls within that period.
### 3. **Session Times (in UTC)**:
Each trading session has specific times defined in UTC:
* **Asia Session**: 23:00 UTC to 07:00 UTC
* **London Session**: 08:00 UTC to 16:00 UTC
* **New York Session**: 13:00 UTC to 21:00 UTC
* **Frankfurt Session**: 07:00 UTC to 15:00 UTC
* **Sydney Session**: 21:00 UTC to 05:00 UTC
These times are defined in 24-hour format, and they represent the opening and closing hours for each market.
The script uses specific colors to represent different sessions:
* **Asia**: Yellow (`asiaColor`)
* **London**: Red (`londonColor`)
* **New York**: Navy Blue (`nyColor`)
* **Frankfurt**: Blue (`frankfurtColor`)
* **Sydney**: Green (`sydneyColor`)
* **Overlaps**:
* London-NY overlap: Purple (`overlapLN`)
* Asia-London overlap: Orange (`overlapAL`)
These colors are used to highlight the background during active sessions.
### 5. **Session Highlighting**:
The script uses the `bgcolor` function to change the background color of the chart when a session is active.
* For each session, it checks whether the current time (bar) falls within the session's time range (adjusted by the `timezoneOffset`).
* If a session is active, it will highlight the chart background in the corresponding session color.
### 6. **Overlaps**:
* **London-NY Overlap**: The script checks if both the London session and the New York session are active at the same time (i.e., if their time ranges overlap). If so, it highlights the overlap area in purple.
* **Asia-London Overlap**: Similarly, the script checks if both the Asia and London sessions are active at the same time, and if so, it highlights the overlap area in orange.
### 7. **Daylight Saving Time (DST) Adjustment**:
* If the **`isDST`** flag is enabled (i.e., DST is active), the script adjusts the session start and end times by adding one hour to each session. This is because during DST, trading hours shift by one hour (usually in regions that observe DST).
* This adjustment is applied to all session times, so the script accounts for the time change and ensures that the session times are correctly displayed.
### 8. **Final Background Color Logic**:
* The `bgcolor` function checks whether each session is active by calling `timeInDailyRange` for each session and then colors the chart accordingly.
* It also checks for overlapping sessions and colors the chart with the appropriate overlap color.
### Example Scenario:
1. **Timezone Offset**: If you select `timezoneOffset = 3` (UTC+3), the session times will be adjusted by adding 3 hours to the start and end times.
2. **Daylight Saving Time (DST)**: If `isDST = true` is selected, the session start times will shift by 1 hour forward (e.g., 23:00 UTC becomes 00:00 UTC for Asia).
3. **Visual Outcome**: The chart will display different colors in the background depending on which trading session is active (e.g., red for London, navy for New York), and purple or orange for overlap sessions.
### Key Features:
* **Customizable Timezone Offset**: Adjust session times to reflect your local timezone.
* **Daylight Saving Time Support**: Automatically adjusts session times during DST.
* **Highlighting Sessions**: Color the chart background to visualize when different trading sessions are active.
* **Overlap Highlighting**: Highlights the periods when certain sessions overlap (London-NY, Asia-London).
In summary, this script is useful for traders who want to visually see when different forex trading sessions are active on the chart, with flexibility for timezone and DST adjustments.
Europesession

Sessions Lite [TradingFinder] New York, London, Asia, NYSE Forex🔵 Introduction
A trading session is one of the basic concepts in the financial market that refers to specific time periods. In fact, a session means hours during the day and night, during which traders in a certain part of the world conduct their transactions.
Although the "Forex" and "CFDs" market is open 24 hours a day and it is possible to trade in it, but in some hours the activity in this market decreases so much that many traders prefer not to trade and only watch the market. On the other hand, there are specific times when the market is very busy and dynamic, and many traders tend to trade during these hours of the day and night.
Trading sessions are usually divided into three main categories, which are "Asian", "European" and "North American" sessions. These trading sessions are also called the "Tokyo", "London" and "New York" sessions, respectively. But they also categorized these sessions in more detailed ways such as "Sydney session", "Shanghai session" or "NYSE session".
🔵 Tokyo trading session (Asian session)
After the weekend that happens on Saturday and Sunday, the Forex market starts with the Asian session. In this continent, most of the transactions are done in the Tokyo session, and for this reason, it is usually called the Asian session or the Tokyo session. However, other countries such as Australia, China and Singapore also do a lot of trading in this session.
The Tokyo session has a lower volume of transactions compared to the London and New York sessions, and therefore the liquidity is lower. In this session, most of the Forex currency pairs move in a price range. For this reason, different people use the ups and downs with the trading strategy in the range and get profit.
The low liquidity of the Tokyo session means that trading spreads are also higher during these hours. Besides, most of the transactions of this session are done in the early hours and at the same time as the planned news release.
In the Tokyo or Asia session, the best currency pairs to trade are the "Japanese yen", the "Australian dollar", and the "New Zealand dollar".
"Nikkei" index is also a good option for trading. If you trade in the Tokyo session, you should also be aware of the release of economic news and data from Australian, New Zealand and Japanese financial institutions.
🔵 London trading session (European session)
After the Asian session, it is time for the European session. In this period of time, transactions are very large and many European markets are involved. However, the European session is usually known as the London session.
Because of its specific time zone, London is not only known as the Forex trading center in Europe, but it is also known as the Forex trading center in the world. The London session overlaps with two other major trading sessions in the world, Asia and America. This means that most of the Forex transactions are done in this session. According to the latest statistics, 32% of Forex transactions are related to the London session, which shows that about a third of the activity performed in Forex takes place during this period.
This will increase the volume of Forex transactions and increase liquidity. An event that causes the spread of transactions to decrease. Of course, high liquidity also leads to greater volatility, which is desirable for many traders.
In the European session, the pound and euro currencies and the "DAX", "FTSE100", and "CAC40" indices are known as the best tradable assets. Also, traders of this session should pay attention to the news and data published by the "European Central Bank" and the "Bank of England". The news of countries like Germany, France and Italy are also very important.
🔵 American trading session (New York session)
When the New York session begins, several hours have passed since the end of the Tokyo session, but the European session is in the middle. In this session, they usually affect the financial activities carried out in America, but they also affect other countries such as Canada, Mexico and several South American countries.
The "US dollar" and stock indices such as "S&P", "Dow Jones" and "Nasdaq" are the most important assets that are traded in this session.
The early hours of the American session have a lot of liquidity and volatility due to the overlap with the European session, but with the end of the European session, the activity in the American session also decreases.
You can trade all major Forex currency pairs in the New York trading session. In this session, the "Federal Reserve", as the most important central bank in the world, is the institution that you should pay attention to its news and data.
The trading session indicator is an analytical tool in the financial markets that is used to display and analyze specific trading periods during a day. These indicators are generally useful for determining support and resistance levels during any trading session and for detecting different trading patterns.
For example, usually these indicators display the open and close price levels, the highest and lowest prices during a trading session. Also, you may notice various price patterns such as price channels, price phase phases and market trend changes during different trading sessions using these indicators.
🔵 cause of construction
In particular, the session light indicator version is designed and built for those traders who use many different tools on their chart at the same time. These traders can include "Volume Traders", "ICT traders", "Day Traders" and... These individuals can use "Session Lite" without disturbing the display of their other trading tools such as "Order Blocks", "Liquidity", "Zigzag", "FVG" etc.
But in general, there are several reasons for making tools like trading session indicators in financial markets, some of which include the following :
1. Analysis of specific time frames : Some traders and investors like to consider specific time frames for price analysis and review. For example, analyzing price changes during each trading session can help analyze trading patterns and identify trading opportunities.
2. Recognize different price patterns : Different price patterns may be observed during trading sessions. Trading session indicators can help to make better trading decisions by analyzing these patterns and their strengths and weaknesses.
3. Identifying Support and Resistance Levels : These tools may help to identify support and resistance levels during any trading session which can be helpful in deciding whether to enter or exit the market.
🔵 How to use
The Session Lite indicator displays 8 sessions by default. Asia session, Sydney session, Tokyo session, Shanghai session, Europe session, London session, New York session and New York Stock Exchange (NYSE) session are the sessions that are displayed.
You can activate or deactivate the display of each session by using the tick button next to the name of each session.
Two gray vertical dashes are also displayed by default, which indicate the beginning of the European session and the New York session. This feature is available for all sessions, but it is enabled by default only for these two sessions, and you can activate it for the rest of the session. You can enable or disable the display of this line by using the Start Session tick key.
Likewise, the information table is displayed by default, which includes the open or closed information of each session and the start and end times of each session. These timings are based on the UTC time zone.
Accordingly, the schedule of trading sessions is as follows :
Asia session from 23:00 to 06:00
Sydney session from 23:00 to 05:00
Tokyo session from 00:00 to 00:06
Shanghai session from 01:30 to 06:57
European session from 07:00 to 16:30
London session from 08:00 to 16:30
New York session from 13:00 to 22:00
New York Stock Exchange (NYSE) session from 14:30 to T 22:00
Important note : the beginning of the European session coincides with the opening of the Frankfurt market.
🔵 Settings
• In the settings section, there are customization capabilities according to the type of use of each user. The settings related to showing or not showing the box of each session, the start indicator of each session, setting the start and end time of the session and choosing the desired color to display each session are among the things that can be set from this section.
• At the end of the settings, you will see the "Info Table" option; By disabling this option, the "sessions" clock table displayed on the upper right side will be disabled.

CRYPTO MARKET SESSION ANALYZER INDICATORCrypto Market Session Analyzer is an easy-to-use yet powerful analysis tool that helps the trader visualize and analyze price movements over three different trading sessions:
1) European Session
2) US session
3) Asian session
Automatically tracks the corresponding levels for each market session.
This indicator can be used on all timeframes equal to or less than 15 minutes.
Although this is a simple indicator to use, some care must be taken when using it. The trader must be careful to set the correct times for each session according to his UTC timezone. By default the indicator uses UTC. If your console is set to UTC + 2 for example, you will need to take this into account and align the times correctly. You can adjust the time for each session from the user interface. Following the example, if the opening of the UE session is set to 9 and UTC of your console is set to UTC + 2, the script will proceed to create the level at opening time 11.
HOW IT WORK
The indicator automatically draws a horizontal line at the open and a horizontal line at the close of each session. The indicator clears past support and resistance every 24 hours to provide a clean and easy-to-read chart, updating new levels session after session.
Blue indicates the EU session.
Orange indicates the US session.
Purple indicates the Asian session.

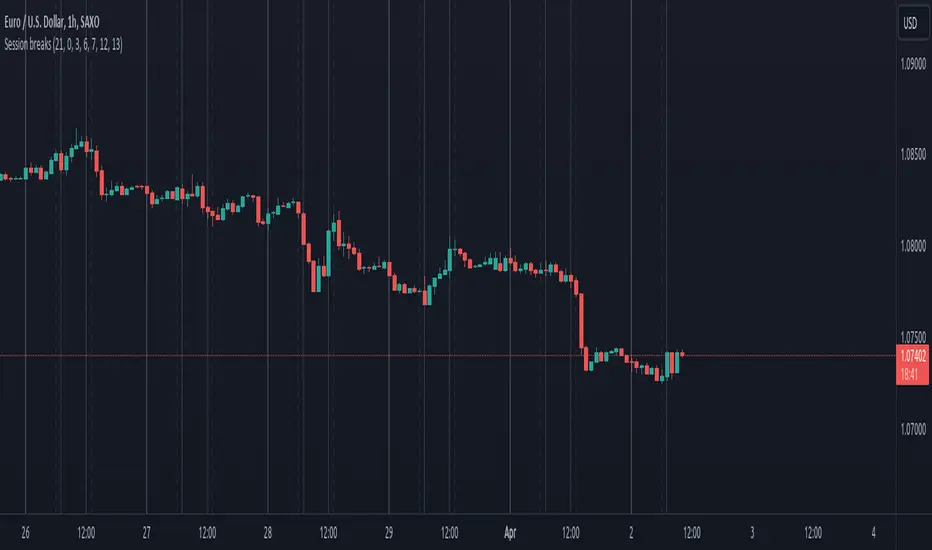
Session breaksThis indicator marks the start of each trading session around the world, starting with Tokyo at 0am UTC, London at 7am UTC, NY at 12pm and Sydney at 9pm, is non-intrusive (light gray vertical lines) and works with both UTC and exchanges' local time and handles DST / timezone offsets as well.
You can easily see that sometimes it acts as pivot-point especially on high volume.
And last, it is supposed to replace the "Session breaks" option that you can find in "Settings - Appearance" that only displays the end of session for the current exchange.