BullDozz Fibo ZigZagFibo ZigZag - Advanced Fibonacci Retracement Tool 🔥
📌 Overview
The Fibo ZigZag indicator is a powerful tool for trend structure analysis using the ZigZag pattern and Fibonacci retracement levels. It automatically identifies swing highs & lows, draws ZigZag lines, and overlays Fibonacci levels with price labels at the right end for better readability.
This indicator is designed for traders who use price action, trend reversal strategies, and support/resistance analysis.
🛠 Features
✅ Automatic ZigZag detection with customizable depth, deviation, and backstep
✅ Fibonacci retracement levels (0%, 23.6%, 38.2%, 50%, 61.8%, 100%, 161.8%, 261.8%, 423.6%)
✅ Price labels at Fibonacci levels (placed at the right end of the levels)
✅ Alerts for new swing highs & lows
✅ Customizable line colors, text colors, and label sizes
✅ Lightweight and optimized for fast performance
📊 How It Works
1️⃣ The script detects ZigZag structure points based on price swings
2️⃣ It connects recent highs & lows with a ZigZag line
3️⃣ Fibonacci retracement levels are calculated and drawn between the last two significant swing points
4️⃣ Each Fibo level is labeled with its percentage & exact price, placed at the right end for clarity
5️⃣ Alerts trigger automatically when a new swing high or low is detected
⚙ Customization Options
🔹 ZigZag Settings: Adjust Depth, Deviation, BackStep, and Leg length
🔹 Fibonacci Levels: Modify line colors, label text colors, and visibility
🔹 Alerts: Enable/disable trend change alerts
📈 Best Use Cases
🚀 Identifying Trend Reversals – Detect key turning points using Fibonacci levels
📉 Support & Resistance Trading – Use retracement levels as entry/exit points
📊 Swing Trading & Scalping – Combine ZigZag with price action for effective strategies
🔔 Alert-Based Trading – Get notified when new swing highs/lows form
🚀 How to Use
📌 Add the indicator to your chart
📌 Adjust the settings to match your trading strategy
📌 Use the Fibonacci levels & ZigZag lines to analyze trend direction & key price zones
📌 Wait for alerts or manually enter trades based on price reaction to Fibo levels
📢 Final Thoughts
The Fibo ZigZag is an essential tool for traders who rely on price action, trend reversals, and Fibonacci levels. Whether you're a beginner or a pro, this indicator helps you spot high-probability trading opportunities with ease.
⚡ Try it now & enhance your trading strategy! 🚀
💬 Let us know your feedback & suggestions in the comments! Happy trading! 📊🔥
Fibbonachi

Horizontal Lines 0.5, BY ROSHAN SINGHThis indicator identify support and resistance to trade in 1min time frame, based of fib 0.5 level, on 15 min time frame find major high and low means major swing, low will be our start level and high will be our end level input in setting, substract high and end level and now divide answer with 2 till the daily volatility of a index or stock, if saying about nifty suppose nifty daily travel minimum for 65 pts then interval will be 65 input in settings, now all horizontals lines means support and level will be plotted on chart, buy on support, sell on resistance

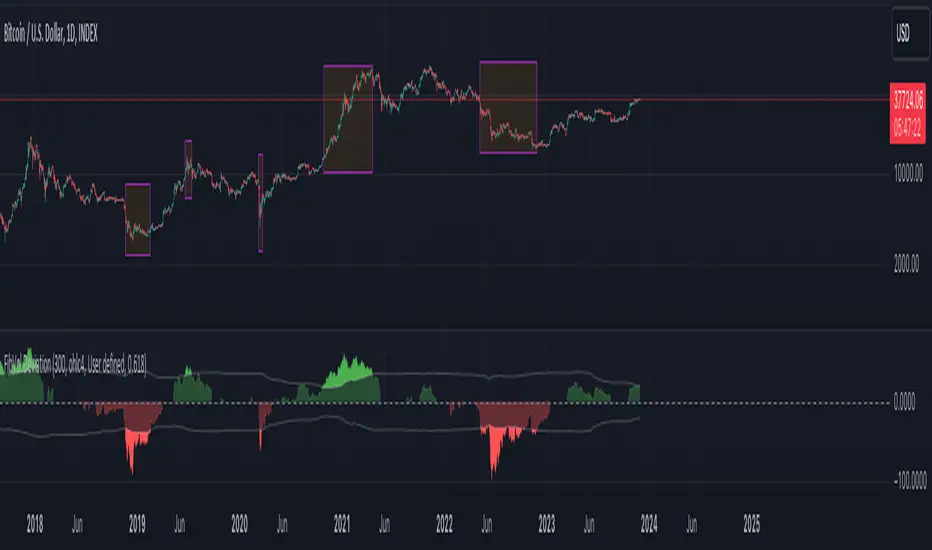
Fibonacci Bollinger Volume Weighted DeviationDiscover market dynamics with the 'Fibonacci Bollinger Volume Weighted Deviation' indicator – a unique tool blending Fibonacci ratios, Bollinger Bands, and volume-weighted analysis. Ideal for spotting overbought/oversold conditions and potential market turnarounds, this indicator is a must-have for traders seeking nuanced insights into price behavior and volatility.
Description:
"The 'Fibonacci Bollinger Volume Weighted Deviation' indicator presents a novel approach to market trend analysis by integrating Fibonacci ratios with the classic concept of Bollinger Bands. Designed for traders who incorporate Fibonacci levels in their market analysis, this indicator adapts Bollinger Bands to a user-defined Fibonacci ratio. It creates dynamic upper and lower bands around a Simple Moving Average (SMA), offering insights into price deviations and potential overbought or oversold market states.
Incorporating volume data, this indicator provides a volume-weighted perspective of price deviations. This feature is crucial in gauging the market sentiment, as significant volumes linked with price deviations can signal strong market moves. By plotting these deviations and emphasizing those that significantly diverge from the volume-weighted average, it aids in pinpointing potential turning points or key support and resistance zones.
Versatile in nature, the 'Fibonacci Bollinger Volume Weighted Deviation' indicator is adaptable to various trading styles and market conditions. It proves especially valuable in markets where Fibonacci levels are a key factor. Traders can explore long positions when prices fall below the lower band and consider short positions when prices breach the upper band. The addition of volume-weighted deviation analysis refines these trading signals, offering a more sophisticated and nuanced decision-making process for entries and exits.
As a standalone tool or in conjunction with other technical instruments, this indicator is an invaluable addition to any technical analyst's toolkit. It not only enhances traditional Fibonacci and Bollinger Band methodologies but also integrates volume analysis to provide a comprehensive view of market trends and movements."