[RS]MTF Fibonacci Cycles V0EXPERIMENTAL:
Fibonacci rate levels based on price advance/decline, can be used to make visualizations of fib clusters or for cycles.
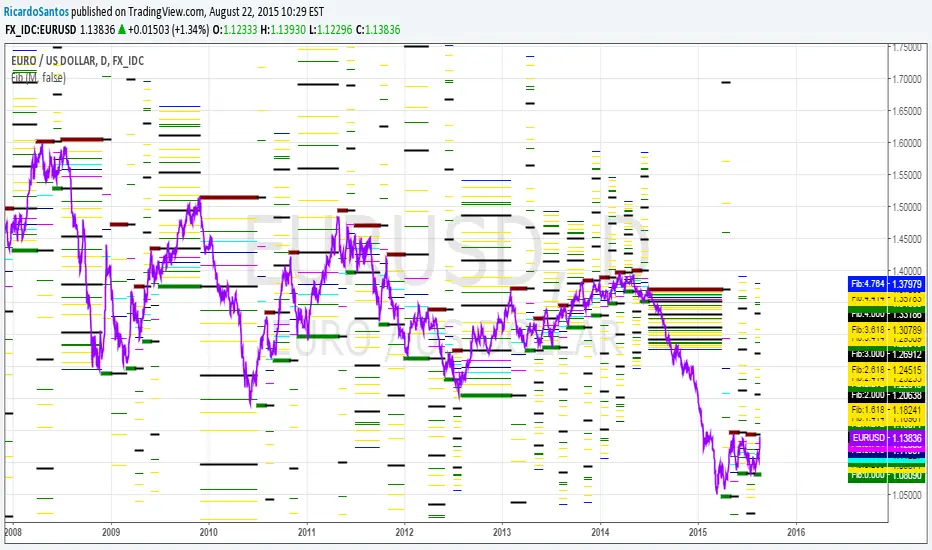
פיבונאצ'י
3BBands (3 Spirolinas)The script combines 3 single Bollinger bands into one script for easy plotting and range modification. It can be used for analyzing a market with multiple time frames and ranges using Fibonacci series as the range.

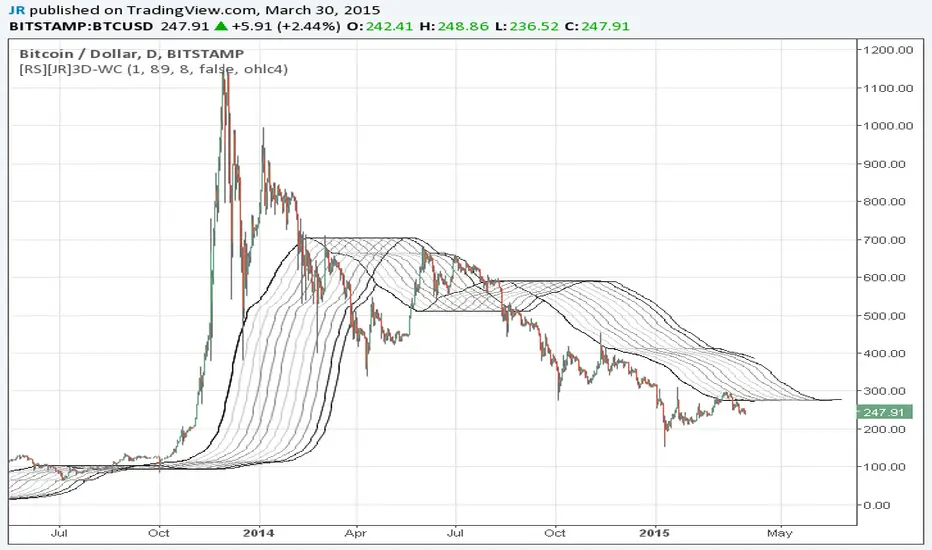
Wave Channel 3D Wave Channel 3D
Built by Ricardo idea from JR & Aloakdutt from indieTrades Jan. 2010
This indicator is very easy to build. We utilize Moving Averages with a set multiplier and an offset. Specially we try to use Fibonacci sequence series numbers (1, 2, 3, 5, 8, 13, 21, 34, 55, 89, 144...) as time space and multiplier (default 89, 8). Also included is Donchian Channel to locate strong trends and possible future support - resistance.
Examples of support/resistance on chart.
Dominant Price Trends
Future Support Resistance
Comparing Fibonacci Series Time Space - Multiplier
When Comparing make note of confluence support/resistance showing up with Fibonacci Series
Example uses DC
When Comparing make note of confluence support/resistance showing up with Fibonacci Series
Example without DC / Smooth MA
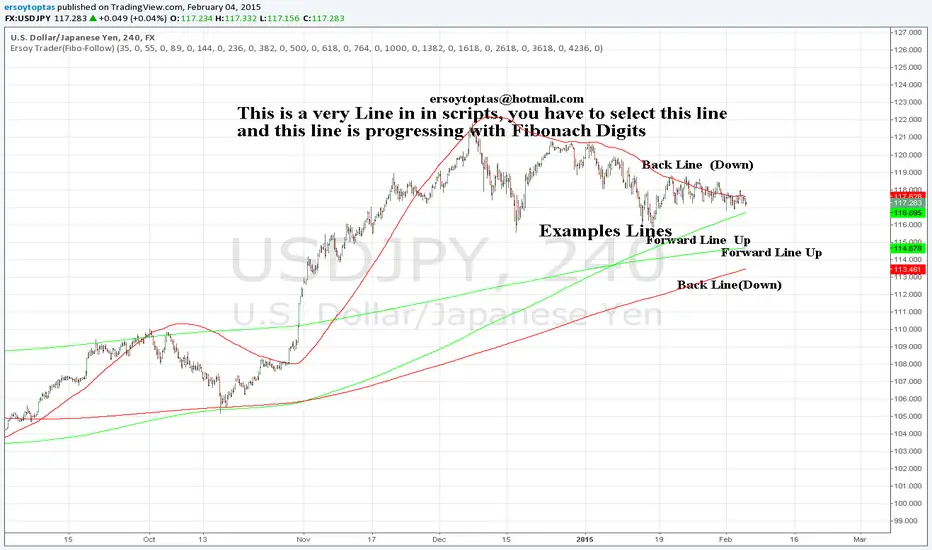
Ersoy Trader (Fibo Follow)website: www.ersoytoptas.com
Newspaper : tr.investing.com
This is a very Line in in scripts, you have to select this line
and this line is progressing with Fibonach Digits
want to just developed more this script to specify the buy and sell points
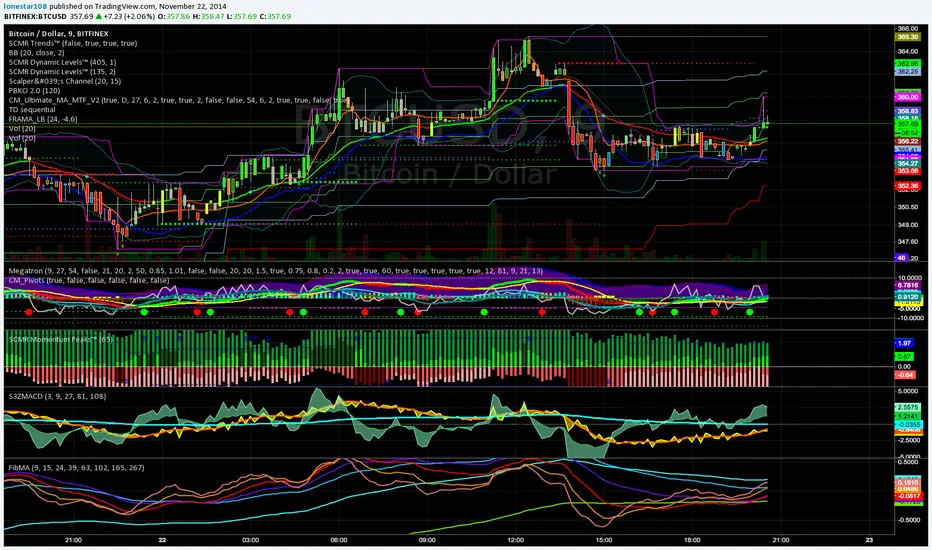
PhiMACDHere is a modified moving average which uses phi as the scaling interval between moving average periods. Each MACD line is derived by determining EMAs for 8 period frames, each of which is related to the other proportionally by phi, and calculating each line by comparing it against its immediate predecessor. Actual period values are 9 15 24 39 63 102 165 and 267
Retracement Level TriggerI use the simple script to notify me when a retracement level has been met. I use the SMS alert to tell me when a specific retracement level has been met from a local pivot a high or local pivot low. Please let me know what you think. Feel free to make improvements and repost.