PEGY Ratio (Robust) Using the PEG but incorporating Dividends in order to find value investing opportunities by better understanding growth vs. forward P/E.אינדיקטור Pine Script®מאת matthewdukesmith1110
PEGY Ratio (Div Adj PEG)Identifying the PEGY (Dividend Adjusted PEG) to find value investment opportunities. אינדיקטור Pine Script®מאת matthewdukesmith6
2 EMA Cross Signals – AL / SATIt gives signals at EMA crossovers. It gives buy and sell signals. You can change the EMA settings. It is very good for trend following.אינדיקטור Pine Script®מאת Bafrali555513
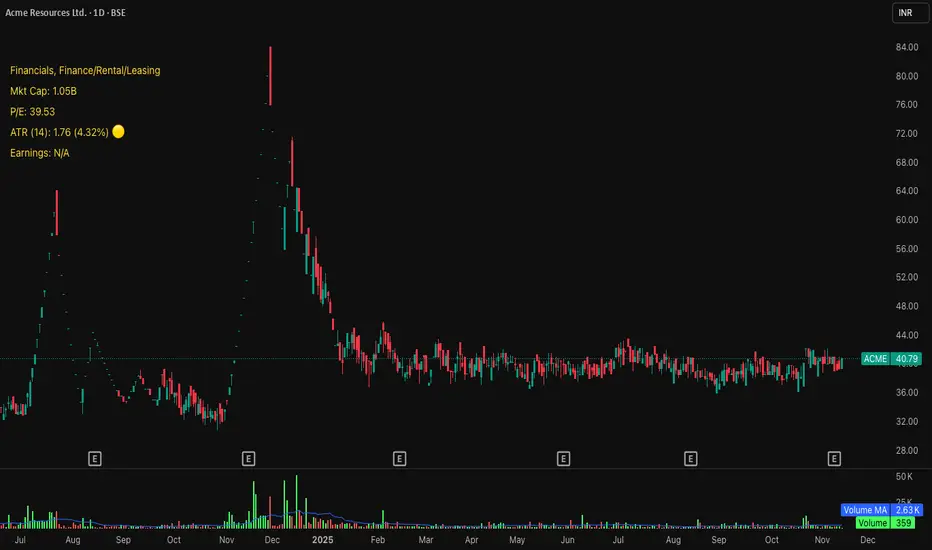
Michael's Custom Watermark🔷 MICHAEL'S CUSTOM WATERMARK INDICATOR ━━━━━━━━━━━━━━━━━━━━━━━━━━━━━━━━━━━━━━━ 📊 OVERVIEW A comprehensive chart watermark overlay that displays essential fundamental and technical information for stocks in a clean, customizable table format. Perfect for traders who want quick access to key metrics without cluttering their charts. ━━━━━━━━━━━━━━━━━━━━━━━━━━━━━━━━━━━━━━━ ✨ KEY FEATURES 📊 Fundamental Data Display — Shows Industry, Sector, Market Cap, and P/E Ratio 📅 Earnings Information — Displays next earnings date with countdown timer 📈 ATR Volatility Indicator — 14-day ATR with color-coded visual alerts (🔴🟡🟢) 🎨 Auto Theme Detection — Automatically adjusts text color based on chart background ⚙️ Fully Customizable — Position, colors, size, and displayed metrics all adjustable 🏢 GICS Sector Mapping — Heuristic-based sector classification aligned with industry standards ━━━━━━━━━━━━━━━━━━━━━━━━━━━━━━━━━━━━━━━ 🎯 WHAT MAKES THIS INDICATOR UNIQUE? Unlike basic watermarks, this indicator provides: Real-time fundamental data integration Smart theme-aware color adaptation for both light and dark charts Configurable volatility alerts using ATR thresholds Earnings countdown feature to never miss important dates Optimized display that only shows relevant data for the current symbol type ━━━━━━━━━━━━━━━━━━━━━━━━━━━━━━━━━━━━━━━ 📖 HOW TO USE 1. BASIC SETUP Add the indicator to your chart. By default, it displays in the top-left corner with all features enabled. 2. POSITIONING Vertical Location: Top, Middle, or Bottom Horizontal Location: Left, Center, or Right Vertical Offset: Fine-tune position with 0-50 pixel offset from top 3. CUSTOMIZATION OPTIONS TEXT APPEARANCE: Auto Text Color — Enable to automatically adapt text color to your chart theme Manual Color — Set a fixed text color if auto-color is disabled Text Size — Choose from Huge, Large, Normal, or Small Theme Colors — Customize text color for light and dark backgrounds separately DATA DISPLAY TOGGLES: Show Industry & Sector — Display heuristic-based GICS-aligned sector and industry classification Show Market Cap — View market capitalization in T/B/M format Show P/E Ratio — Display Price-to-Earnings ratio (stocks only) Show ATR (14-Day) — Display Average True Range with percentage and visual indicator Show Next Earnings — Display upcoming earnings information Show Earnings Countdown — Show days remaining until next earnings (requires earnings display) 4. ATR VOLATILITY ALERTS Configure custom thresholds to monitor volatility: Red Threshold — ATR percentage that triggers red alert 🔴 (default: 6%) Yellow Threshold — ATR percentage that triggers yellow alert 🟡 (default: 3%) Green — Shows automatically when ATR is below yellow threshold 🟢 ━━━━━━━━━━━━━━━━━━━━━━━━━━━━━━━━━━━━━━━ 📐 UNDERSTANDING THE DISPLAY 🏢 SECTOR & INDUSTRY Shows the GICS sector classification followed by the specific industry. The indicator uses heuristic-based mapping to align TradingView sectors with standard GICS classifications. Note that this mapping is based on keyword detection and industry analysis, so while generally accurate, it may not perfectly match official GICS classifications in all cases. 💰 MARKET CAP Displays market capitalization using standard abbreviations: T = Trillion B = Billion M = Million 📊 P/E RATIO Shows the trailing twelve-month Price-to-Earnings ratio. Only displayed for stocks when enabled. Shows "N/A" if data is unavailable. 📈 ATR (14-DAY) Displays the 14-period Average True Range in both absolute value and percentage terms, with a color-coded indicator: 🔴 Red: High volatility (above red threshold) 🟡 Yellow: Moderate volatility (between yellow and red thresholds) 🟢 Green: Low volatility (below yellow threshold) 📅 EARNINGS Shows earnings information in three formats: "X days remaining" — When countdown is enabled and earnings date is known "Upcoming" — When date is in the future but countdown is disabled "Recently Reported" — When earnings just occurred "N/A" — When no earnings data is available ━━━━━━━━━━━━━━━━━━━━━━━━━━━━━━━━━━━━━━━ ⚙️ TECHNICAL DETAILS SUPPORTED INSTRUMENTS: Optimized for stocks with full fundamental data Works with other instruments (crypto, forex, futures) but only displays applicable metrics Automatically suppresses irrelevant data (e.g., P/E for non-stocks) PERFORMANCE: Lightweight overlay with minimal resource usage Updates only on last bar for efficiency No historical recalculation needed COMPATIBILITY: Pine Script v6 Works on all timeframes Compatible with all chart types Auto-adapts to theme changes ━━━━━━━━━━━━━━━━━━━━━━━━━━━━━━━━━━━━━━━ 💡 TIPS & BEST PRACTICES Enable Auto Text Color for seamless theme switching between light and dark modes Adjust vertical offset to avoid overlap with price action in high-volatility periods Use ATR thresholds appropriate to your trading style and asset class Disable features you don't use to keep the watermark clean and focused Position in corners to maximize chart viewing space Use smaller text size for multi-panel layouts ━━━━━━━━━━━━━━━━━━━━━━━━━━━━━━━━━━━━━━━ 🔧 TROUBLESHOOTING "N/A" SHOWING FOR P/E RATIO: This is normal for non-stock instruments May occur for stocks with negative earnings Check if fundamental data is available for the symbol EARNINGS SHOWING "N/A": Earnings data may not be available for all stocks Check TradingView's data coverage for your symbol TEXT COLOR NOT VISIBLE: Enable Auto Text Color feature Manually set text color to contrast with your chart background Adjust custom light/dark text colors in settings ━━━━━━━━━━━━━━━━━━━━━━━━━━━━━━━━━━━━━━━ ⚠️ DISCLAIMER This indicator is for informational purposes only. The fundamental data displayed is sourced from TradingView's data providers. Always verify critical information before making trading decisions. Past performance is not indicative of future results. ━━━━━━━━━━━━━━━━━━━━━━━━━━━━━━━━━━━━━━━ If you find this indicator helpful, please give it a boost 🚀 and share your feedback in the comments! Version: 1.0 Pine Script Version: v6 Created by: Michael אינדיקטור Pine Script®מאת ehudm14
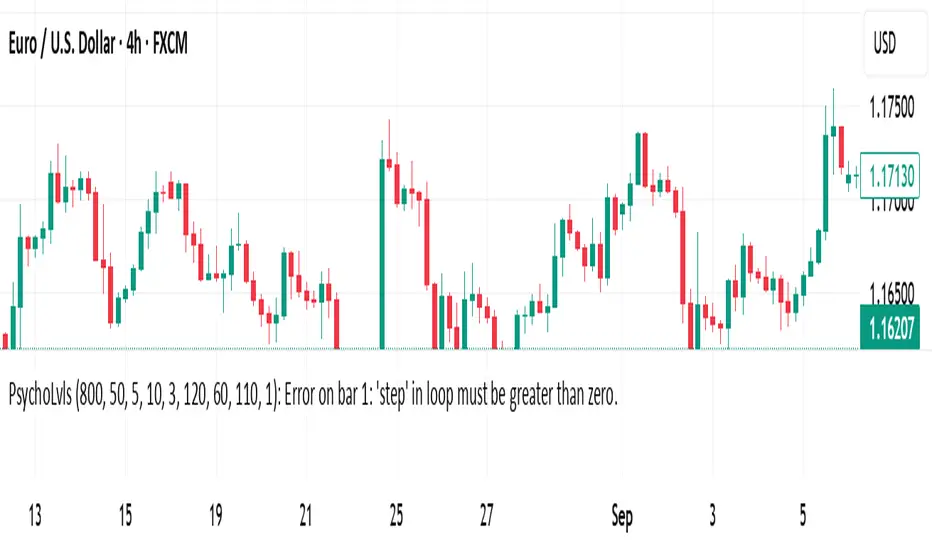
Psychological Levels (Zones + Alerts) - StableThis technical indicator plot support and resistance levels based on the psychological numbersאינדיקטור Pine Script®מאת kennwes_okoth5
Smart Trail Signals NO CONDITIONSSmart Trail Signals Indicator Overview This is a trend-following indicator that uses a dynamic trailing stop system to identify bullish and bearish trends. It adapts to market volatility using ATR (Average True Range) and provides visual signals when the trend direction changes. Core Components Smart Trail System: Calculates dynamic support (trail_up) and resistance (trail_down) levels Adjusts trail levels based on price movement and volatility Maintains trend direction until price crosses the opposite trail level Key Parameters: Length (14): Period for ATR calculation Multiplier (2.0): Distance of trail from price relative to ATR Sensitivity (1-5): Fine-tunes how quickly the trail adapts to price changes How It Works Trend Detection: Monitors whether price is above the support trail (bullish) or below the resistance trail (bearish) Trail Movement: In uptrends: Support trail rises with price but never decreases In downtrends: Resistance trail falls with price but never increases Signals: Diamond shapes appear when trend flips: Green diamond below bar = bullish trend change Red diamond above bar = bearish trend change Visual Aids: Trail line changes color (lime for uptrend, red for downtrend) Candles colored green (bullish), red (bearish), or gray (neutral) Best Use Cases Identifying trend reversals on any timeframe Following strong directional moves Setting dynamic stop-loss levels Works 24/7 on all instruments (stocks, crypto, forex) RetryClaude can make mistakes. Please double-check responses. Sonnet 4.5אינדיקטור Pine Script®מאת ppavank594
Rons Custom WatermarkRon's Custom Watermark (RCW) This is a lightweight, all-in-one watermark indicator that displays essential fundamental and technical data directly on your chart. It's designed to give you a quick, at-a-glance overview of any asset without cluttering your screen. Features The watermark displays the following information in a clean table: * Company Info: Full Name & Market Cap (e.g., "AST SpaceMobile, Inc. (18.85B)") * Symbol & Timeframe: Ticker and current chart period (e.g., "ASTS, 1D") * Sector & Industry: The asset's classification. * Technical Status (MA): Shows if the price is Above or Below the SMA (with a 🟢/🔴 emoji). * Technical Status (EMA): Shows if the price is Above or Below the EMA (with a 🟢/🔴 emoji). * Earnings: A countdown showing "X days remaining" until the next earnings report. * (Optional) Volatility: The 14-day ATR value and its percentage of the current price.אינדיקטור Pine Script®מאת irthetraders1111
Weekly Fibonacci Pivot Signals (4H) - S1/R1 & S3/R3 rulesThis Indicator used weekly price range to calculate the pivot R1,R3,S1 and S3 ,when price crossed and closed below R3 in 4H timeframe the indicator gives sell signal, when the price crossed and close above the S3 the indicator gives buy signal. This indicator can give approximately 50% win Rate .אינדיקטור Pine Script®מאת kennwes_okoth8
Market Extreme Zones IndexThe Market Extreme Zones Index is a new mean reversion (valuation) tool focused on catching long term oversold/overbought zones. Combining an enhanced RSI with a smoothed Z-score this indicator allows traders to find oppurtunities during highly oversold/overbought zones. I will separate the explanation into the following parts: 1. How does it work? 2. Methodologies & Concepts 3. Use cases How does it work? The indicator attempts to catch highly unprobable events in either direction to capture reversal points over the long term. This is done by calculating the Z-Score of an enhanced RSI. First we need to calculate the Enhanced RSI: For this we need to calculate 2 additional lengths: Length1 = user defined length Length2 = Length1/2 Length3 = √Length Now we need to calculate 3 different RSIs: 1st RSI => uses classic user defined source and classic user defined length. 2nd RSI => uses classic user defined source and Length 2. 3rd RSI => uses RSI 2 as source and Length 2 Now calculate the divergence: RSI_base => 2nd RSI * 3 - 1st RSI - 3rd RSI After this we need to calculate the median of the RSI_base over √Length and make a divergence of these 2: RSI => RSI_base*2 - median All that remains now is the Z-score calculations: We need: Average RSI value Standard Deviation = a measure of how dispersed or spread out a set of data values are from their average Z-score = (Current Value - Average Value) / Standard Deviation After this we just smooth the Z-score with a Weighted Moving average with √Length Methodology & Concepts Mean Reversion Methodology: The methodology behind mean reversion is the theory that asset prices will eventually return to their long-term average after deviating significantly, driven by the belief that extreme moves are temporary. Z-Score Methodology: A Z-score, or standard score, is a statistical measure that indicates how many standard deviations a data point is from the mean of a dataset. A positive z-score means the value is above the mean, a negative score means it's below, and a score of zero means the value is equal to the mean. You might already be able to see where I am going with this: Z-Score could be used for the extreme moves to capture reversal points. By applying it to the RSI rather than the Price, we get a more accurate measurement that allow us to get a banger indicator. Use Cases Capturing reversal points Trend Direction - while the main use it for mean reversion, the values can indicate whether we are in an uptrend or a downtrend. Advantages: Visualization: The indicator has many plots to ensure users can easily see what the indicator signals, such as highlighting extreme conditions with background colors. Versatility: This indicator works across multiple assets, including the S&P500 and more, so it is not only for crypto. Final note: No indicator alone is perfect. Backtests are not indicative of future performance. Hope you enjoy Gs! Good luck!אינדיקטור Pine Script®מאת MisinkoMaster320
Previous Day H/L/CYour good old Previous day High, Low and Closing lines. I made this so you don't have to! lolאינדיקטור Pine Script®מאת wladcggmap71
Bar RangeI use this to complement the daily ATR bars. It is interesting to see how much the stock has actually moved vs the ATR movement.אינדיקטור Pine Script®מאת wladcggmap76
Macro Flow Assistant — Full Clean Levels public versionpublic easy macro flow tracker. important levels only marked. trend bias.אינדיקטור Pine Script®מאת jacob145727
Presidential ScannerThe Presidential Scanner is an advanced analysis tool that combines state-of-the-art algorithmic calculations with the processing of economic and macroeconomic data in real time. Thanks to its intelligent technology, it detects high-potential market revenue, offering clear, profitable and highly operationally effective signals.אינדיקטור Pine Script®מאת presidentialfunds231193
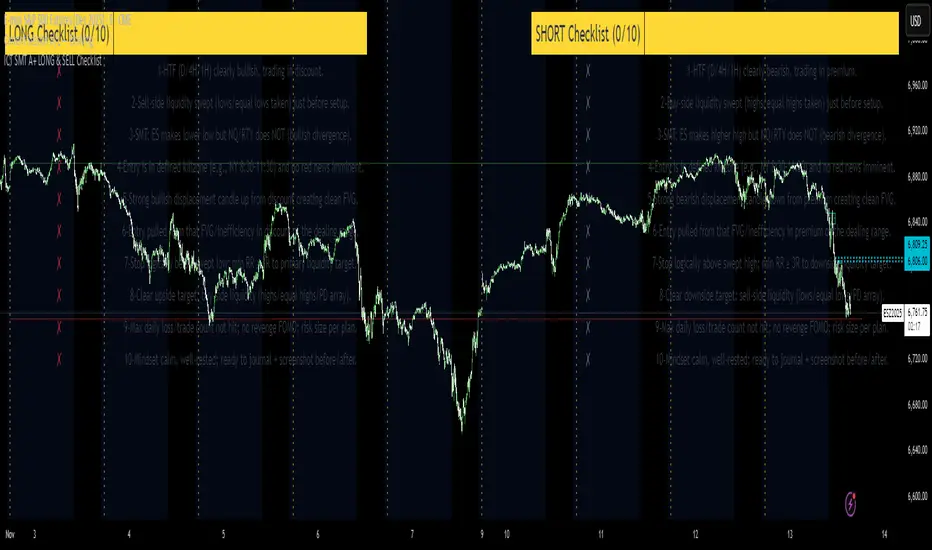
ICT SMT A+ LONG & SELL ChecklistTrade Checklist. Once all items checked color changes from yellow to green. אינדיקטור Pine Script®מאת DaLondonBoy8811
Monthly, Weekly Open + Daily Pivot (Broken Lines, fixed)monthly open line weekly open and daily pivot This TradingView indicator plots three key reference levels on your chart: Monthly Open Line – shows the current month’s opening price. Weekly Open Line – shows the current week’s opening price. Daily Pivot Line – shows the pivot level based on the previous day’s high, low, and close. Each line resets at the start of its new period (month, week, or day), so the lines are broken, not continuous. You can fully customize visibility, color, and thickness for each line. It helps traders quickly see market bias and important support/resistance levels for better intraday or swing trading decisions.אינדיקטור Pine Script®מאת vmdss2119
Market Breadth - [JTCAPITAL]Market Breadth - is a comprehensive crypto market strength and sentiment indicator designed to visualize the overall bullish or bearish alignment across 40 major cryptocurrencies. By combining multi-asset Exponential Moving Average (EMA) comparisons and smoothing techniques, it offers a clean, aggregated view of the broader market trend—helping traders quickly assess whether the market is dominated by bullish momentum or bearish pressure. The indicator works by calculating in the following steps: Symbol Selection and Data Retrieval The script monitors 40 leading cryptocurrencies based on Market Cap. Each asset’s daily close price is requested using a 1D timeframe. This ensures that every data point reflects the same temporal resolution, allowing the indicator to evaluate global crypto strength rather than individual token volatility. EMA Comparison per Asset For each asset, two Exponential Moving Averages (EMAs) are calculated: A short-term EMA with period emalength (default 10). A long-term EMA with period emalength2 (default 20). Each coin receives a score of +1 when the short-term EMA is greater than the long-term EMA (indicating bullish structure), or -1 when it is below (indicating bearish structure). This binary scoring system effectively converts individual price action into a directional sentiment measure. Market Breadth Aggregation All 40 individual scores are summed into a single composite value called scores . If many assets have bullish EMA alignment, the total score becomes strongly positive. If the majority show bearish alignment, the total score turns negative. This step transforms scattered price data into one unified market breadth metric—quantifying how many assets participate in the same directional trend. Smoothing the Breadth Line To reduce short-term noise and isolate trend direction, the aggregated score is smoothed using an EMA of length = smoothlen (default 15). The resulting smoothed line helps identify sustained shifts in collective sentiment rather than temporary fluctuations. Visualization and Color Coding When scores > 0 , the market breadth is bullish and the histogram is colored blue. When scores < 0 , the breadth turns bearish and the histogram is purple. The same logic applies to the smoothed line and background color, offering an instant visual cue of market mood transitions. Buy and Sell Conditions: The indicator itself does not trigger direct buy/sell signals but rather acts as a market regime filter . Traders can use it as follows: Buy Filter: When the smoothed value is above zero and rising, the majority of assets confirm an uptrend — this favors long setups or trend continuation entries. Sell Filter: When the smoothed value is below zero and falling, bearish alignment dominates — ideal for short setups or defensive risk management. Optional filters could include combining this with RSI or volume-weighted momentum indicators to confirm breadth-based reversals. Features and Parameters: emalength – Defines the short-term EMA length used for individual asset trend detection (default 10). emalength2 – Defines the long-term EMA length (default 20). smoothlen – Defines the smoothing EMA length for the total market breadth line (default 15). 40 asset inputs – User-editable symbols allow full customization of which cryptos are tracked. Dynamic color backgrounds – Visual distinction between bullish and bearish phases. Specifications: Exponential Moving Average (EMA) EMA is a type of moving average that places more weight on recent price data, responding faster to market changes compared to SMA. By comparing a short-term and long-term EMA, the indicator captures momentum shifts across each asset individually. The crossover logic (EMA10 > EMA20) signals bullish conditions, while the opposite indicates bearish momentum. Market Breadth Market Breadth quantifies how many assets are participating in a directional move. Instead of tracking a single coin’s trend, breadth analysis measures collective sentiment. When most coins’ short-term EMAs are above long-term EMAs, the market shows healthy bullish breadth. Conversely, when most are below, weakness dominates. Smoothing (EMA on Scores) After summing the breadth score, the result is smoothed with an additional EMA to mitigate the inherent volatility caused by individual coin reversals. This second-level smoothing transforms raw fluctuations into a readable, trend-consistent curve. Color Visualization Visual cues are integral for intuitive interpretation. Blue Shades: Indicate bullish alignment and collective upward momentum. Purple Shades: Indicate bearish conditions and potential risk-off phases. The background tint reinforces visual clarity even when the indicator is overlaid on price charts. Background Logic By applying the same color logic to the chart’s background, users can instantly recognize the prevailing market phase. Use Cases As a trend confirmation filter for other indicators (e.g., trade only in the direction of positive breadth). As a divergence tool : when price rises but breadth weakens, it may signal a topping market. As a macro sentiment monitor : perfect for assessing when the crypto market as a whole transitions from bearish to bullish structure. Summary “ Market Breadth - ” transforms the chaotic price movements of 40 cryptocurrencies into a single, powerful visual representation of overall market health. By merging EMA cross analysis with market-wide aggregation and smoothing , it provides traders with a deep understanding of when bullish or bearish forces dominate the ecosystem. It’s a clean, data-driven approach to identifying shifts in crypto market sentiment — a perfect companion for trend-following, macro analysis, and timing portfolio exposure. Enjoy!אינדיקטור Pine Script®מאת JTCapitalNLמעודכן 133
EPS Trendline (Fundamentals Insight by Mazhar Karimi)Overview This indicator visualizes a company’s Earnings Per Share (EPS) data directly on the chart—pulled from TradingView’s fundamental database—and applies a dynamic linear regression trendline to highlight the long-term direction of earnings growth or decline. It’s designed to help investors and quantitative traders quickly see how the company’s profitability (EPS) has evolved over time and whether it’s trending upward (growth), flat (stagnant), or downward (decline). How it Works Uses request.financial() to fetch EPS data (Diluted or Basic). You can select whether to use TTM (Trailing Twelve Months), FQ (Fiscal Quarter), or FY (Fiscal Year) data. The script fits a regression line (using ta.linreg) over a configurable window to visualize the underlying EPS trend. Updates automatically when new financial data is released. Inputs EPS Period: Choose between FQ / FY / TTM Use Diluted EPS: Toggle to compare Diluted vs. Basic EPS Regression Window: Adjust how many bars are used to fit the trendline Interpretation Tips A rising trendline indicates earnings momentum and potential investor confidence. A flat or declining trendline may warn of profitability slowdowns. Combine with price action or valuation ratios (like P/E) for deeper analysis. Works best on stocks or ETFs with fundamental data (not available for crypto or FX). Suggestions / Use Cases Pair with Price/Earnings ratio indicators to evaluate valuation vs. fundamentals. Use in conjunction with earnings release events for context. Ideal for long-term investors, swing traders, or fundamental quants tracking financial health trends. Future Enhancements (Planned Ideas) 🔹 Option to display multiple regression lines (short-term and long-term) 🔹 Support for comparing multiple tickers’ EPS in the same pane 🔹 Integration with Net Income, Revenue, or Free Cash Flow trends 🔹 Add a “Rate of Change” signal for momentum-based EPS analysisאינדיקטור Pine Script®מאת mazharkarimi28
Hourly High Low Short LinesDraws short horizontal lines at the previous hour’s high and low, aligned perfectly with the candle’s top and bottom. It’s concise, clear, and fits well for the public script description box.אינדיקטור Pine Script®מאת captainshark2238
4/8/15 EMA + Classic & Camarilla PivotsEssentially this is what you can get on TOS but everything included in one chart.אינדיקטור Pine Script®מאת milhistory738
Daily ATR SL/TP Labels on ChartATR-Based Stop Loss & Take Profit Calculator This script calculates 20% of the Average True Range (ATR) to determine optimal Stop Loss and Take Profit levels. Designed to assist traders in setting precise risk parameters when placing Buy/Sell orders based on daily market volatility. Key Features: Computes 20% of ATR value for proportional risk management Provides dynamic SL/TP levels aligned to current market conditions Optimised for Daily timeframe analysis to capture full trading day range Recommended Usage: Apply on Daily (1D) timeframe for most accurate results, as this captures the complete intraday price movement and provides reliable volatility measurements for position sizing and risk management decisions.אינדיקטור Pine Script®מאת IamAryTrades25
Performance (Improved + Position & Size) This indicator displays a performance heat-table on the chart, showing percentage returns for multiple timeframes such as 1W, 1M, 3M, 6M, 9M, 1Y and To-Date periods (MTD / QTD / YTD style). The goal is to quickly visualize how the current symbol has performed across different timeframes in a compact and readable format.אינדיקטור Pine Script®מאת gaurav01860
Direction LineThis is a simplified indicator for the TradingView platform, intended for beginner traders. It draws a line that follows the candle's closing price, coloring it green on an uptick (close > open) and red on a downtick. The indicator helps visualize the market impulse direction based on the basic concept of pivot levels, without unnecessary elements such as labels, alerts, or additional levels. Ideal for those who want to quickly understand the trend without data overload.אינדיקטור Pine Script®מאת kom_andruxa19861
Session High and Lowmarks out previous NY session high/low, asian and london session high/low and updates automatically. Perfect indicator for overnight liquidity.אינדיקטור Pine Script®מאת jimpro534