FVG 9:31–10:00 AM ETFVG 9:31–10:00 AM ET - Script Description
What This Script Does
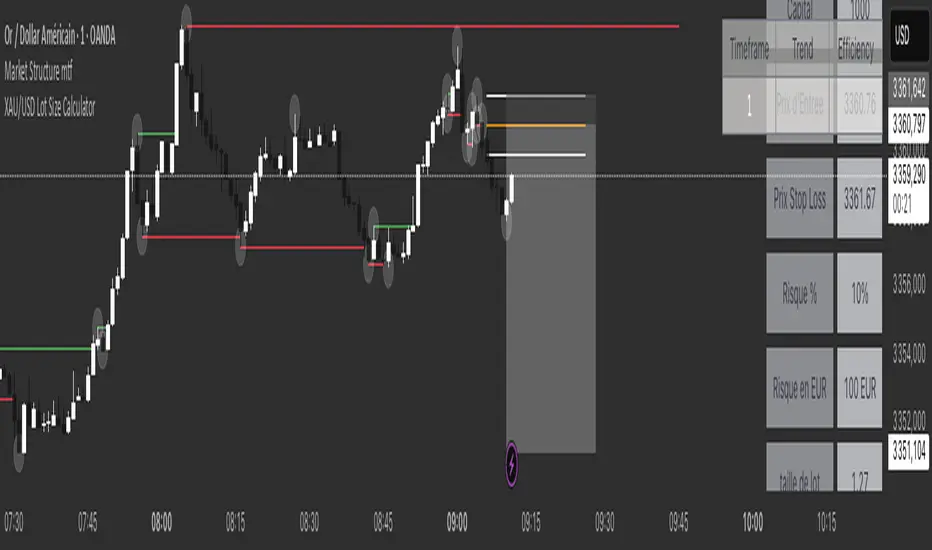
This indicator finds **Fair Value Gaps (FVGs)** that form during the first 29 minutes of the U.S. stock market (9:31 AM to 10:00 AM Eastern Time). A Fair Value Gap is a price imbalance where there's a gap between candles that often becomes an important support or resistance level.
Key Features:
- **Time Window**: Only looks for FVGs between 9:31-10:00 AM ET (most important opening period)
- **One Per Day**: Finds only the first FVG that forms in this time window each day
- **Visual Display**: Draws a purple box around the gap with a clear "FVG" label
- **Price Tracking**: Monitors when price comes back to test the gap level
- **Alert System**: Sends notifications when price returns to the FVG zone
How FVGs Are Detected:
- **Bullish FVG**: When there's a gap up (low of middle candle is above high of 3rd candle back)
- **Bearish FVG**: When there's a gap down (high of middle candle is below low of 3rd candle back)
The 9:31-10:00 AM window is chosen because this is when institutions and algorithms create their biggest price moves right after market open, making these gaps very reliable.
Customization Options
User Settings
Extend FVG Box (Bars)
- **What it does**: Makes the purple box longer to the right
- **Default**: 0 (box ends right after the gap forms)
- **Options**: Any number from 0 to 100+
- **When to use**:
- Keep at 0 for clean historical view
- Set to 10-20 to track the gap during the current session
- Set higher for longer reference
Code Settings (Can Be Changed)
Time Window
- **Start**: 9:31 AM Eastern Time
- **End**: 10:00 AM Eastern Time
- **Can modify**: Change the hour/minute numbers in the code
Visual Style
- **Color**: Purple with see-through background
- **Label**: Shows "FVG" text in white
- **Can modify**: Change colors and transparency in the code
How to Use:
Setup
Chart Settings
1. Use 1-minute, 5-minute, or 15-minute charts (works best on these timeframes)
2. Apply to liquid markets like ES, NQ, major stocks, or forex pairs
3. Set the "Extend FVG Box" to your preference (start with 0 or 10)
What You'll See
- A purple box appears when an FVG forms during 9:31-10:00 AM
- Box shows the exact price levels of the gap
- "FVG" label appears on the box
- Only one FVG per day will be marked
Trading Strategies
Basic FVG Trading
1. **Wait for Formation**: Let the purple box appear during 9:31-10:00 AM
2. **Watch Price Movement**: See if price moves away from the gap
3. **Enter on Retest**: When price comes back to the purple box area, consider entering
4. **Trade Direction**:
- Bullish FVG = look for long opportunities when price retests
- Bearish FVG = look for short opportunities when price retests
Entry Methods
- **Bounce Play**: Enter when price touches the FVG box and bounces away
- **Break Play**: Enter if price strongly breaks through the FVG box
- **Rejection Play**: Enter opposite direction if price gets rejected at the FVG
Risk Management
Stop Losses
- Place stops just outside the FVG box (a few ticks beyond the gap)
- If trading a bounce, stop goes on opposite side of the gap
- If trading a break, stop goes back inside the gap
Position Sizing
- Start small until you understand how FVGs work in your market
- Bigger gaps = smaller position size (more risk)
- Smaller gaps = can use larger position size
Profit Targets
- Take profits at obvious levels like round numbers, previous highs/lows
- Consider taking half profits at 1:1 risk/reward ratio
- Let some position run if the move is strong
Best Practices
When It Works Best
- High-volume stocks and futures (ES, NQ work great)
- Normal market days without major news during the 9:31-10:00 window
- When there's clear institutional activity in the opening period
When to Be Careful
- Low-volume stocks or markets
- Major economic news releases during the time window
- Market holidays when volume is low
- Very choppy or sideways days
Alert Usage
- The script will alert you when price comes back to test the FVG
- Don't trade the alert blindly - always check the current market situation
- Use the alert as a heads-up to start watching the setup more closely
Tips for Success
- The earlier the FVG forms in the 9:31-10:00 window, often the more significant it is
- FVGs that form with high volume are usually more reliable
- Always consider the overall market direction - don't fight the main trend
- Practice on paper first to understand how FVGs behave in your chosen market
🔗 Works Best With:
✅ Liquidity Levels — Smart Swing Lows: Spot key structural lows that can fuel stop hunts and reversals.
✅ ICT Turtle Soup — Liquidity Reversal: Add a classic reversal pattern to your toolkit to catch fakeouts cleanly.
✅ ICT SMC Liquidity Grabs and OBs- Liquidity Grabs, Order Block Zones, and Fibonacci OTE Levels, allowing traders to identify institutional entry models with clean, rule-based visual signals.
This script is most valuable for day traders who want to catch institutional moves right after market open, but it can also help swing traders identify important intraday levels.
✅ ICT Macro Zones (Grey Box Version)- It tracks real-time highs and lows for each Silver Bullet session.
✅ Weekly Opening Gap (cryptonnnite)
אינדיקטור Pine Script®