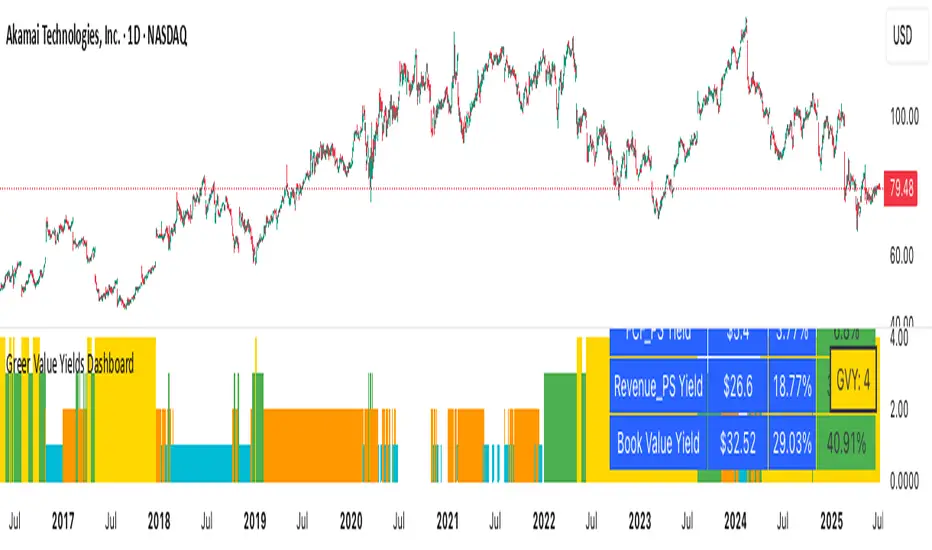
Greer Value Yields Dashboard🧾 Greer Value Yields Dashboard – v1.0
Author: Sean Lee Greer
Release Date: June 22, 2025
🧠 Overview
The Greer Value Yields Dashboard visualizes and evaluates four powerful valuation metrics for any publicly traded company:
📘 Earnings per Share Yield
💵 Free Cash Flow Yield
💰 Revenue Yield
🏦 Book Value Yield
Each yield is measured as a percentage of current stock price and compared against its historical average. The script assigns 1 point per metric when the current yield exceeds its long-term average. The total score (0 to 4) is displayed as a color-coded column chart, helping long-term investors quickly assess fundamental valuation strength.
✅ Key Features
📊 Real-time calculation of 4 yield-based valuation metrics
⚖ Historical average tracking for each yield
🎯 Visual scoring system:
🟥 0–1 = Weak
🟨 2 = Neutral
🟩 4 = Strong (all metrics above average)
🎛️ Toggle visibility of each yield independently
🧮 Fully compatible with other Greer Financial Toolkit indicators
🛠 Ideal For
Long-term value investors
Dividend and cash-flow-focused investors
Analysts seeking clean yield visualizations
Greer Toolkit users combining with Greer Value and BuyZone
אינדיקטור Pine Script®