Higher Time Frame Fair Value Gap [ZeroHeroTrading]A fair value gap (FVG) highlights an imbalance area between market participants, and has become popular for technical analysis among price action traders.
A bullish (respectively bearish) fair value gap appears in a triple-candle pattern when there is a large candle whose previous candle’s high (respectively low) and subsequent candle’s low (respectively high) do not fully overlap the large candle. The space between these wicks is known as the fair value gap.
The following script aims at identifying higher timeframe FVG's within a lower timeframe chart. As such, it offers a unique perspective on the formation of FVG's by combining the multiple timeframe data points in the same context.
You can change the indicator settings as you see fit to achieve the best results for your use case.
Features
It draws higher timeframe bullish and bearish FVG's on the chart.
For bullish (respectively bearish) higher timeframe FVG's, it adds the buying (respectively selling) pressure as a percentage ratio of the up (respectively down) volume of the second higher timeframe bar out of the total up (respectively down) volume of the first two higher timeframe bars.
It adds a right extended trendline from the most recent lowest low (respectively highest high) to the top (respectively bottom) of the higher timeframe bullish (respectively bearish) FVG.
It detects and displays higher timeframe FVG's as early as one starts forming.
It detects and displays lower timeframe (i.e. chart's timeframe) FVG's upon confirmation.
It allows for skipping inside first bars when evaluating FVG's.
It allows for dismissing higher timeframe FVG's if there is no update for any period of the chart's timeframe. For instance, this can occur at lower timeframes during low trading activity periods such as extended hours.
Settings
Higher Time Frame FVG dropdown: Selects the higher timeframe to run the FVG detection on. Default is 15 minutes. It must be higher than, and a multiple of, the chart's timeframe.
Higher Time Frame FVG color select: Selects the color of the text to display for higher timeframe FVG's. Default is black.
Show Trend Line checkbox: Turns on/off trendline display. Default is on.
Show Lower Time Frame FVG checkbox: Turns on/off lower timeframe (i.e. chart's timeframe) FVG detection. Default is on.
Show Lower Time Frame FVG color select: Selects the color of the border for lower timeframe (i.e. chart's timeframe) FVG's. Default is white.
Include Inside Bars checkbox: Turns on/off the inclusion of inside first bars when evaluating FVG's. Default is on.
With Consistent Updates checkbox: Turns on/off consistent updates requirement. Default is on.
Fvg

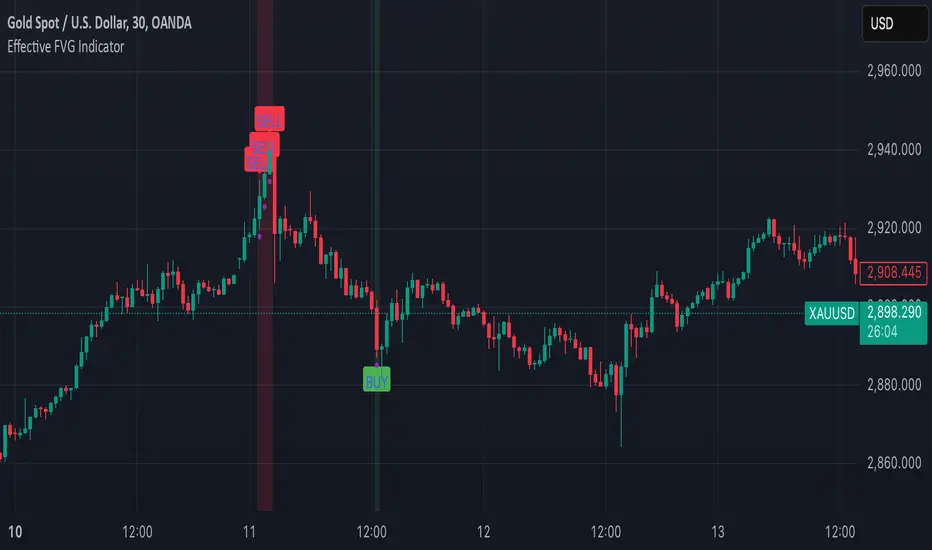
Effective FVG Indicator - ImranDescription:
The Effective FVG Indicator is a technical analysis tool designed to identify Fair Value Gaps (FVGs) in financial markets. FVGs occur when there is a significant gap between the closing price of one session and the opening price of the next session, often indicating a potential reversal point. This indicator uses volume and price movement criteria to confirm and mark these gaps effectively.
Key Features:
Fair Value Gap Detection : Identifies both bullish and bearish FVGs based on significant gaps in price.
Volume Confirmation : Confirms FVGs with high volume, ensuring that the gap is not due to a lack of liquidity.
Price Imbalance : Ensures that the gap is accompanied by a large price movement within the session, indicating strong market sentiment.
Buy/Sell Signals : Marks bullish FVGs with a green "BUY" label below the bar and bearish FVGs with a red "SELL" label above the bar.
Background Highlighting : Highlights the background with a semi-transparent green or red color when a valid FVG is detected, making it easy to spot significant gaps.
Twitter Model ICT [TradingFinder] MMXM ERL D + FVG + M15 MSS/SMT🔵 Introduction
The Twitter Model ICT is a trading approach based on ICT (Inner Circle Trader) models, focusing on price movement between external and internal liquidity in lower timeframes. This model integrates key concepts such as Market Structure Shift (MSS), Smart Money Technique (SMT) divergence, and CISD level break to identify precise entry points in the market.
The primary goal of this model is to determine key liquidity levels, such as the previous day’s high and low (PDH/PDL) and align them with the Fair Value Gap (FVG) in the 1-hour timeframe. The overall strategy involves framing trades around the 1H FVG and using the M15 Market Structure Shift (MSS) for entry confirmation.
The Twitter Model ICT is designed to utilize external liquidity levels, such as PDH/PDL, as key entry zones. The model identifies FVG in the 1-hour timeframe, which acts as a magnet for price movement. Additionally, traders confirm entries using M15 Market Structure Shift (MSS) and SMT divergence.
Bullish Twitter Model :
In a bullish setup, the price sweeps the previous day’s low (PDL), and after confirming reversal signals, buys are executed in internal liquidity zones. Conversely, in a bearish setup, the price sweeps the previous day’s high (PDH), and after confirming weakness signals, sells are executed.
Bearish Twitter Model :
In short setups, entries are only executed above the Midnight Open, while in long setups, entries are taken below the Midnight Open. Adhering to these principles allows traders to define precise entry and exit points and analyze price movement with greater accuracy based on liquidity and market structure.
🔵 How to Use
The Twitter Model ICT is a liquidity-based trading strategy that analyzes price movements relative to the previous day’s high and low (PDH/PDL) and Fair Value Gap (FVG). This model is applicable in both bullish and bearish directions and utilizes the 1-hour (1H) and 15-minute (M15) timeframes for entry confirmation.
The price first sweeps an external liquidity level (PDH or PDL) and then provides an entry opportunity based on Market Structure Shift (MSS) and SMT divergence. Additionally, the entry should be positioned relative to the Midnight Open, meaning long entries should occur below the Midnight Open and short entries above it.
🟣 Bullish Twitter Model
In a bullish setup, the price first sweeps the previous day’s low (PDL) and reaches an external liquidity level. Then, in the 1-hour timeframe (1H), a bullish Fair Value Gap (FVG) forms, which serves as the price target.
To confirm the entry, a Market Structure Shift (MSS) in the 15-minute timeframe (M15) should be observed, signaling a trend reversal to the upside. Additionally, SMT divergence with correlated assets can indicate weakness in selling pressure.
Under these conditions, a long position is taken below the Midnight Open, with a stop-loss placed at the lowest point of the recent bearish move. The price target for this trade is the FVG in the 1-hour timeframe.
🟣 Bearish Twitter Model
In a bearish setup, the price first sweeps the previous day’s high (PDH) and reaches an external liquidity level. Then, in the 1-hour timeframe (1H), a bearish Fair Value Gap (FVG) is identified, serving as the trade target.
To confirm entry, a Market Structure Shift (MSS) in the 15-minute timeframe (M15) should form, signaling a trend shift to the downside. If an SMT divergence is present, it can provide additional confirmation for the trade.
Once these conditions are met, a short position is taken above the Midnight Open, with a stop-loss placed at the highest level of the recent bullish move. The trade's price target is the FVG in the 1-hour timeframe.
🔵 Settings
Bar Back Check : Determining the return of candles to identify the CISD level.
CISD Level Validity : CISD level validity period based on the number of candles.
Daily Position : Determines whether only the first signal of the day is considered or if signals are evaluated throughout the entire day.
Session : Specifies in which trading sessions the indicator will be active.
Second Symbol : This setting allows you to select another asset for comparison with the primary asset. By default, "XAUUSD" (Gold) is set as the second symbol, but you can change it to any currency pair, stock, or cryptocurrency. For example, you can choose currency pairs like EUR/USD or GBP/USD to identify divergences between these two assets.
Divergence Fractal Periods : This parameter defines the number of past candles to consider when identifying divergences. The default value is 2, but you can change it to suit your preferences. This setting allows you to detect divergences more accurately by selecting a greater number of candles.
The indicator allows displaying sessions based on various time zones. The user can select one of the following options :
UTC (Coordinated Universal Time)
Local Time of the Session
User’s Local Time
Show Open Price : Displays the New York market opening price.
Show PDH / PDL : Displays the previous day’s high and low to identify potential entry points.
Show SMT Divergence : Displays lines and labels for bullish ("+SMT") and bearish ("-SMT") divergences.
🔵 Conclusion
The Twitter Model ICT is an effective approach for analyzing and executing trades in financial markets, utilizing a combination of liquidity principles, market structure, and SMT confirmations to identify optimal entry and exit points.
By analyzing the previous day’s high and low (PDH/PDL), Fair Value Gaps (FVG), and Market Structure Shift (MSS) in the 1H and M15 timeframes, traders can pinpoint liquidity-driven trade opportunities. Additionally, considering the Midnight Open level helps traders avoid random entries and ensures better trade placement.
By applying this model, traders can interpret market movements based on liquidity flow and structural changes, allowing them to fine-tune their trading decisions with higher precision. Ultimately, the Twitter Model ICT provides a structured and logical approach for traders who seek to trade based on liquidity behavior and trend shifts in the market.

2022 Model ICT Entry Strategy [TradingFinder] One Setup For Life🔵 Introduction
The ICT 2022 model, introduced by Michael Huddleston, is an advanced trading strategy rooted in liquidity and price imbalance, where time and price serve as the core elements. This ICT 2022 trading strategy is an algorithmic approach designed to analyze liquidity and imbalances in the market. It incorporates concepts such as Fair Value Gap (FVG), Liquidity Sweep, and Market Structure Shift (MSS) to help traders identify liquidity movements and structural changes in the market, enabling them to determine optimal entry and exit points for their trades.
This Full ICT Day Trading Model empowers traders to pinpoint the Previous Day High/Low as well as the highs and lows of critical sessions like the London and New York sessions. These levels act as Liquidity Zones, which are frequently swept prior to a market structure shift (MSS) or a retracement to areas such as Optimal Trade Entry (OTE).
Bullish :
Bearish :
🔵 How to Use
The ICT 2022 model is a sophisticated trading strategy that focuses on identifying key liquidity levels and price movements. It operates based on two main principles. In the first phase, the price approaches liquidity zones and sweeps critical levels such as the previous day’s high or low and key session levels.
This movement is known as a Liquidity Sweep. In the second phase, following the sweep, the price retraces to areas like the FVG (Fair Value Gap), creating ideal entry points for trades. Below is a detailed explanation of how to apply this strategy in bullish and bearish setups.
🟣 Bullish ICT 2022 Model Setup
To use the ICT 2022 model in a bullish setup, start by identifying the Previous Day High/Low or key session levels, such as those of the London or New York sessions. In a bullish setup, the price usually moves downward first, sweeping the Liquidity Low. This move, known as a Liquidity Sweep, reflects the collection of buy orders by major market participants.
After the liquidity sweep, the price should shift market structure and start moving upward; this shift, referred to as Market Structure Shift (MSS), signals the beginning of an upward trend. Following MSS, areas like FVG, located within the Discount Zone, are identified. At this stage, the trader waits for the price to retrace to these zones. Once the price returns, a long trade is executed.
Finally, the stop-loss should be set below the liquidity low to manage risk, while the take-profit target is usually placed above the previous day’s high or other identified liquidity levels. This structure enables traders to take advantage of the upward price movement after the liquidity sweep.
🟣 Bearish ICT 2022 Model Setup
To identify a bearish setup in the ICT 2022 model, begin by marking the Previous Day High/Low or key session levels, such as the London or New York sessions. In this scenario, the price typically moves upward first, sweeping the Liquidity High. This move, known as a Liquidity Sweep, signifies the collection of sell orders by key market players.
After the liquidity sweep, the price should shift market structure downward. This movement, called the Market Structure Shift (MSS), indicates the start of a downtrend. Following MSS, areas such as FVG, found within the Premium Zone, are identified. At this stage, the trader waits for the price to retrace to these areas. Once the price revisits these zones, a short trade is executed.
In this setup, the stop-loss should be placed above the liquidity high to control risk, while the take-profit target is typically set below the previous day’s low or another defined liquidity level. This approach allows traders to capitalize on the downward price movement following the liquidity sweep.
🔵 Settings
Swing period : You can set the swing detection period.
Max Swing Back Method : It is in two modes "All" and "Custom". If it is in "All" mode, it will check all swings, and if it is in "Custom" mode, it will check the swings to the extent you determine.
Max Swing Back : You can set the number of swings that will go back for checking.
FVG Length : Default is 120 Bar.
MSS Length : Default is 80 Bar.
FVG Filter : This refines the number of identified FVG areas based on a specified algorithm to focus on higher quality signals and reduce noise.
Types of FVG filters :
Very Aggressive Filter: Adds a condition where, for an upward FVG, the last candle's highest price must exceed the middle candle's highest price, and for a downward FVG, the last candle's lowest price must be lower than the middle candle's lowest price. This minimally filters out FVGs.
Aggressive Filter: Builds on the Very Aggressive mode by ensuring the middle candle is not too small, filtering out more FVGs.
Defensive Filter: Adds criteria regarding the size and structure of the middle candle, requiring it to have a substantial body and specific polarity conditions, filtering out a significant number of FVGs.
Very Defensive Filter: Further refines filtering by ensuring the first and third candles are not small-bodied doji candles, retaining only the highest quality signals.
🔵 Conclusion
The ICT 2022 model is a comprehensive and advanced trading strategy designed around key concepts such as liquidity, price imbalance, and market structure shifts (MSS). By focusing on the sweep of critical levels such as the previous day’s high/low and important trading sessions like London and New York, this strategy enables traders to predict market movements with greater precision.
The use of tools like FVG in this model helps traders fine-tune their entry and exit points and take advantage of bullish and bearish trends after liquidity sweeps. Moreover, combining this strategy with precise timing during key trading sessions allows traders to minimize risk and maximize returns.
In conclusion, the ICT 2022 model emphasizes the importance of time and liquidity, making it a powerful tool for both professional and novice traders. By applying the principles of this model, you can make more informed trading decisions and seize opportunities in financial markets more effectively.

Fair Value Gap [by Oberlunar]Fair Value Gap
This indicator is designed to identify and display Fair Value Gaps (FVG) on the price chart. Fair Value Gaps are areas between candles where the price lacks continuity, leaving a "gap" that can serve as a reference point for price retracements. These zones are often considered important by traders as they represent market imbalances that tend to be "mitigated" (i.e., filled or tested) over time.
Purpose of Publication
This indicator addresses a common gap in FVG indicators. Most existing FVG indicators do not visually distinguish between mitigated (touched) FVGs and those that remain intact. With this indicator:
Mitigated FVGs are clearly displayed with distinct colors, allowing traders to identify which zones have been partially or fully filled by the price.
Unmitigated FVGs remain prominent, representing potential points of interest.
Key Features
Identification of Fair Value Gaps:
A Bullish FVG (upward gap) forms when the high of the three previous candles (candle -3) is lower than the low of the next candle (candle -1).
A Bearish FVG (downward gap) forms when the low of the three previous candles (candle -3) is higher than the high of the next candle (candle -1).
Dynamic Coloring:
Unmitigated FVGs are highlighted with specific colors: green for Bullish and red for Bearish gaps.
When an FVG is "touched" by the price (i.e., mitigated), the color changes:
Yellow-green for mitigated Bullish FVGs.
Purple for mitigated Bearish FVGs.
Handling Mitigated FVGs:
When an FVG is touched by the price, it is visually updated with a different color.
An option can be enabled to "shrink" the mitigated zone, adjusting the box to reflect the remaining untested portion of the gap.
Customization:
Configure the maximum number of FVGs to display on the chart.
Set specific colors for mitigated and unmitigated FVGs.
Choose whether to automatically shrink mitigated zones.
How to Identify Support and Resistance Levels
Support:
Bullish FVGs represent potential support levels, as they indicate areas where the price might return to seek liquidity or fill the imbalance.
An FVG that is repeatedly touched without being fully filled becomes a significant support zone.
Resistance:
Bearish FVGs represent potential resistance levels, indicating zones where the price might stall or reverse direction.
Why a Repeatedly Mitigated FVG is Significant
When an FVG is touched or mitigated multiple times, it means the market recognizes that area as significant. This can happen for several reasons:
Accumulation or Distribution: Institutional traders may use these zones to accumulate or distribute positions without causing excessive market movement.
Presence of Liquidity: FVGs often represent areas with pending orders (stop-losses, limit orders), and the price revisits these zones to seek liquidity.
Market Equilibrium: When an FVG is repeatedly filled, it indicates the market's attempt to balance a demand-supply imbalance. This makes the zone an important level to monitor for potential breakouts or reversals.

Breakaway Fair Value Gaps [LuxAlgo]The Breakaway Fair Value Gap (FVG) is a typical FVG located at a point where the price is breaking new Highs or Lows.
🔶 USAGE
In the screenshot above, the price range is visualized by Donchian Channels.
In theory, the Breakaway FVGs should generally be a good indication of market participation, showing favor in the FVG's breaking direction. This is a combination of buyers or sellers pushing markets quickly while already at the highest high or lowest low in recent history.
While this described reasoning seems conventional, looking into it inversely seems to reveal a more effective use of these formations.
When the price is pushed to the extremities of the current range, the price is already potentially off balance and over-extended. Then an FVG is created, extending the price further out of balance.
With this in consideration, After identifying a Breakaway FVG, we could logically look for a reversion to re-balance the gap.
However, it would be illogical to believe that the FVG will immediately mitigate after formation. Because of this, the dashboard display for this indicator shows the analysis for the mitigation likelihood and timeliness.
In the example above, the information in the dashboard would read as follows (Bearish example):
Out of 949 Bearish Breakaway FVGs, 80.19% are shown to be mitigated within 60 bars, with the average mitigation time being 13 bars.
The other 19.81% are not mitigated within 60 bars. This could mean the FVG was mitigated after 60 bars, or it was never mitigated.
The unmitigated FVGs within the analysis window will extend their mitigation level to the current bar. We can see the number of bars since the formation is represented to the right of the live mitigation level.
Utilizing the current distance readout helps to better judge the likelihood of a level being mitigated.
Additionally, when considering these mitigation levels as targets, an additional indicator or analysis can be used to identify specific entries, which would further aid in a system's reliability.
🔶 SETTINGS
Trend Length: Sets the (DC) Trend length to use for Identifying Breakaway FVGs.
Show Mitigation Levels: Optionally hide mitigation levels if you would prefer only to see the Breakaway FVGs.
Maximum Duration: Sets the analysis duration for FVGs, Past this length in bars, the FVG is counted as "Un-Mitigated".
Show Dashboard: Optionally hide the dashboard.
Use Median Duration: Display the Median of the Bar Length data set rather than the Average.

Ultra Market StructureThe Ultra Market Structure indicator detects key market structure breaks, such as Break of Structure (BoS) and Change of Character (CHoCH), to help identify trend reversals. It plots lines and labels on the chart to visualize these breakpoints with alerts for important signals.
Introduction
This script is designed to help traders visualize important market structure events, such as trend breaks and reversals, using concepts like Break of Structure (BoS) and Change of Character (CHoCH). The indicator highlights internal and external price levels where the market shifts direction. It offers clear visual signals and alerts to keep traders informed of potential changes in the market trend.
Detailed Description
The indicator focuses on detecting "market structure breaks," which occur when the price moves past significant support or resistance levels, suggesting a potential reversal or continuation of the trend.
.........
Type of structure
Internal Structure: Focuses on smaller, shorter-term price levels within the current market trend.
External Structure: Focuses on larger, longer-term price levels that may indicate more significant shifts in the market.
.....
Key events
Break of Structure (BoS): A market structure break where the price surpasses a previous high (bullish BoS) or low (bearish BoS).
Change of Character (CHoCH): A shift in market behavior when the price fails to continue in the same direction, indicating a possible trend reversal.
Once a break or shift is detected, the script plots lines and labels on the chart to visually mark the breakpoints.
It also provides alerts when a BoS or CHoCH occurs, keeping traders informed in real-time.
The indicator can color the background and candles based on the market structure, making it easy to identify the current trend.
.....
Special feature
At news events or other momentum pushes most structure indicators will go into "sleep mode" because of too far away structure highs/lows. This indicator has a structure reset feature to solve this issue.
.........
Detects Break of Structure (BoS) and Change of Character (CHoCH) signals.
Marks internal and external support/resistance levels where market trends change.
Provides visual cues (lines, labels) and real-time alerts for structure breaks.
Offers background and candle color customization to highlight market direction.

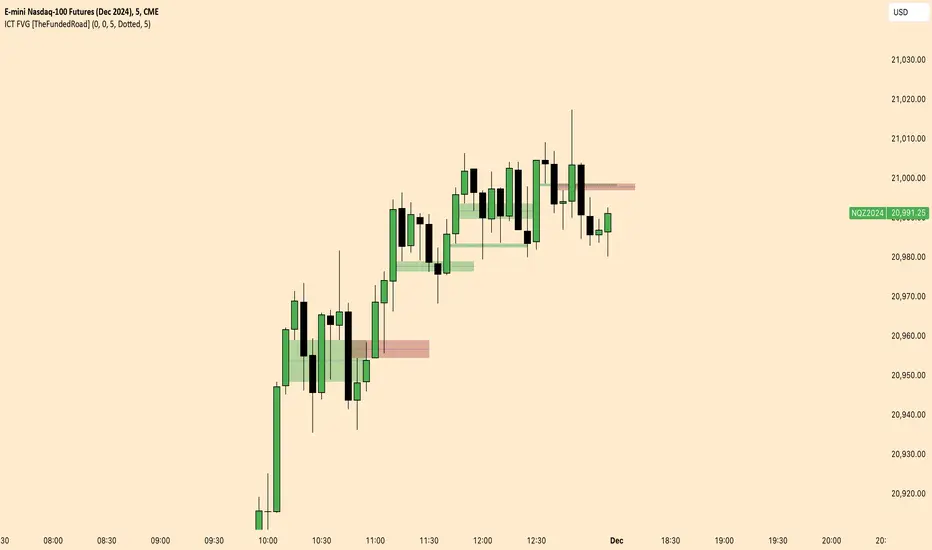
ICT FVG [TheFundedRoad]This indicator shows you all ICT Fair value gaps on chart with midpoint line
Fair value gap is a gap in a set of 3 candles, in a bullish FVG you have 1st candle high being lower than third candle low, and in a bearish FVG you have first candle low higher than third candle high, thats how this indicator finds these fair value gaps
It draws the fair value gap from the 2nd candle forward
You can customize the color and if you want to see the midpoint or not, midpoint is 50% of the gap
ICT Candle Block (fadi)ICT Candle Block
When trading using ICT concepts, it is often beneficial to treat consecutive candles of the same color as a single entity. This approach helps traders identify Order Blocks, liquidity voids, and other key trading signals more effectively.
However, in situations where the market becomes choppy or moves slowly, recognizing continuous price movement can be challenging.
The ICT Candle Block indicator addresses these challenges by combining consecutive candles of the same color into a single entity. It redraws the resulting candles, making price visualization much easier and helping traders quickly identify key trading signals.
FVGs and Blocks
In the above snapshot, FVGs/Liquidity Voids, Order Blocks, and Breaker Blocks are easily identified. By analyzing the combined candles, traders can quickly determine the draw on liquidity and potential price targets using ICT concepts.
Unlike traditional higher timeframes that rigidly combine lower timeframe candles based on specific start and stop times, this indicator operates as a "mixed timeframe." It combines all buying and all selling activities into a single candle, regardless of when the transactions started and ended.
Limitations
There are currently TradingView limitations that affect the functionality of this indicator:
TradingView does not have a Candle object; therefore, this indicator relies on using boxes and lines to mimic the candles. This results in wider candles than expected, leading to misalignment with the time axis below (plotcandle is not the answer).
There is a limit on the number of objects that can be drawn on a chart. A maximum of 500 candles has been set.
A rendering issue may cause a sideways box to appear across the chart. This is a display bug in TradingView; scroll to the left until it clears.

Noise Footprint ImbalanceNoise Footprint Imbalance Indicator
The Noise Footprint Imbalance Indicator highlights areas of imbalance in price action, marking potential zones of support and resistance. This indicator helps traders visualize "footprints" of imbalance on the chart, allowing for better identification of areas where price moves significantly away from equilibrium. This can help traders pinpoint potential reversal points or zones where buyers or sellers may step in.
Features
Customizable Box Count: Choose the maximum number of imbalance zones displayed on the chart, keeping your workspace clear and focused.
Imbalance Detection: Highlights both top and bottom imbalances, identifying them based on price discrepancies between open/close and high/low levels.
Dynamic Zone Boxes: Draws boxes around imbalance zones with customizable colors and transparency, providing visual clarity without overwhelming the chart.
Usage
This indicator is beneficial for traders who:
Use imbalance zones as potential areas of interest for entries or exits.
Want to combine it with other indicators or price action analysis to improve trade setups.
Customization Options
Maximum Imbalance Zones: Adjusts the maximum number of imbalance boxes shown.
Imbalance Box Color: Customize the color and transparency of the imbalance zones to suit your chart's theme.
Add this script to your chart to enhance your technical analysis and bring more structure to your trading approach with the Noise Footprint Imbalance Indicator.

Silver Bullet ICT Strategy [TradingFinder] 10-11 AM NY Time +FVG🔵 Introduction
The ICT Silver Bullet trading strategy is a precise, time-based algorithmic approach that relies on Fair Value Gaps and Liquidity to identify high-probability trade setups. The strategy primarily focuses on the New York AM Session from 10:00 AM to 11:00 AM, leveraging heightened market activity within this critical window to capture short-term trading opportunities.
As an intraday strategy, it is most effective on lower timeframes, with ICT recommending a 15-minute chart or lower. While experienced traders often utilize 1-minute to 5-minute charts, beginners may find the 1-minute timeframe more manageable for applying this strategy.
This approach specifically targets quick trades, designed to take advantage of market movements within tight one-hour windows. By narrowing its focus, the Silver Bullet offers a streamlined and efficient method for traders to capitalize on liquidity shifts and price imbalances with precision.
In the fast-paced world of forex trading, the ability to identify market manipulation and false price movements is crucial for traders aiming to stay ahead of the curve. The Silver Bullet Indicator simplifies this process by integrating ICT principles such as liquidity traps, Order Blocks, and Fair Value Gaps (FVG).
These concepts form the foundation of a tool designed to mimic the strategies of institutional players, empowering traders to align their trades with the "smart money." By transforming complex market dynamics into actionable insights, the Silver Bullet Indicator provides a powerful framework for short-term trading success
Silver Bullet Bullish Setup :
Silver Bullet Bearish Setup :
🔵 How to Use
The Silver Bullet Indicator is a specialized tool that operates within the critical time windows of 9:00-10:00 and 10:00-11:00 in the forex market. Its design incorporates key principles from ICT (Inner Circle Trader) methodology, focusing on concepts such as liquidity traps, CISD Levels, Order Blocks, and Fair Value Gaps (FVG) to provide precise and actionable trade setups.
🟣 Bullish Setup
In a bullish setup, the indicator starts by marking the high and low of the session, serving as critical reference points for liquidity. A typical sequence involves a liquidity grab below the low, where the price manipulates retail traders into selling positions by breaching a key support level.
This movement is often orchestrated by smart money to accumulate buy orders. Following this liquidity grab, a market structure shift (MSS) occurs, signaled by the price breaking the CISD Level—a confirmation of bullish intent. The indicator then highlights an Order Block near the CISD Level, representing the zone where institutional buying is concentrated.
Additionally, it identifies a Fair Value Gap, which acts as a high-probability area for price retracement and trade entry. Traders can confidently take long positions when the price revisits these zones, targeting the next significant liquidity pool or resistance level.
Bullish Setup in CAPITALCOM:US100 :
🟣 Bearish Setup
Conversely, in a bearish setup, the price manipulates liquidity by creating a false breakout above the high of the session. This move entices retail traders into long positions, allowing institutional players to enter sell orders.
Once the price reverses direction and breaches the CISD Level to the downside, a change of character (CHOCH) becomes evident, confirming a bearish market structure. The indicator highlights an Order Block near this level, indicating the origin of the institutional sell orders, along with an associated FVG, which represents an imbalance zone likely to be revisited before the price continues downward.
By entering short positions when the price retraces to these levels, traders align their strategies with the anticipated continuation of bearish momentum, targeting nearby liquidity voids or support zones.
Bearish Setup in OANDA:XAUUSD :
🔵 Settings
Refine Order Block : Enables finer adjustments to Order Block levels for more accurate price responses.
Mitigation Level OB : Allows users to set specific reaction points within an Order Block, including: Proximal: Closest level to the current price. 50% OB: Midpoint of the Order Block. Distal: Farthest level from the current price.
FVG Filter : The Judas Swing indicator includes a filter for Fair Value Gap (FVG), allowing different filtering based on FVG width: FVG Filter Type: Can be set to "Very Aggressive," "Aggressive," "Defensive," or "Very Defensive." Higher defensiveness narrows the FVG width, focusing on narrower gaps.
Mitigation Level FVG : Like the Order Block, you can set price reaction levels for FVG with options such as Proximal, 50% OB, and Distal.
CISD : The Bar Back Check option enables traders to specify the number of past candles checked for identifying the CISD Level, enhancing CISD Level accuracy on the chart.
🔵 Conclusion
The Silver Bullet Indicator is a cutting-edge tool designed specifically for forex traders who aim to leverage market dynamics during critical liquidity windows. By focusing on the highly active 9:00-10:00 and 10:00-11:00 timeframes, the indicator simplifies complex market concepts such as liquidity traps, Order Blocks, Fair Value Gaps (FVG), and CISD Levels, transforming them into actionable insights.
What sets the Silver Bullet Indicator apart is its precision in detecting false breakouts and market structure shifts (MSS), enabling traders to align their strategies with institutional activity. The visual clarity of its signals, including color-coded zones and directional arrows, ensures that both novice and experienced traders can easily interpret and apply its findings in real-time.
By integrating ICT principles, the indicator empowers traders to identify high-probability entry and exit points, minimize risk, and optimize trade execution. Whether you are capturing short-term price movements or navigating complex market conditions, the Silver Bullet Indicator offers a robust framework to enhance your trading performance.
Ultimately, this tool is more than just an indicator; it is a strategic ally for traders who seek to decode the movements of smart money and capitalize on institutional strategies. With the Silver Bullet Indicator, traders can approach the market with greater confidence, precision, and profitability.

ICT Setup 03 [TradingFinder] Judas Swing NY 9:30am + CHoCH/FVG🔵 Introduction
Judas Swing is an advanced trading setup designed to identify false price movements early in the trading day. This advanced trading strategy operates on the principle that major market players, or "smart money," drive price in a certain direction during the early hours to mislead smaller traders.
This deceptive movement attracts liquidity at specific levels, allowing larger players to execute primary trades in the opposite direction, ultimately causing the price to return to its true path.
The Judas Swing setup functions within two primary time frames, tailored separately for Forex and Stock markets. In the Forex market, the setup uses the 8:15 to 8:30 AM window to identify the high and low points, followed by the 8:30 to 8:45 AM frame to execute the Judas move and identify the CISD Level break, where Order Block and Fair Value Gap (FVG) zones are subsequently detected.
In the Stock market, these time frames shift to 9:15 to 9:30 AM for identifying highs and lows and 9:30 to 9:45 AM for executing the Judas move and CISD Level break.
Concepts such as Order Block and Fair Value Gap (FVG) are crucial in this setup. An Order Block represents a chart region with a high volume of buy or sell orders placed by major financial institutions, marking significant levels where price reacts.
Fair Value Gap (FVG) refers to areas where price has moved rapidly without balance between supply and demand, highlighting zones of potential price action and future liquidity.
Bullish Setup :
Bearish Setup :
🔵 How to Use
The Judas Swing setup enables traders to pinpoint entry and exit points by utilizing Order Block and FVG concepts, helping them align with liquidity-driven moves orchestrated by smart money. This setup applies two distinct time frames for Forex and Stocks to capture early deceptive movements, offering traders optimized entry or exit moments.
🟣 Bullish Setup
In the Bullish Judas Swing setup, the first step is to identify High and Low points within the initial time frame. These levels serve as key points where price may react, forming the basis for analyzing the setup and assisting traders in anticipating future market shifts.
In the second time frame, a critical stage of the bullish setup begins. During this phase, the price may create a false break or Fake Break below the low level, a deceptive move by major players to absorb liquidity. This false move often causes smaller traders to enter positions incorrectly. After this fake-out, the price reverses upward, breaking the CISD Level, a critical point in the market structure, signaling a potential bullish trend.
Upon breaking the CISD Level and reversing upward, the indicator identifies both the Order Block and Fair Value Gap (FVG). The Order Block is an area where major players typically place large buy orders, signaling potential price support. Meanwhile, the FVG marks a region of supply-demand imbalance, signaling areas where price might react.
Ultimately, after these key zones are identified, a trader may open a buy position if the price reaches one of these critical areas—Order Block or FVG—and reacts positively. Trading at these levels enhances the chance of success due to liquidity absorption and support from smart money, marking an opportune time for entering a long position.
🟣 Bearish Setup
In the Bearish Judas Swing setup, analysis begins with marking the High and Low levels in the initial time frame. These levels serve as key zones where price could react, helping to signal possible trend reversals. Identifying these levels is essential for locating significant bearish zones and positioning traders to capitalize on downward movements.
In the second time frame, the primary bearish setup unfolds. During this stage, price may exhibit a Fake Break above the high, causing a brief move upward and misleading smaller traders into incorrect positions. After this false move, the price typically returns downward, breaking the CISD Level—a crucial bearish trend indicator.
With the CISD Level broken and a bearish trend confirmed, the indicator identifies the Order Block and Fair Value Gap (FVG). The Bearish Order Block is a region where smart money places significant sell orders, prompting a negative price reaction. The FVG denotes an area of supply-demand imbalance, signifying potential selling pressure.
When the price reaches one of these critical areas—the Bearish Order Block or FVG—and reacts downward, a trader may initiate a sell position. Entering trades at these levels, due to increased selling pressure and liquidity absorption, offers traders an advantage in profiting from price declines.
🔵 Settings
Market : The indicator allows users to choose between Forex and Stocks, automatically adjusting the time frames for the "Opening Range" and "Trading Permit" accordingly: Forex: 8:15–8:30 AM for identifying High and Low points, and 8:30–8:45 AM for capturing the Judas move and CISD Level break. Stocks: 9:15–9:30 AM for identifying High and Low points, and 9:30–9:45 AM for executing the Judas move and CISD Level break.
Refine Order Block : Enables finer adjustments to Order Block levels for more accurate price responses.
Mitigation Level OB : Allows users to set specific reaction points within an Order Block, including: Proximal: Closest level to the current price. 50% OB: Midpoint of the Order Block. Distal: Farthest level from the current price.
FVG Filter : The Judas Swing indicator includes a filter for Fair Value Gap (FVG), allowing different filtering based on FVG width: FVG Filter Type: Can be set to "Very Aggressive," "Aggressive," "Defensive," or "Very Defensive." Higher defensiveness narrows the FVG width, focusing on narrower gaps.
Mitigation Level FVG : Like the Order Block, you can set price reaction levels for FVG with options such as Proximal, 50% OB, and Distal.
CISD : The Bar Back Check option enables traders to specify the number of past candles checked for identifying the CISD Level, enhancing CISD Level accuracy on the chart.
🔵 Conclusion
The Judas Swing indicator helps traders spot reliable trading opportunities by detecting false price movements and key levels such as Order Block and FVG. With a focus on early market movements, this tool allows traders to align with major market participants, selecting entry and exit points with greater precision, thereby reducing trading risks.
Its extensive customization options enable adjustments for various market types and trading conditions, giving traders the flexibility to optimize their strategies. Based on ICT techniques and liquidity analysis, this indicator can be highly effective for those seeking precision in their entry points.
Overall, Judas Swing empowers traders to capitalize on significant market movements by leveraging price volatility. Offering precise and dependable signals, this tool presents an excellent opportunity for enhancing trading accuracy and improving performance

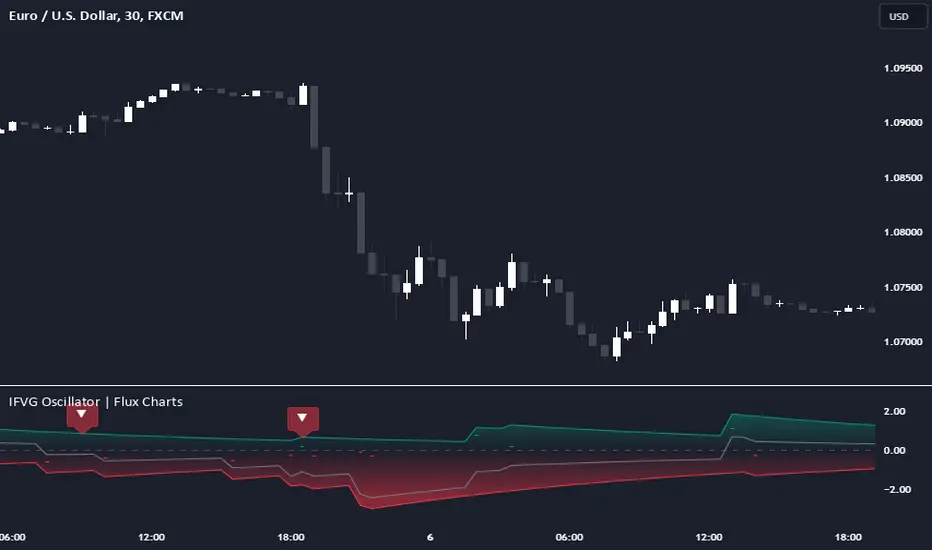
Inversion Fair Value Gap Oscillator | Flux Charts💎 GENERAL OVERVIEW
Introducing the new Inversion Fair Value Gap Oscillator (IFVG Oscillator) indicator! This unique indicator identifies and tracks Inversion Fair Value Gaps (IFVGs) in price action, presenting them in an oscillator format to reveal market momentum based on IFVG strength. It highlights bullish and bearish IFVGs while enabling traders to adjust detection sensitivity and apply volume and ATR-based filters for more precise setups. For more information about the process, check the "📌 HOW DOES IT WORK" section.
Features of the new IFVG Oscillator:
Fully Customizable FVG & IFVG Detection
An Oscillator Approach To IFVGs
Divergence Markers For Potential Reversals
Alerts For Divergence Labels
Customizable Styling
📌 HOW DOES IT WORK?
Fair Value Gaps are price gaps within bars that indicate inefficiencies, often filled as the market retraces. An Inversion Fair Value Gap is created in the opposite direction once a FVG gets invalidated. The IFVG Oscillator scans historical bars to identify these gaps, then filters them based on ATR or volume. Each IFVG is marked as bullish or bearish according to the opposite direction of the original FVG that got invalidated.
An oscillator is calculated using recent IFVGs with this formula :
1. The Oscillator starts as 0.
2. When a new IFVG Appears, it contributes (IFVG Width / ATR) to the oscillator of the corresponding type.
3. Each confirmed bar, the oscillator is recalculated as OSC = OSC * (1 - Decay Coefficient)
The oscillator aggregates and decays past IFVGs, allowing recent IFVG activity to dominate the signal. This approach emphasizes current market momentum, with oscillations moving bullish or bearish based on IFVG intensity. Divergences are marked where IFVG oscillations suggest potential reversals. Bullish Divergence conditions are as follows :
1. The current candlestick low must be the lowest of last 25 bars.
2. Net Oscillator (Shown in gray line by default) must be > 0.
3. The current Bullish IFVG Oscillator value should be no more than 0.1 below the highest value from the last 25 bars.
Traders can use divergence signals to get an idea of potential reversals, and use the Net IFVG Oscillator as a trend following marker.
🚩 UNIQUENESS
The Inversion Fair Value Gap Oscillator stands out by converting IFVG activity into an oscillator format, providing a momentum-based visualization of IFVGs that reveals market sentiment dynamically. Unlike traditional indicators that statically mark IFVG zones, the oscillator decays older IFVGs over time, showing only the most recent, relevant activity. This approach allows for real-time insight into market conditions and potential reversals based on oscillating IFVG strength, making it both intuitive and powerful for momentum trading.
Another unique feature is the combination of customizable ATR and volume filters, letting traders adapt the indicator to match their strategy and market type. You can also set-up alerts for bullish & bearish divergences.
⚙️ SETTINGS
1. General Configuration
Decay Coefficient -> The decay coefficient for oscillators. Increasing this setting will result in oscillators giving the weight to recent IFVGs, while decreasing it will distribute the weight equally to the past and recent IFVGs.
2. Fair Value Gaps
Zone Invalidation -> Select between Wick & Close price for FVG Zone Invalidation.
Zone Filtering -> With "Average Range" selected, algorithm will find FVG zones in comparison with average range of last bars in the chart. With the "Volume Threshold" option, you may select a Volume Threshold % to spot FVGs with a larger total volume than average.
FVG Detection -> With the "Same Type" option, all 3 bars that formed the FVG should be the same type. (Bullish / Bearish). If the "All" option is selected, bar types may vary between Bullish / Bearish.
Detection Sensitivity -> You may select between Low, Normal or High FVG detection sensitivity. This will essentially determine the size of the spotted FVGs, with lower sensitivies resulting in spotting bigger FVGs, and higher sensitivies resulting in spotting all sizes of FVGs.
3. Inversion Fair Value Gaps
Zone Invalidation -> Select between Wick & Close price for IFVG Zone Invalidation.
4. Style
Divergence Labels On -> You can switch divergence labels to show up on the chart or the oscillator plot.
Implied Fair Value Gap (IFVG) ICT [TradingFinder] Hidden FVG OTE🔵 Introduction
The Implied Fair Value Gap (IFVG) is distinctive due to its unique three-candlestick formation, which differentiates it from conventional Fair Value Gaps.
Implied fair value represents an estimated worth of an asset—often a business or its goodwill—based on the price likely to be received in a structured transaction between market participants at a specific point in time.
In the ever-evolving world of technical analysis, pinpointing price reversal points and market anomalies can significantly enhance trading strategies and decision-making for traders and investors. Among the advanced concepts gaining traction in this field is the Implied Fair Value Gap (IFVG), introduced by the renowned analyst Inner Circle Trader (ICT).
This tool has proven to be an effective method for identifying hidden supply and demand zones in financial markets, offering a unique edge to traders looking for high-probability setups.
Unlike traditional gaps that are visible on price charts, IFVG is a hidden gap that doesn’t appear explicitly on the chart and thus requires specialized technical analysis tools for accurate identification.
This hidden gap can signal potential price reversals and offers traders insight into high-liquidity areas where price is likely to react. This article will guide you through using the ICT Implied Fair Value Gap Indicator effectively, covering its settings, usage strategies, and key features to help you make informed decisions in the market.
🟣 Bullish Implied FVG
🟣 Bearish Implied FVG
🔵 How to Use
The IFVG indicator is designed to assist traders in recognizing hidden support and resistance zones by identifying Bullish and Bearish IFVG patterns. With this tool, traders can make better-informed decisions about suitable entry and exit points for their trades based on these patterns.
🟣 Bullish Implied Fair Value Gap
This pattern occurs in an uptrend when a large bullish candlestick forms, with the wicks of the previous and following candles overlapping the body of the central candlestick.
This overlap creates a demand zone or a hidden support level, which can act as an ideal entry point for buy trades. Often, when the price returns to this area, it is likely to resume its upward trend, presenting a profitable buying opportunity.
🟣 Bearish Implied Fair Value Gap
This pattern is similar but forms in downtrends. Here, a large bearish candlestick appears on the chart, with the wicks of adjacent candles overlapping its body. This overlap defines a supply zone or a hidden resistance level and serves as a signal for potential sell trades.
When the price returns to this zone, it often continues its downward trend, providing an optimal point for entering sell trades.
The IFVG indicator also includes various filters that traders can use to refine their analysis based on market conditions. These filters, including Very Aggressive, Aggressive, Defensive, and Very Defensive, allow users to customize the IFVG zones' width, offering flexibility according to the trader’s risk tolerance and trading style.
🟣 Example Trading Scenarios
Suppose you’re in a strong uptrend and the IFVG indicator identifies a Bullish IFVG zone. In this scenario, you could consider entering a buy trade when the price retraces to this zone, expecting the uptrend to resume. Conversely, in a downtrend, a Bearish IFVG zone can signal a favorable entry point for short trades when the price revisits this area.
🔵 Settings
Implied Block Validity Period: This parameter specifies the validity period of each identified block, taking into account the number of bars that have passed since its formation. Proper adjustment of this period helps traders focus only on relevant zones, increasing the accuracy of the analysis.
Mitigation Level OB : This option defines the mitigation level for supply and demand blocks (Order Blocks), with settings including Proximal, 50% OB, and Distal.
Depending on the selected level, the indicator will focus on closer, mid-range, or farther points for block identification, allowing traders to adjust for the level of precision required.
Implied Filter : Activating this filter allows traders to apply conditions based on the width of the IFVG zones. With options like Very Aggressive and Very Defensive, traders can control the width of IFVG zones to suit their risk management strategy—whether they prefer high-risk setups or low-risk setups.
Display and Color Settings : This section enables users to customize the appearance of the IFVG zones on their charts. Traders can set different colors for Bullish and Bearish zones, allowing for easier distinction and improved visualization.
Alert Settings : One of the standout features of the IFVG indicator is the alert system. By setting up alerts, users can be notified whenever the price approaches a demand or supply zone.
Alerts can be customized to trigger Once Per Bar (one alert per bar) or Per Bar Close (alert at the close of each bar), ensuring that traders stay updated on critical price movements without needing to monitor the chart continuously.
🔵 Conclusion
The ICT Implied Fair Value Gap (IFVG) indicator is a powerful and sophisticated tool in technical analysis, allowing professional traders to identify hidden supply and demand zones and use them as entry and exit points for buy and sell trades.
This indicator’s automatic detection of IFVG zones helps traders uncover hidden trading opportunities that can enhance their analysis.
While the IFVG indicator offers numerous advantages, it is important to use it in conjunction with other technical analysis tools and sound risk management practices.
IFVG alone does not guarantee profitability in trading; it works best when combined with other indicators such as volume analysis and trend-following indicators for a comprehensive trading strategy.

Fair Value Gap Oscillator | Flux Charts💎 GENERAL OVERVIEW
Introducing the new Fair Value Gap Oscillator (FVG Oscillator) indicator! This unique indicator identifies and tracks Fair Value Gaps (FVGs) in price action, presenting them in an oscillator format to reveal market momentum based on FVG strength. It highlights bullish and bearish FVGs while enabling traders to adjust detection sensitivity and apply volume and ATR-based filters for more precise setups. For more information about the process, check the "📌 HOW DOES IT WORK" section.
Features of the new FVG Oscillator:
Fully Customizable FVG Detection
An Oscillator Approach To FVGs
Divergence Markers For Potential Reversals
Alerts For Divergence Labels
Customizable Styling
📌 HOW DOES IT WORK?
Fair Value Gaps are price gaps within bars that indicate inefficiencies, often filled as the market retraces. The FVG Oscillator scans historical bars to identify these gaps, then filters them based on ATR or volume. Each FVG is marked as bullish or bearish according to the trend direction that preceded its formation.
An oscillator is calculated using recent FVGs with this formula :
1. The Oscillator starts as 0.
2. When a new FVG Appears, it contributes (FVG Width / ATR) to the oscillator of the corresponding type.
3. Each confirmed bar, the oscillator is recalculated as OSC = OSC * (1 - Decay Coefficient)
The oscillator aggregates and decays past FVGs, allowing recent FVG activity to dominate the signal. This approach emphasizes current market momentum, with oscillations moving bullish or bearish based on FVG intensity. Divergences are marked where FVG oscillations suggest potential reversals. Bullish Divergence conditions are as follows :
1. The current candlestick low must be the lowest of last 25 bars.
2. Net Oscillator (Shown in gray line by default) must be > 0.
3. The current Bullish FVG Oscillator value should be no more than 0.1 below the highest value from the last 25 bars.
Traders can use divergence signals to get an idea of potential reversals, and use the Net FVG Oscillator as a trend following marker.
🚩 UNIQUENESS
The Fair Value Gap Oscillator stands out by converting FVG activity into an oscillator format, providing a momentum-based visualization of FVGs that reveals market sentiment dynamically. Unlike traditional indicators that statically mark FVG zones, the oscillator decays older FVGs over time, showing only the most recent, relevant activity. This approach allows for real-time insight into market conditions and potential reversals based on oscillating FVG strength, making it both intuitive and powerful for momentum trading.
Another unique feature is the combination of customizable ATR and volume filters, letting traders adapt the indicator to match their strategy and market type. You can also set-up alerts for bullish & bearish divergences.
⚙️ SETTINGS
1. General Configuration
Decay Coefficient -> The decay coefficient for oscillators. Increasing this setting will result in oscillators giving the weight to recent FVGs, while decreasing it will distribute the weight equally to the past and recent FVGs.
2. Fair Value Gaps
Zone Invalidation -> Select between Wick & Close price for FVG Zone Invalidation.
Zone Filtering -> With "Average Range" selected, algorithm will find FVG zones in comparison with average range of last bars in the chart. With the "Volume Threshold" option, you may select a Volume Threshold % to spot FVGs with a larger total volume than average.
FVG Detection -> With the "Same Type" option, all 3 bars that formed the FVG should be the same type. (Bullish / Bearish). If the "All" option is selected, bar types may vary between Bullish / Bearish.
Detection Sensitivity -> You may select between Low, Normal or High FVG detection sensitivity. This will essentially determine the size of the spotted FVGs, with lower sensitivies resulting in spotting bigger FVGs, and higher sensitivies resulting in spotting all sizes of FVGs.
3. Style
Divergence Labels On -> You can switch divergence labels to show up on the chart or the oscillator plot.

ICT Open Range Gap & 1st FVG (fadi)In his 2024 mentorship program, ICT detailed how price action interacts with Open Range Gaps and the initial 1-minute Fair Value Gap following the market open at 9:30 AM.
What is an Open Range Gap?
An Open Range Gap occurs when the market opens at 9:30 AM at a higher or lower level compared to the previous day's close at 4:14 PM, primarily relevant in futures trading. According to ICT, there is a statistical probability of 70% that the price action will close 50% or more of the Open Range Gap within the first 30 minutes of trading (9:30 AM to 10:00 AM).
What is the First 1-Minute Fair Value Gap?
ICT places significant emphasis on the first 1-minute Fair Value Gap (FVG) that forms after the market opens at 9:30 AM. The FVG must occur at 9:31 AM or later to be considered valid. This gap often presents key opportunities for traders, as it represents a temporary imbalance between supply and demand that the market seeks to correct.
Understanding and leveraging these patterns can enhance trading strategies by offering insights into potential price movements shortly after market open.
ICT Open Range Gap & 1st FVG
This indicator is engineered to identify and highlight the Open Range Gaps and the first 1-minute Fair Value Gap. Furthermore, it functions across multiple timeframes, from seconds to hours, catering to various trading preferences. This flexibility is particularly beneficial for traders who favor higher timeframes or wish to observe these patterns' application at broader intervals.
Settings
The Open Range Gap indicator offers flexible display settings. It identifies the quadrants and provides optional color coding to distinguish them. Additionally, it tracks the "fill" level to visualize how far the price action has progressed into the gap, enhancing traders' ability to monitor and analyze price movements effectively. By default, the Open Range Gap will stop extending at 10:00 AM; however, there is an option to continue extending until the end of the trading day.
The 1st Fair Value Gap (FVG) can be viewed on any timeframe the indicator is active on, offering various styling options to match each trader's preferences. While the 1st FVG is particularly relevant to the day it is created, previous 1st FVGs within the same week may provide additional value. This indicator allows traders to extend Monday's 1st FVG, marking the first FVG of the week, or to extend all 1st FVGs throughout the week.

Cumulative Volume Delta Strategy | Flux Charts💎 GENERAL OVERVIEW
Introducing the Cumulative Volume Delta Strategy (CVDS) Indicator, an advanced tool designed to enhance trading strategies by identifying potential trend reversals through volume dynamics. This script features integrated order block detection, Fair Value Gaps (FVGs), and a dynamic take-profit (TP) and stop-loss (SL) system. For an in-depth understanding of the strategy, refer to the "HOW DOES IT WORK?" section below.
Features of the new Cumulative Volume Delta Strategy (CVDS) Indicator :
Cumulative Volume Delta-based Strategy
Order Block and Fair Value Gap (FVG) Entry Methods
Dynamic TP/SL System
Customizable Risk Management Settings
Alerts for Buy, Sell, TP, and SL Signals
📌 HOW DOES IT WORK ?
The CVDS indicator operates by tracking the net volume difference between buyers and sellers to identify divergences that could indicate potential trend reversals. A cumulative volume delta (CVD) calculation is employed to measure the intensity of these divergences in relation to price movements. The net volume sum is reset every trading day (can be changed from the settings using the anchor period option), and divergences are detected when the cumulative volume crosses the 0-line over or under.
Once a significant divergence is detected, the indicator identifies breakout points, confirmed by either Fair Value Gaps (FVGs) or Order Blocks (OBs). Depending on your chosen entry mode, the indicator will trigger a buy or sell entry when the confirmation signal aligns with the breakout direction. Alerts for Buy, Sell, Take-Profit, and Stop-Loss are available.
Note that the indicator cannot run on 1-minute and 1-second charts, as it needs to get data from a lower timeframe. 1-minutes & 1-second timeframes are the minimum timeframes in their ranges respectively.
🚩 UNIQUENESS
What sets this indicator apart is the combination of volume divergence analysis with advanced price action tools like Fair Value Gaps (FVGs) and Order Blocks (OBs). The ability to choose between these methods, along with a dynamic TP/SL system that adapts based on volatility, provides flexibility for traders in any market condition. The backtesting dashboard provides metrics about the performance of the indicator. You can use it to tune the settings for best use in the current ticker. The CVD-based strategy ensures that trades are initiated only when meaningful divergences between volume and price occur, filtering out noise and increasing the likelihood of profitable trades.
⚙️ SETTINGS
1. General Configuration
Anchor Period: Time anchor period used in CVD calculation. This is essentially the period that the volume delta sum will be reset. Lower timeframes may result in more entries at the cost of less reliable results.
Entry Mode: Choose between FVGs or OBs to trigger your entries based on the confirmation signals.
Retracement Requirement: Enable to confirm the entry after a retracement toward the FVG or OB.
2. Fair Value Gaps
FVG Sensitivity: Modify the sensitivity of FVG detection, allowing for more or fewer gaps to be considered valid.
3. Order Blocks (OB)
Swing Length: Define the swing length to identify OB formations. Shorter lengths find smaller OBs, while longer lengths detect larger structures.
4. TP / SL
TP / SL Method:
a) Dynamic: The TP / SL zones will be auto-determined by the algorithm based on the Average True Range (ATR) of the current ticker.
b) Fixed : You can adjust the exact TP / SL ratios from the settings below.
Dynamic Risk: The risk you're willing to take if "Dynamic" TP / SL Method is selected. Higher risk usually means a better winrate at the cost of losing more if the strategy fails. This setting is has a crucial effect on the performance of the indicator, as different tickers may have different volatility so the indicator may have increased performance when this setting is correctly adjusted.

Candle Range Theory | Flux Charts💎 GENERAL OVERVIEW
Introducing our new Candle Range Theory Indicator! This powerful tool offers a strategy built around the Candle Range Theory, which analyzes market movements through the relative size and structure of price candles. For more information about the process, check the "HOW DOES IT WORK" section.
Features of the new Candle Range Theory Indicator :
Implementation of the Candle Range Theory
FVG & Order Block Entry Methods
2 Different TP / SL Methods
Customizable Execution Settings
Customizable Backtesting Dashboard
Alerts for Buy, Sell, TP & SL Signals
📌 HOW DOES IT WORK ?
The Candle Range Theory (CRT) indicator operates by identifying significant price movements through the relative size and structure of candlesticks. A key part of the strategy is determining large candles based on their range compared to the Average True Range (ATR) in a higher timeframe. Once identified, a breakout of either the high wick or the low wick of the large candle is required. This breakout is considered a liquidity grab. After that, the indicator waits for confirmation through Fair Value Gaps (FVGs) or Order Blocks (OBs). The confirmation structure must be the opposite direction of the breakout, for example if the high wick is broken, a bearish FVG is required for the short entry. After a confirmation signal is received, the indicator will trigger entry points based on your chosen entry method (FVG or OB), and exit points will be calculated using either a dynamic ATR-based TP/SL method or fixed percentages. Alerts for Buy, Sell, Take-Proft, and Stop-Loss are available.
🚩 UNIQUENESS
This indicator stands out because it combines two highly effective entry methods: Fair Value Gaps (FVGs) and Order Blocks (OBs). You can choose between these strategies depending on market conditions. Additionally, the dynamic TP/SL system uses the ticker's volatility to automatically calculate stop-loss and take-profit targets. The backtesting dashboard provides metrics about the performance of the indicator. You can use it to tune the settings for best use in the current tiker. The Candle Range Theory approach offers more flexibility compared to traditional indicators, allowing for better customization and control based on your risk tolerance.
⚙️ SETTINGS
1. General Configuration
Higher Timeframe: Customize the higher timeframe for analysis. Recommended combinations include M15 -> H4, H4 -> Daily, Daily -> Weekly, and Weekly -> Monthly.
HTF Candle Size: Define the size of the higher timeframe candles as Big, Normal, or Small to filter valid setups based on their range relative to ATR.
Entry Mode: Choose between FVGs and Order Blocks for your entry triggers.
Require Retracement: Enable this option if you want a retracement to the FVG or OB for entry confirmation.
Show HTF Candle Lines: Toggle to display the higher timeframe candle lines for better visual clarity.
2. Fair Value Gaps
FVG Sensitivity: You may select between Low, Normal, High or Extreme FVG detection sensitivity. This will essentially determine the size of the spotted FVGs, with lower sensitivities resulting in spotting bigger FVGs, and higher sensitivities resulting in spotting all sizes of FVGs.
3. Order Blocks
Swing Length: Swing length is used when finding order block formations. Smaller values will result in finding smaller order blocks.
4. TP / SL
TP / SL Method:
a) Dynamic: The TP / SL zones will be auto-determined by the algorithm based on the Average True Range (ATR) of the current ticker.
b) Fixed : You can adjust the exact TP / SL ratios from the settings below.
Dynamic Risk: The risk you're willing to take if "Dynamic" TP / SL Method is selected. Higher risk usually means a better winrate at the cost of losing more if the strategy fails. This setting is has a crucial effect on the performance of the indicator, as different tickers may have different volatility so the indicator may have increased performance when this setting is correctly adjusted.

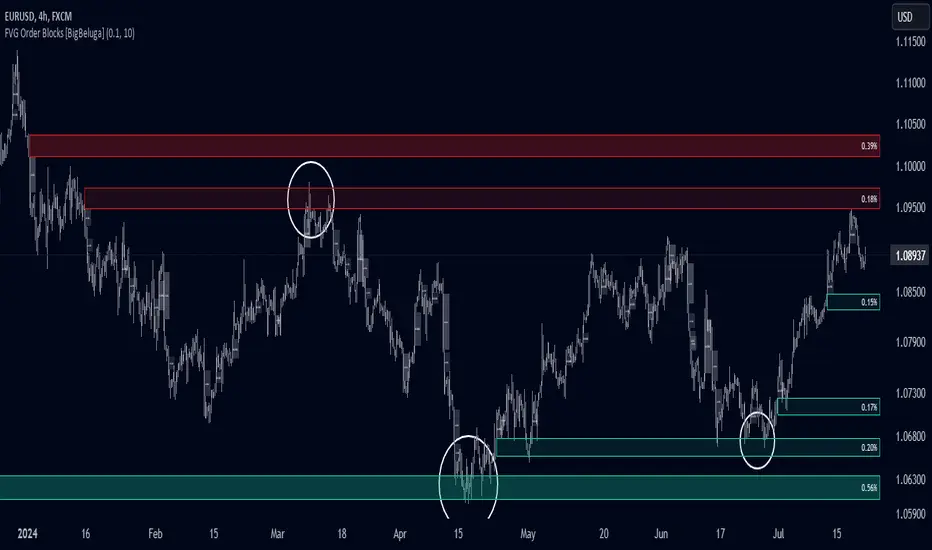
FVG Order Blocks [BigBeluga]This indicator is an advanced tool designed to detect and visualize market FVGs with order blocks, where the price action has created gaps due to strong buying or selling pressure. These FVG often act as critical support and resistance levels, giving traders strategic points for potential entries and exits. The indicator not only identifies these imbalances but also displays their relative strength by size %, helping traders prioritize order blocks that are more likely to hold or break.
The indicator works on various pairs and stocks, it also works on charts that do not provide volume data
Forex (JPY/USD):
Stocks (NVDA):
🔵 KEY FEATURES & USAGE
● FVGs Detection and Visualization:
The indicator detects bullish and bearish FVGs. Bullish FVG occur when there is significant buying, and order block is plotted below the FVG zone:
Conversely, bearish FVG are plotted with an order block above the zone, indicating potential resistance.
Traders can use these order blocks to anticipate price reactions when the market revisits these areas, making them ideal for setting up trades.
● FVG Filtering:
The indicator includes a FVG % filter that allows traders to only display strong order blocks. This ensures that only significant FVG order blocks are shown, reducing noise and focusing on the most impactful areas.
● Highlighting Broken Levels:
When an imbalance level is broken—either breached by price action or no longer relevant—the indicator can either delete the level or mark it with a gray color areas. This provides a clear visual cue that the level has been compromised, allowing traders to adjust their strategies accordingly.
● Order Blocks Signals:
When price retest the blocks, indicator display potential sell or buy signals. Which can be an opportunity for trades
🔵 CUSTOMIZATION
● FVG Filter:
Adjust the strength filter to control which FVGs are displayed based on their percentage size. This filter helps in focusing only on significant blocks that are likely to impact price action.
● Order Blocks Amount Displayed:
Set the maximum number of Order Blocks to be displayed on the chart. This customization helps keep the chart clean and ensures that only the most important blocks are in view.
● Broken Order Blocks Display:
Choose whether to display order blocks that have been broken by the price. This feature helps in maintaining a focus on blocks that are still valid while filtering out those that are no longer relevant.
● Color Customization:
You can customize the colors for bullish and bearish Order Blocks to match your chart's overall color scheme. Additionally, strength bars can be color-coded based on their percentage to quickly identify high-priority order blocks.
Traders who are confident in the settings of the indicator can confidently use it on various types of markets
ICT Judas Swing | Flux Charts💎 GENERAL OVERVIEW
Introducing our new ICT Judas Swing Indicator! This indicator is built around the ICT's "Judas Swing" strategy. The strategy looks for a liquidity grab around NY 9:30 session and a Fair Value Gap for entry confirmation. For more information about the process, check the "HOW DOES IT WORK" section.
Features of the new ICT Judas Swing :
Implementation of ICT's Judas Swing Strategy
2 Different TP / SL Methods
Customizable Execution Settings
Customizable Backtesting Dashboard
Alerts for Buy, Sell, TP & SL Signals
📌 HOW DOES IT WORK ?
The strategy begins by identifying the New York session from 9:30 to 9:45 and marking recent liquidity zones. These liquidity zones are determined by locating high and low pivot points: buyside liquidity zones are identified using high pivots that haven't been invalidated, while sellside liquidity zones are found using low pivots. A break of either buyside or sellside liquidity must occur during the 9:30-9:45 session, which is interpreted as a liquidity grab by smart money. The strategy assumes that after this liquidity grab, the price will reverse and move in the opposite direction. For entry confirmation, a fair value gap (FVG) in the opposite direction of the liquidity grab is required. A buyside liquidity grab calls for a bearish FVG, while a sellside grab requires a bullish FVG. Based on the type of FVG—bullish for buys and bearish for sells—the indicator will then generate a Buy or Sell signal.
After the Buy or Sell signal, the indicator immediately draws the take-profit (TP) and stop-loss (SL) targets. The indicator has three different TP & SL modes, explained in the "Settings" section of this write-up.
You can set up alerts for entry and TP & SL signals, and also check the current performance of the indicator and adjust the settings accordingly to the current ticker using the backtesting dashboard.
🚩 UNIQUENESS
This indicator is an all-in-one suit for the ICT's Judas Swing concept. It's capable of plotting the strategy, giving signals, a backtesting dashboard and alerts feature. Different and customizable algorithm modes will help the trader fine-tune the indicator for the asset they are currently trading. Three different TP / SL modes are available to suit your needs. The backtesting dashboard allows you to see how your settings perform in the current ticker. You can also set up alerts to get informed when the strategy is executable for different tickers.
⚙️ SETTINGS
1. General Configuration
Swing Length -> The swing length for pivot detection. Higher settings will result in
FVG Detection Sensitivity -> You may select between Low, Normal, High or Extreme FVG detection sensitivity. This will essentially determine the size of the spotted FVGs, with lower sensitivies resulting in spotting bigger FVGs, and higher sensitivies resulting in spotting all sizes of FVGs.
2. TP / SL
TP / SL Method ->
a) Dynamic: The TP / SL zones will be auto-determined by the algorithm based on the Average True Range (ATR) of the current ticker.
b) Fixed : You can adjust the exact TP / SL ratios from the settings below.
Dynamic Risk -> The risk you're willing to take if "Dynamic" TP / SL Method is selected. Higher risk usually means a better winrate at the cost of losing more if the strategy fails. This setting is has a crucial effect on the performance of the indicator, as different tickers may have different volatility so the indicator may have increased performance when this setting is correctly adjusted.

FVG Channel [LuxAlgo]The FVG Channel indicator displays a channel constructed from the averages of unmitigated historical fair value gaps (FVG), allowing to identify trends and potential reversals in the market.
Users can control the amount of FVGs to consider for the calculation of the channels, as well as their degree of smoothness through user settings.
🔶 USAGE
The FVG Channel is constructed by averaging together recent unmitigated Bullish FVGs (contributing to the creation of the upper bands), and Bearish unmitigated FVGs (contributing to the creation of the lower bands) within a lookback determined by the user. A higher lookback will return longer-term indications from the indicator.
The channel includes 5 bands, with one upper and one lower outer extremities, as well as an inner series of values determined using the Fibonacci ratios (respectively 0.786, 0.5, 0.236) from the channel's outer extremities.
An uptrend can be identified by price holding above the inner upper band (obtained from the 0.786 ratio), this band can also provide occasional support when the price retraces to it while in an uptrend.
Breaking below the inner upper band with an unwillingness to reach above again is a clear sign of hesitation in the market and can be indicative of an upcoming consolidation or reversal.
This can directly be applied to downtrends as well, below are examples displaying both scenarios.
Uptrend Example:
Downtrend Example:
🔹 Breakout Levels
When the price mitigates all FVGs in a single direction except for 1, the indicator will display a "Breakout Level". This is the level that price will need to cross in order for all FVGs in that direction to be mitigated, because of this they can also be aptly called "Last Stand Levels".
These levels can be considered as potential support and resistance levels, however, should always be monitored for breakouts since a substantial push above or below these points would indicate strong momentum.
🔹 Signals
The indicator includes Bullish and Bearish Signals, these signals fire when all FVGs for a single direction have been mitigated and an engulfing candle occurs in the opposite direction. These are reversal signals and should be used alongside other indicators to appropriately manage risk.
Note: When all FVGs in a single direction have been mitigated, the candles will change colors accordingly.
🔶 DETAILS
The script uses a typical identification method for FVGs. Once identified, the script collects and stores the mitigation levels of the respective bullish and bearish FVGs:
For Bullish FVGs this is the bottom of the FVG.
For Bearish FVGs this is the top of the FVG.
The data is managed to only consider a specific amount of FVG mitigation levels, determined by the set "Unmitigated FVG Lookback". If an FVG is mitigated, it frees up a spot in the memory for a new FVG, however, if the memory is full, the oldest will be deleted.
The averages displayed (Channel Upper and Lower) are created from 2 calculation steps, the first step involves taking the raw average of the FVG mitigation levels, and the second step applies a simple moving average (SMA) smoothing of the precedent obtained averages.
Note: To view the mitigation levels average obtained in the first step, the "Smoothing Length" can be set to 1.
🔶 SETTINGS
Unmitigated FVG Lookback: Sets the maximum number of Unmitigated FVG mitigation levels that the script will use to calculate the channel.
Smoothing Length: Sets the smoothing length for the channel to reduce noise from the raw data.

HTF Inversion Fair Value Gap | Flux Charts💎 GENERAL OVERVIEW
Introducing our new Higher Timeframe Inversion Fair Value Gaps (IFVG) indicator! Inversion Fair Value Gaps occur when a Fair Value Gap becomes invalidated. They reverse the role of the original Fair Value Gap, making a bullish zone bearish and vice versa. This indicator finds the latest IFVG in a higher timeframe and renders it in the current chart with it's divergence. For more information about the process, read the "HOW DOES IT WORK" section of the description.
Features of the new Higher Timeframe IFVG Indicator :
Renders The Higher Timeframe IFVG
Invalidation Borders
Variety Of Zone Detection / Sensitivity / Filtering / Invalidation Settings
High Customizability
🚩 UNIQUENESS
This indicator lets you take a look at the bigger picture by rendering the latest IFVG in a higher timeframe. You can see the current IFVG divergence to see how is the price action acting around the IFVG. You also can customize the FVG Filtering method, FVG & IFVG Zone Invalidation, Detection Sensitivity etc. according to your needs to get the best performance from the indicator.
📌 HOW DOES IT WORK ?
A Fair Value Gap generally occur when there is an imbalance in the market. They can be detected by specific formations within the chart. An Inversion Fair Value Gap is when a FVG becomes invalidated, thus reversing the direction of the FVG.
This indicator then renders the IFVG in a higher timeframe in your chart like this :
The opaque dashed lines at the top and the bottom of the IFVG indicate the bars that formed the original FVG. The middle dashed line that is semi-transparent shows the candlestick that invalidated the original FVG, thus created the current IFVG. The vertical solid top & bottom wicks indicate the current divergence of the highest & lowest points to the current IFVG.
The IFVGs can act as strong support & resistance points, depending on their creation volume and invalidation volume. Traders can use them for confirmation signals to their positions.
⚙️ SETTINGS
1. General Configuration
Higher Timeframe -> The higher timeframe to detect latest IFVG from. Keep in mind that his setting must be higher than the current timeframe.
IFVG Zone Invalidation -> Select between Wick & Close price for IFVG Zone Invalidation.
2. Fair Value Gaps
FVG Zone Invalidation -> Select between Wick & Close price for FVG Zone Invalidation.
Zone Filtering -> With "Average Range" selected, algorithm will find FVG zones in comparison with average range of last bars in the chart. With the "Volume Threshold" option, you may select a Volume Threshold % to spot FVGs with a larger total volume than average.
FVG Detection -> With the "Same Type" option, all 3 bars that formed the FVG should be the same type. (Bullish / Bearish). If the "All" option is selected, bar types may vary between Bullish / Bearish.
Detection Sensitivity -> You may select between Low, Normal or High FVG detection sensitivity. This will essentially determine the size of the spotted FVGs, with lower sensitivities resulting in spotting bigger FVGs, and higher sensitivities resulting in spotting all sizes of FVGs.
3. Dasboard
You can enable / disable the mitigation dashboard and customize it here.
4. Customization
Offset -> The number of candlesticks the IFVG will be rendered to the right of the latest bar.
Width -> The width of the rendered IFVG in candlesticks.

Gaps Trend [ChartPrime]The Gaps Trend - ChartPrime indicator is designed to detect Fair Value Gaps (FVGs) in the market and apply a trailing stop mechanism based on those gaps. It identifies both bullish and bearish gaps and provides traders with a way to manage trades dynamically as gaps appear. The indicator visually highlights gaps and uses the detected momentum to assess trend direction, helping traders identify price imbalances caused by strong buy or sell pressure.
⯁ KEY FEATURES & HOW TO USE
⯌ Fair Value Gap (FVG) Detection :
The indicator automatically detects both bullish and bearish FVGs, identifying gaps between candle highs and lows. Bullish gaps are shown in green, and bearish gaps in purple. These gaps indicate price imbalances driven by strong momentum, such as when there is significant buying or selling pressure.
Use : Traders can use FVG detection to identify periods of high price momentum, offering insight into potential continuation or exhaustion of trends.
⯌ Trailing Stop Feature Based on FVGs :
A core feature of this indicator is the trailing stop mechanism, which adjusts dynamically based on the identified FVGs. When a bullish gap is detected, the trailing stop is placed below the price to capture upward momentum, while bearish gaps result in a trailing stop placed above the price. This feature helps traders stay in trends while protecting profits as the price moves.
Use : The trailing stop follows the momentum of the price, ensuring that traders can stay in profitable trades during strong trends and exit when the momentum shifts.
bullish set up
bearish set up
⯌ Trend Direction Indication :
The indicator colors the chart according to the current trend direction based on the position of the price relative to the trailing stop. Green indicates an uptrend (bullish gap), while purple shows a downtrend (bearish gap). This provides traders with a quick visual assessment of trend direction based on the presence of gaps.
Use : Traders can monitor the chart's color to stay aligned with the market’s trend, staying long during green phases and short during purple ones.
⯌ Gap Size Filtering :
Each detected gap is assigned a numerical ranking based on its size, with larger gaps having higher rankings. The gap size filter allows traders to only display gaps that meet a minimum size threshold, focusing on the most impactful gaps in terms of price movement.
Use : Traders can use the filter to focus on gaps of a certain size, filtering out smaller, less significant gaps. The numerical ranking helps identify the largest and most influential gaps for decision-making.
⯌ FVG Level Visualization :
The indicator can display dashed lines marking the levels of previously filled FVGs. These levels represent areas where price once experienced a gap and later filled it. Monitoring these levels can provide traders with key reference points for potential reactions in price.
Use : Traders can use these gap levels to track where price has filled gaps and potentially use these levels as zones for entry, exit, or assessing market behavior.
⯁ USER INPUTS
Filter Gaps : Adjust the size threshold to filter gaps by their size ranking.
Show Gap Levels : Toggle the display of dashed lines at filled FVG levels.
Enable Trailing Stop : Activate or deactivate the trailing stop feature based on FVGs.
Trailing Stop Length : Set the number of bars used to calculate the trailing stop.
Bullish/Bearish Colors : Customize the colors representing bullish and bearish gaps.
⯁ CONCLUSION
The Gaps Trend indicator combines Fair Value Gap detection with a dynamic trailing stop feature to help traders manage trades during periods of high price momentum. By detecting gaps caused by strong buy or sell pressure and applying adaptive stops, the indicator provides a powerful tool for riding trends and managing risk. The additional ability to filter gaps by size and visualize previously filled gaps enhances its utility for both trend-following and risk management strategies.
