HalfTrend + Trend AliThis indicator combines the structural logic of the HalfTrend system with a trend filter built on the Hull Moving Average to provide a clearer view of potential market turning points.
The HalfTrend method reacts to price extremes using adaptive deviations, offering a dynamic representation of local highs and lows. By integrating a Hull MA trend filter, the script focuses only on signals that appear in harmony with the prevailing directional bias, helping reduce noise that may occur during counter-trend fluctuations.
🔹 How It Works
The HalfTrend algorithm tracks price swings using amplitude-based detection and ATR-derived channel deviation.
A trend switch is detected when price moves beyond the boundaries of the current swing structure.
The Hull Moving Average acts as a fast-reacting trend reference. Only signals that align with the Hull direction are highlighted.
To maintain clarity and avoid clustered notifications, the script displays only one signal per confirmed trend phase.
🔹 What the Signals Represent
Buy signals appear when the HalfTrend structure shifts upward and the Hull MA confirms an uptrend.
Sell signals appear when the structure shifts downward and the Hull MA confirms a downtrend.
Both signal types include optional alerts for traders who want to be notified immediately when conditions change.
🔹 Purpose
This tool is intended for traders who want to observe structural trend shifts together with a clean and responsive trend filter. It does not attempt to predict the market; instead, it highlights moments when short-term reversals and broader trend direction are aligned.
🔹 Notes
The indicator does not repaint the signals once confirmed.
It can be applied to any market or timeframe.
Users may combine it with their own risk management or additional confirmation tools.
Half

Day/Week/Month/3M/6M/12M MTF breaks by makuchakuThis indicator plots breaks for multiple timeframes. Works on Daily to Yearly timeframes.
Currently supported timeframes :
Daily
Weekly
Monthly
Quarterly
Half Yearly
Yearly
It currently plots all breaks together. From Indicator settings hide what you don't need and save as default settings.

Half Price of Previous Day/Week/MonthJapanese below / 日本語説明は下記
Following my previous script: Automatic Half Price , I am releasing this indicator which plots the half prices of yesterday, previous week and previous month.
Automatic Half Price
Similar to previous day's half and today's half prices, last week's half and last month's half are often recognized as support and resistance.(see the sample chart below)
Sample chart
Features;
-Draw the following prices
1. Yesterday's half price and to be displayed on 4hour timeframe or below
2. Last week's half price and to be displayed on daily timeframe or below
3. Last month's half price and to be displayed on weekly timeframe or below
Note; those prices are drawn depending on the timeframe that users are on, based on the concept that lower timeframe data should not be shown on higher timeframe.
-Look back period
Users can input the number of candlesticks to look back to draw half prices.
---------------------------------
前日、先週、先月の半値を自動描画するインジケーターです。
前日半値や当日半値と同様に、先週半値や先月半値もサポート・レジスタンスとして良く意識されます。(以下のサンプルチャート参照)
サンプルチャート
機能
-以下の半値を描画
1. 前日半値(4時間以下のタイムフレームで表示)
2. 先週半値(日足以下のタイムフレームで表示)
3. 先月半値(週足以下のタイムフレームで表示)
これらの半値は、下位足のデータは上位足に表示する必要はないという考えに基づき、ユーザーが開いているタイムフレームに応じて表示・非表示が制御されます。
-半値を描画するバーの本数指定
半値ラインを描画する範囲として、現在のバーから何本前のバーに遡ってラインを描画するかを指定することができます。

Automatic half priceJapanese below / 日本語説明は下記
This indicator automatically draws half price lines based on the logic below.
Today’s half price: Half price between today’s high and low
Yesterday’s half price: Half price between yesterday’s high and low
Half price as hidden support and resistance
As a characteristic of market, price sometimes tests previous day’s half price first when previous day ends with bullish candle, then tries new high.
Example1: USDJPY Daily chart: New high after testing previous day’s half price
July9 ends with bullish candle. July10 candle tests previous day’s half first, then records new high.
Example2: USDJPY 1H chart: New high after testing today’s half price
Another example is that today’s half is tested by NY session.
In this case, Asian & European session is an uptrend. When the NY session starts, it tests the half of Asian & Euro sessions’ gain then records new high.
———————————————————————
押し目戻り目として意識される半値を自動描画するインジケーターです。
当日半値: 当日日足ローソク足の高値と安値の半値
先日半値: 先日日足ローソク足の高値と安値の半値
<参考>
押し目戻り目として意識される半値
相場の動きの特徴として、例えば前日の日足ローソク足が陽線で引けた場合、前日の陽線の半値付近を一度試してから上昇するという動きがよく見られます。
例1 ドル円日足: 前日の半値を試してから上昇
7/9は陽線で引けています。翌日7/10のローソク足は前日の半値付近を試した後、高値更新をしています。
例2 ドル円 1時間足: 当日の半値を試してから上昇
8/10のアジア時間と欧州時間は上昇トレンドです。NY時間がスタートした時、アジア時間と欧州時間の上昇の半値付近を試した後、高値更新をしています。

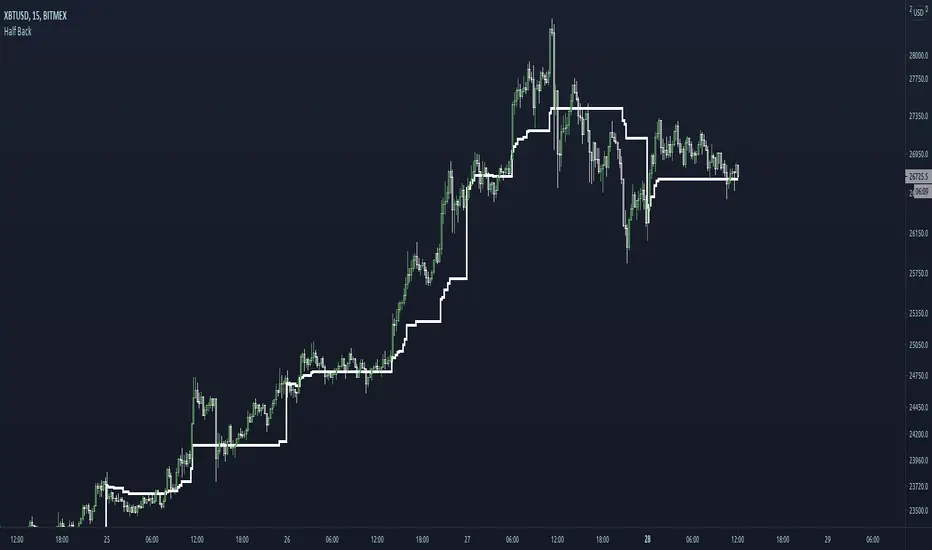
Half Back minimalisticless intrusive version of my half back indicator.
Show the midpoint of the current day.

Half BackA dynamic intraday midpoint for Day Timeframe trader reference.
Midpoint is halfway between the day's highest high and lowest low.
Midpoint resets daily.
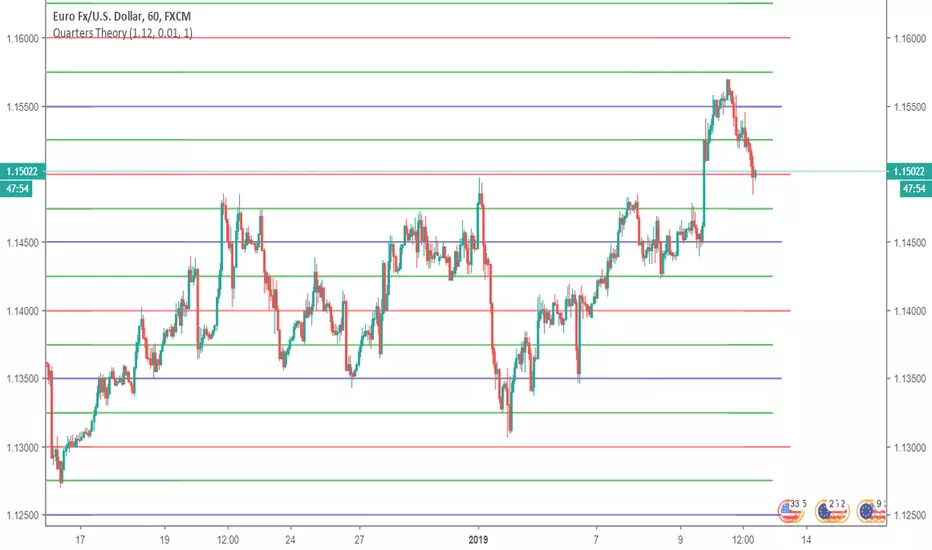
Quarters TheoryIndicator that lets you to put Whole (red), Half (blue) and Quarter (green) levels on a chart, which work as support/resistance levels. Defaults are only for EURUSD, for other symbols you have to change the settings. First input is "Starting Price (Bottom)", which should be the lowest point you want your levels to be. There are only 10 Whole levels on this indicator, but if you want you could add them from pine editor. The next input is "Next Whole Level" this is the price from one whole level to next whole level, for example for EURUSD it is 0.01. The third input is for removing the quarter lines (green lines), if you want to remove them set this option to "0", otherways leave this to "1".
This indicator looks very good on JPY and NZD pairs.
Works on long term too:
Learned from him: www.youtube.com