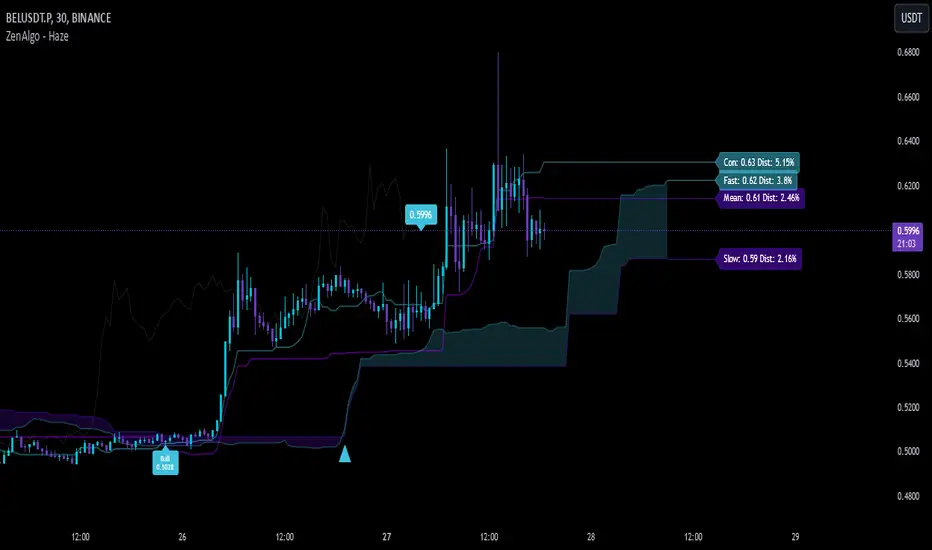
ZenAlgo - HazeThe ZenAlgo - Haze indicator offers an advanced framework for analyzing market trends, momentum shifts, and potential reversals. By integrating dynamic crossovers, predictive zones, and historical validation into a single tool, it provides traders with actionable insights for better decision-making. Its configurable settings for Crypto and Traditional adapt seamlessly to the unique characteristics of each market.
Features
Dynamic Trend Labels: Identifies "Bull," "Bear," "Super Bull," and "Super Bear" states based on crossover logic, price levels, and historical trends.
Market-Specific Adaptability: Switch between Crypto and Traditional settings for optimized analysis tailored to each market’s behavior.
Predictive Kumo Cloud: Forward-projected support and resistance zones help traders anticipate potential price movements.
Lagging Span Validation: Validates trends using historical price context for improved reliability.
Integrated Signals and Alerts: Combines crossovers and momentum shifts with real-time alerts for trend confirmation.
Added Value: Why Is This Indicator Original/Why Shall You Pay for This Indicator?
The Haze indicator differentiates itself through a carefully designed synergy of components, providing a depth of analysis that extends beyond traditional Ichimoku or Donchian-based indicators. Here’s what makes it valuable to traders:
1. Dynamic and Contextual Market Labels
Labels like Bull , Bear , Super Bull , and Super Bear do not merely indicate crossovers but also account for the relative position of price to predictive cloud zones and historical trends. This layered approach ensures signals are contextual and provide a clear understanding of the market's underlying strength or weakness.
These states are especially powerful because they simplify decision-making by summarizing complex market dynamics into actionable insights.
2. Market-Specific Optimization
The ability to switch between Crypto and Traditional configurations adapts the indicator to specific market conditions. For instance, Crypto's volatility requires wider periods for trend calculations, while Forex's tighter price movements benefit from shorter, more reactive settings. This adaptability ensures precision without needing multiple separate tools.
3. Predictive Insights
The forward-shifted Kumo cloud is designed to anticipate future support and resistance zones. Unlike reactive indicators that only analyze past data, this predictive feature gives traders an edge by offering a glimpse into potential price movements.
4. Integrated Synergy
The integration of components—Donchian channels for trend calculation, Kumo cloud for projections, and Lagging Span for historical validation—creates a holistic system. These components are not merely combined but interact to validate and reinforce each other's signals, reducing noise and increasing reliability.
5. Simplification Without Sacrificing Depth
By consolidating multiple elements into a single interface, Haze reduces chart clutter. It eliminates the need for traders to interpret separate indicators manually, saving time and improving clarity. This streamlined approach is particularly useful for traders working in fast-paced markets like Crypto.
How It Works
1. Dynamic Trend Detection
The indicator evaluates crossovers between the conversion and baseline lines. However, these are not simple crossovers—Haze analyzes the relative position of the price to the forward-displaced cloud and validates signals based on historical context (Lagging Span). For example:
A Super Bull signal is generated only when the conversion line crosses above the baseline, remains above the cloud, and is supported by rising price trends. This ensures that the signal reflects sustained bullish momentum rather than temporary spikes.
Similarly, a Super Bear signal requires the price and conversion line to be below the cloud, validated by a consistent downward trend.
2. Forward-Projected Kumo Cloud
The Kumo cloud is calculated by projecting key levels derived from Donchian channels into the future. This feature helps traders identify upcoming areas of support and resistance, enabling them to anticipate market behavior rather than reacting to it.
Cloud thickness indicates the strength of these zones; a wide cloud reflects robust support or resistance, while a narrow cloud suggests potential indecision or consolidation.
3. Lagging Span Validation
By plotting the current price backward, the Lagging Span provides historical validation of trends. For example:
If the Lagging Span remains above the cloud and price, it reinforces the bullish trend.
Conversely, if it falls below the cloud and price, it confirms bearish conditions. This backward-looking validation ensures that current signals are consistent with past market behavior.
4. Real-Time Alerts
Alerts are triggered when the Fast and Slow lines (calculated from Donchian channels) cross. These alerts are offset by the cloud’s displacement period to align with forward projections. This ensures t
5. Multi-Layered Label System
The indicator dynamically adjusts the visibility of labels based on the detected market state, providing traders with concise yet comprehensive feedback. For example:
Bull and Bear labels appear for preliminary signals, while Super Bull and Super Bear labels are reserved for high-confidence trends that meet stricter conditions.
6. Market-Specific Configurations
For Crypto, the indicator uses longer periods to capture broader trends and account for high volatility.
For Traditional, shorter periods provide quicker signals, tailored to the relatively stable nature of currency pairs.
Usage Examples
The Haze indicator is designed to be intuitive yet comprehensive, offering multiple layers of analysis to guide traders. Here's how to interpret its outputs effectively:
1. Interpreting Labels
Bull and Bear : Indicate the start of potential upward or downward momentum. These labels appear when the conversion line crosses the baseline but remain within or near the cloud, signaling a trend shift with moderate confidence.
Super Bull and Super Bear : Represent strong, confirmed trends. These labels require the conversion line and price to remain firmly above (Super Bull) or below (Super Bear) the cloud, validated by consistent price movements in the same direction.
Use the Super labels as confirmation of robust trends with high reliability, ideal for entering longer-term positions or scaling into existing trades.
2. Using the Kumo Cloud
The cloud serves as a visual representation of projected support and resistance levels.
Wide Cloud Zones: Indicate strong barriers, suggesting significant price consolidation or resistance at those levels.
Narrow Cloud Zones: Suggest weaker areas of support or resistance, often seen during periods of low volatility or indecision.
Above the Cloud: Signals a bullish market condition, where price is more likely to find support near the upper cloud boundary.
Below the Cloud: Indicates bearish conditions, with resistance likely near the lower cloud boundary.
3. Incorporating Alerts
Alerts for Fast/Slow Crossover provide a timely signal of potential momentum shifts.
A Cross Up occurring near or above the cloud strengthens bullish momentum.
A Cross Down near or below the cloud reinforces bearish momentum.
Use these alerts to refine entry and exit points, particularly in trending markets.
4. Validating Trends with the Lagging Span
The Lagging Span acts as a confirmation tool, validating current trends against historical price levels:
If the Lagging Span is above both the cloud and the current price, it confirms a strong bullish trend.
If it is below both the cloud and the price, it reinforces a bearish trend.
5. Multi-Timeframe Analysis
Analyze the indicator across multiple timeframes to gain a broader perspective on the market.
Use higher timeframes (e.g., daily or 4-hour charts) to identify dominant trends.
Use lower timeframes (e.g., 1-hour or 15-minute charts) for precise entry and exit points within the context of the larger trend.
6. Combining Labels and Cloud Zones
A Bull label within the cloud indicates a nascent uptrend but warrants caution until price moves above the cloud.
A Super Bull label above the cloud confirms strong bullish momentum, making it a high-confidence signal for taking long positions.
Conversely, a Super Bear label below the cloud signals strong downward momentum and potential shorting opportunities.
By interpreting these elements together, traders can gain a clearer understanding of market conditions and make more informed decisions without relying on multiple separate tools.
Limitations
Low-Volume Markets: In illiquid markets, such as some altcoins or exotic forex pairs, signals may be less reliable. Pair the indicator with additional tools like RSI or Bollinger Bands to filter out noise.
Sideways Markets: During periods of consolidation, frequent crossovers may produce false signals. Use complementary tools to confirm breakout conditions.
Short Timeframes: On very short timeframes (e.g., 1-minute charts), market noise may lead to unreliable signals. Applying the indicator to higher timeframes can improve reliability.
Volatile Events: In markets with extreme volatility, signals may lag behind rapid price movements. For better results, combine the indicator with a volatility filter, such as the Average True Range (ATR).
Important Notes
The indicator is a technical tool designed to support market analysis and should be used alongside other strategies, including fundamental analysis and sound risk management.
Always use stop-loss orders and proper position sizing to mitigate risks, particularly in volatile or uncertain market conditions.
This indicator does not guarantee trading success or profit and should be used as part of a comprehensive strategy.
Ichimoku-trading
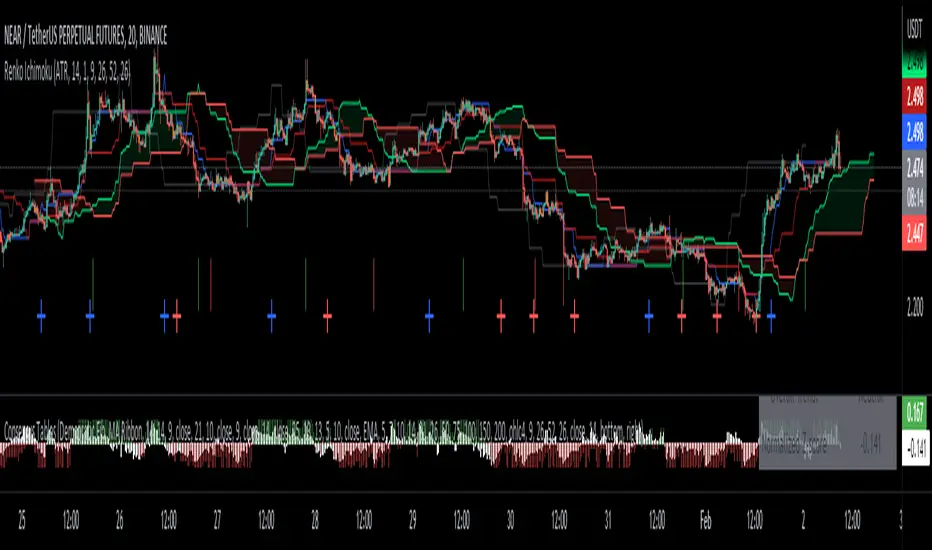
Renko Ichimoku CloudThis script utilizes its source from a non-repainting renko closing price. Renko charts focus solely on price movement and minimize the impacts of time and the extra noise time creates. Employing the renko close helps smooth out the Ichimoku Cloud. Insignificant price movements will not cause a change in the plotted lines of the indicator unless a new threshold is breached or a "brick" is created.
This Ichmoku Cloud includes all standard lines with standard lengths. These include:
Tenken Sen
Kiju Sen
Senkou A/B
Chikou Span
We have also included plotted marks for when there is a Tenken Sen/ Kiju Sen cross and for the Kumo cloud twist.
There are two methods for selecting the box size. Box size is critical for the overall function and efficacy of the plots you will visually see with this indicator. Box size is set automatically using the Average True Range "ATR" or manually using the "Traditional" setting. The simplest way to determine a manual box six is to take the ATR of the given instrument and round it to the nearest decimal place. As an example, if the ATR for the asset is 0.017, you would round that number to 0.02 and utilize this as your traditional box size.
MZ Adaptive Ichimoku Cloud (Volume, Volatility, Chikou Filter) This study is a functional enhancement to conventionally used Ichimoku Clouds . It uses particular effective adaptive parameters (Relative Volume Strength Index (MZ RVSI ), Volatility and Chikou Backward Trend Filter) to adapt dynamic lengths for Kijun-sen, Tenkan-sen, Senkou-span and Chikou .
This study uses complete available Ichimoku Clouds trading methodology to provide trade confirmations. Its still in experimental phase so will be updated accordingly.
ADAPTIVE LENGTH PARAMETERS
Relative Volume Strength Index (MZ RVSI )
For adaptive length, I tried using Volume and for this purpose I used my Relative Volume Strength Index " RVSI " indicator. RVSI is the best way to detect if Volume is going for a breakout or not and based on that indication length changes.
RVSI breaking above provided value would indicate Volume breakout and hence dynamic length would accordingly make Ichimoku Clouds more over-fitted to better act as support and resistance . Similar case would happen if Volume goes down and dynamic length becomes more under-fit.
Original RVSI Library and study can be found here:
Volatility
Average true range is used as volatility measurement and detection tool. Dual ATR condition would decide over-fitting or under-fitting of curve.
Chikou Backward Trend Filter
Chikou is basically close value of ticker offset to close and it is a good for indicating if close value has crossed potential Support/Resistance zone from past. Chikou is usually used with 26 period.
Chikou filter uses a lookback length calculated from provided lookback percentage and checks if trend was bullish or bearish within that lookback period.
Original Chikou Filter library and study can be found here:
ADAPTIVE ICHIMOKU CLOUD
Tenkan-Sen (Conversion Line)
Tenkan-sen is a moving average that is calculated by taking the average of the high and the low for the last nine periods conventionally but in this study its length is dynamically adapted based on Volume, Volatility and Chikou filter. Default adaption range is set to 9-30 which I found universally applicable to almost every market on all time-frames.
Kijun-Sen (Base Line)
The Kijun-Sen is usually considered a support/resistance line which also acts as an indicator of price movements in the future and takes a longer period into consideration, usually 26 periods compared to Tenkan-Sen’s nine periods is used conventionally. In this study, its length is set to vary in range of 20-60 based on adaptive parameters.
Senkou-Span (Leading Span)
Senkou-Span A : Senkou Span A is the average of the highs and lows of Tenkan-Sen and Kijun-Sen so it automatically adapts accroding to dynamic lengths of Tenkan and Kijun.
Senkou-Span B : Senkou Span B is usually calculated by averaging highs and lows of the past 52 periods and plotting it 26 points to the right but this study uses adaptive parameters to adapt its dynamic length in range of 50-120 which makes Kumo (Ichimoku Cloud) a better area for support and resistance. I don’t consider its necessary to adapt Kumo’s displacement to the right, so I used conventional 26 period as offset.
Chikou -Span (Lagging Span)
The Chikou Span, also known as the lagging span is formed by taking the price source and offsetting it back 26 periods to the left but I used adaptive length in range 26-50 which makes this tool a better option to check for Chikou -Price cross check in wide range.
TRADE SIGNALS & CONFIRMATIONS
Volume : RVSI used to detect volume breakout about given point. By default, On Balance Volume based RVSI is selected for all dynamic length adaption and also for trade confirmations.
Cross(Tenkan,Kijun) : Easiest way to detect trend as if Tenkan is above Kijun then market is uptrend and vice versa.
Volatility : High volatility is a good way to confirm if price is on the move or not.
Tenkan = Kijun : Because of a wide range of Tenkan and Kijun length; their value can become equal before reversal.
Chikou > Source : A very conventional way to detect price momentum as if Chikou is above price then market is in uptrend and vice versa.
Chikou Momentum : Another simpler way to represent Chikou > Source as if momentum of price source is uptrend then price will tend to follow.
Source > Kumo : Using the best tool of Ichimoku Clouds i.e. Kumo. If price crosses both Senkou-Span A & B then market has broken potential resistance leading to a good uptrend and vice versa.
Source > Tenkan : Better way to detect price trend in short term.
Chikou Backward Trend Filter : Different from Chikou >Source in a way that Chikou filter makes sure that price crosses highest/lowest within defined period.
CHARTING
Bars Coloring : Bars coloring is set as following :
src > tenkan-Sen and src > kijun-Sen : Strong uptrend detection and shown by green bars.
src < tenkan-Sen and src < kijun-Sen : Strong downtrend detection and shown by green bars.
src > tenkan-Sen and src < kijun-Sen : Better way to detect bottom reversals as if price comes above tenkan but remains below kijun; that’s early signs of recovery. Light red bars are used for this by default.
src < tenkan-Sen and src > kijun-Sen : Better way to detect top reversals as if price comes below tenkan but remains above kijun; that’s early signs of losing potential in uptrend. Dark Grey bars are used for this by default.
Kumo Coloring : Following steps are used to derive Kumo’s dynamic color:
Average of Senkou-span A and B is calculated.
RSI with 14 period of that average is calculated.
Gradient color based on calculated RSI values with 0-100 range is derived which is final Kumo color.
Chikou Span Coloring : Dynamic coloring from Chikou Filter is used as Indicator’s Chikou ’s color.
Signals Overlay : Red and Green small triangles are used as signals overlay.

Chikou Filter for Ichimoku CloudThis Indicator enhances functionality of Chikou-Span from Ichimoku Cloud using a simple trend filter.
Methodology
Chikou is basically close value of ticker offset to close and it is a good for indicating if close value has crossed potential Support/Resistance zone from past. Chikou is usually used with 26 period.
Chikou filter uses a lookback length calculated from provided lookback percentage and checks if trend was bullish or bearish within that lookback period.
Bullish : Trend is bullish if Chikou span is above high values of all candles within defined lookback period. Green color shows bullish trend.
Bearish: Trend is bearish if Chikou span is below low values of all candles within defined lookback period. This is indicated by red color.
Reversal / Choppiness : White color indicates that Chikou are swinging around candles within defined lookback period which is an indication of consolidation or trend reversal.
Default Settings
Different source types are included but I've found that (OHLC4+High+Low)/3 is better for Chikou and Symmetrically Weighted Moving Average (SWMA) is also applied but it produce some repainting though. Default period is set to 26 and lookback percentage is 50%. Low percentage would decrease filter's efficiency.
Usage
This filter can be used to check if Chikou crossover has occurred in past. This can be used with Donchain channels, Bollinger Bands or any Moving Average as replacement of High / Low values. I'll use this indicator in all my Ichimoku Cloud studies especially adaptive ones. Filter outputs in Color and Integer format; both can be used as signals definitions.
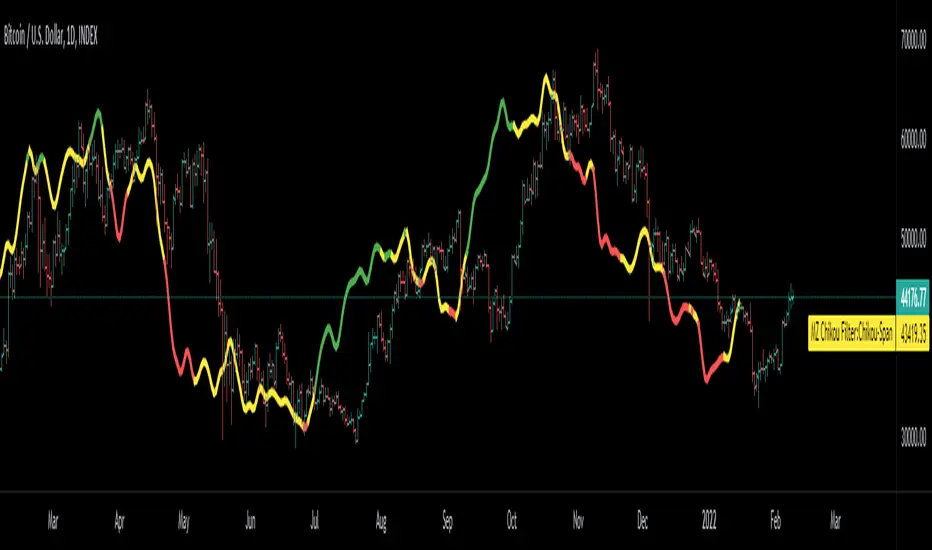
Ichimoku Cloud DistanceAn alternative way to look at the Ichimoku Cloud with various modes:
Distance to Center: the various lines of the Ichimoku system are displayed as the distance to the center of the cloud in percentage terms. 0 is the center of the cloud.
Distance to Edge: lines are displayed as the distance to the closest edge of the cloud in percentage terms. values inside the cloud are displayed as 0.
Hybrid: values outside of the cloud behave as the 'Distance to Edge' mode, values inside behave as 'Distance to Center' mode. The values outside the cloud are scaled by the supplied scale factor in order to make things more readable. Best value for this scale factor is chart/timeframe dependent. The interval from -1 to 1 is equivalent to the bottom and top of the cloud respectively; 0 is the center.
The background color is the color of the cloud.

Ichimoku breakoutIf you use Ichimoku Cloud strategies, this indicator is very useful for you!
This code indicates the candles that break the ichimoku cloud in both directions!
conversion line, base line and lagging span are disable by default, you can enable it from settings window.
green triangles under the candles with green backgrounds show break out the red clouds.
red triangles at the top of the candles with red backgrounds show break out the red clouds.
you can set alerts to be notified when an Ichimoku Cloud is broken.

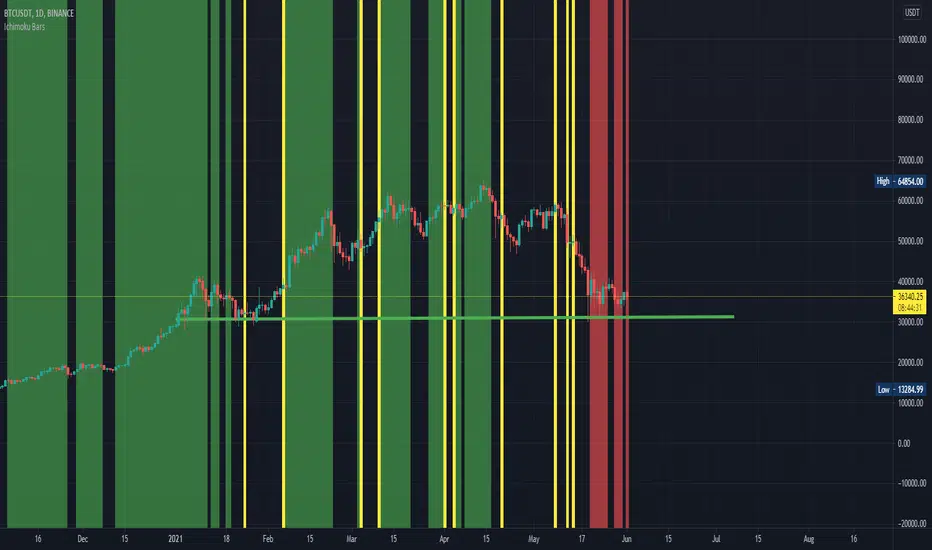
Ichimoku BarsThis script follows off the principles of the Ichimoku Cloud indicator. The green zones display optimal time to buy according to the Ichimoku model. The red zones show optimal time to sell according to the Ichimoku model inverse. The yellow zones show where the conversion line meets the base line (potential up or down movement at this point). Feel free to contact me to fix any problems or add additional info.