Short TimeFrame MAs with momentum cloudsThis indicator displays multiple moving averages to help identify short- and mid-term trends.
It includes four SMAs (9, 50, 150, 200) and two EMAs (21, 55) with color changes showing bullish or bearish momentum.
The area between the EMAs is filled to highlight trend direction.
An optional smoothing layer lets you apply different MA types or Bollinger Bands for additional clarity.
It’s designed to give a clear visual of overall trend strength, direction, and volatility on any timeframe.
ענן איצ'ימוקו
Tradytics Levels with EMA CloudThis indicator has tradytics price chart levels where you can put in the input code seen below.
The code has positive gamma (green lines), negative gamma (Red lines) and white dotted line are the darkpool levels.
This is Amazon's 5 minute from Sep30th to October 20th Gammas and weekly Darkpool levels. Just copy and paste code below in the input code and the chart would show the levels.
212.8*1*neutral 220.07*1*neutral 216.038*1*neutral 215.57*1*neutral 219.988*1*neutral 217.401*1*neutral 217.351*1*neutral 212.815*1*neutral 212.75*1*neutral 212.4*1*neutral 215*0*negative 222.5*0*positive 217.5*0*positive 220*0*positive
Ichimoku PourSamadi Signal [TradingFinder] KijunSen Magic Number🔵 Introduction
The Ichimoku Kinko Hyo system is one of the most comprehensive market analysis tools ever created. Developed by Goichi Hosoda, a Japanese journalist in the 1930s, its purpose was to allow traders to recognize the balance between price, time, and momentum at a single glance. (In Japanese, Ichimoku literally means “one look.”)
At the core of the system lie five key components: Tenkan-sen (Conversion Line), Kijun-sen (Baseline), Chikou Span (Lagging Line), and the two leading spans, Senkou Span A and Senkou Span B, which together form the well-known Kumo or cloud representing both temporal structure and equilibrium zones in the market.
Although Ichimoku is commonly used to identify trends and support/resistance levels, a deeper layer of time philosophy exists within it. Ichimoku was not designed solely for price analysis but equally for time analysis.
In the classical model, the numerical cycles 9, 26, 52 reflect the natural rhythm of the market originally based on the Tokyo Stock Exchange’s trading schedule in the 1930s.
These values repeat across the system’s calculations, forming the foundation of Ichimoku’s time symmetry where price and time ultimately seek equilibrium.
In recent years, modern analysts have explored new approaches to extract time-based turning points from Ichimoku’s structure. One such approach is the analysis of flat segments on the Kijun-sen and Senkou B lines.
Whenever one of these lines remains flat for a period, it signals temporary balance between buyers and sellers; when the flat breaks, the market exits equilibrium and a new cycle begins.
This indicator is built precisely upon that philosophy. Following the timing methodology introduced by M.A. Poursamadi, the focus shifts away from price signals and line crossovers toward identifying flat periods on Kijun-sen (period 52) as time anchors.
From the first candle that changes the line’s slope, the tool begins a temporal count using a fixed sequence of key numbers: 5, 9, 13, 17, 26, 35, 43, 52, 63, 72, 81, 90.
Derived from both classical Ichimoku cycles and empirical testing, these numbers mark potential timing nodes where a market wave may end, a correction may begin, or a new leg may form.
Thus, this method serves not merely as another Ichimoku tool but as a temporal metronome for market structure a way to visualize moments when the market is ready to change rhythm, often before candles reveal it.
🔵 How to Use
The Kijun Timing BoX is built entirely on Ichimoku’s concept of time analysis.
Its core idea is that within every flat segment of the Kijun-sen, the market enters a temporary balance between opposing forces.
When that flat breaks, a new time cycle begins. From that first breakout candle, the indicator starts counting forward through the predefined time sequence(5, 9, 13, 17, 26, 35, 43, 52, 63, 72, 81, 90).
This counting framework creates a temporal map of market behavior, where each number represents an area where meaningful price fluctuations often occur.
A “meaningful fluctuation” does not necessarily imply reversal or continuation; rather, it marks a moment when the market’s internal energy balance shifts, typically visible as noticeable reactions on lower timeframes.
🟣 Identifying the Anchor Point
The first step is recognizing a valid flat zone on the Kijun-sen.
When this line remains flat for several candles and then changes slope, the indicator marks that bar as the Anchor, initiating the time count.
From that point onward, vertical gray lines appear at each interval in the key-number sequence, visualizing the time nodes ahead.
🟣 Reading the Timing Lines
Each numbered line represents a timing node a temporal point where a change in price rhythm is statistically more likely to occur.
At these nodes, the market may :
Enter a consolidation or minor correction phase.
Develop range-bound movement.
Or simply alter the speed and intensity of its move.
These behaviors do not imply a specific direction; they only highlight zones where time-based activity tends to cluster, giving traders a clearer view of cyclical rhythm.
🟣 Applying Time Analysis
The indicator’s primary use is to observe temporal order, not to predict price direction.
By tracking the distance between Anchors and the reactions that appear near major timing lines, traders can empirically identify each market’s characteristic rhythm—its own time DNA.
For example, one asset may consistently show significant fluctuations around the 13- and 26-bar marks,while another might react closer to 9 or 52. Recognizing such patterns helps traders understand how long typical cycles last before new phases of volatility emerge.
🟣 Combining with Other Tools
The indicator does not generate buy/sell signals on its own.
Its best use is in combination with price- or structure-based methods, to see whether meaningful price reactions occur around the same timing nodes.
In practice, it helps distinguish structured time-based fluctuations from random, noise-driven moves an insight often overlooked in conventional market analysis.
🔵 Settings
🟣 Logical Settings
KijunSen Period : Defines the baseline period used for timing analysis. Default = 52. It is the main line for detecting flats and generating time anchors.
Flat Event Filter : Controls how flat segments are validated before triggering a new timing event.
All : Every flat triggers a new Timing Box.
Automatic : Only flats longer than the historical average are used (recommended).
Custom : User manually defines the minimum flat length via Custom Count.
Update Timing Analysis BoX Per Event : If enabled, a new Timing Box is drawn each time a new flat event occurs. If disabled, the box completes its 90-bar window before refreshing.
🟣 Ichimoku Settings
TenkanSen Period : Defines the period for the Conversion Line (Tenkan-sen). Default = 9.
KijunSen Period : Sets the standard Ichimoku baseline (not the timing line). Default = 26.
Span B Period : Defines the period for Senkou Span B, the slower cloud boundary. Default = 52.
Shift Lines : Offsets cloud projection into the future. Default = 26.
🟣 Display Settings
Users can show or hide all Ichimoku lines Tenkan-sen, Kijun-sen, Chikou Span, Span A, and Span B as well as the Ichimoku Cloud.
They can also customize the color of each element to match personal chart preferences and improve visibility.
🔵 Conclusion
This analytical approach transforms Ichimoku’s time philosophy into a visual and measurable framework. A flat Kijun-sen represents a moment of market equilibrium; when its slope shifts, a new temporal cycle begins.
The purpose is not to forecast price direction but to highlight periods when meaningful fluctuations are more likely to develop.
Through this perspective, traders can observe the hidden rhythm of market time and expand their analysis beyond price into a broader time-cycle dimension.
Ultimately, the method revives Ichimoku’s original principle: the market can only be truly understood through the simultaneous harmony of price, time, and balance.

Ichimoku Screener [Pineify]Advanced Multi-Timeframe Ichimoku Screener - Complete Market Analysis Tool
This sophisticated Ichimoku Screener represents a comprehensive approach to multi-timeframe market analysis, combining four distinct Ichimoku-based indicators into a unified screening system. Unlike traditional single-symbol indicators, this screener provides simultaneous analysis across multiple assets and timeframes, enabling traders to identify optimal trading opportunities with enhanced precision and efficiency.
Key Features
Multi-asset screening capability for up to 10 symbols simultaneously
Four customizable timeframes per symbol for comprehensive analysis
Four integrated Ichimoku-based indicators working in harmony
Real-time visual feedback with color-coded signals
Customizable Ichimoku parameters for personalized analysis
Clean, organized table display for easy interpretation
Automated signal strength assessment and timing
How It Works
The screener employs the traditional Ichimoku Kinko Hyo methodology, utilizing five core components: Conversion Line (Tenkan-sen), Base Line (Kijun-sen), Leading Span A (Senkou Span A), Leading Span B (Senkou Span B), and displacement calculations. Each component is mathematically calculated using specific period lengths:
Conversion Line = (Highest High + Lowest Low) / 2 over conversion period
Base Line = (Highest High + Lowest Low) / 2 over base period
Leading Span A = (Conversion Line + Base Line) / 2
Leading Span B = (Highest High + Lowest Low) / 2 over lagging span period
The screener processes these calculations across multiple securities simultaneously using TradingView's security() function, enabling real-time cross-asset analysis. The system tracks state changes using barssince() functions to provide precise timing information for each signal type.
Trading Ideas and Insights
This screener excels in identifying momentum convergence patterns where multiple Ichimoku components align across different timeframes. The most powerful signals occur when:
Cloud color aligns with price position relative to the cloud
Conversion Line crosses above/below Base Line in the same direction as cloud bias
Multiple timeframes show consistent directional bias
Entry signals appear with minimal bars since formation (indicating fresh momentum)
For trend following strategies , focus on symbols where the cloud maintains consistent color across higher timeframes while showing recent entry signals on lower timeframes. For reversal opportunities , identify assets where cloud color changes coincide with price re-entering the cloud after extended periods above or below.
The screener particularly excels in cryptocurrency and forex markets where momentum shifts can be dramatic and sustained. By monitoring multiple timeframes simultaneously, traders can identify when short-term signals align with longer-term trends, significantly improving trade success probability.
How Multiple Indicators Work Together
The four integrated indicators create a comprehensive analytical framework through synergistic interaction:
Ichimoku Cloud (IchiCld) establishes the primary trend bias by comparing Leading Span A with Leading Span B. When Span A > Span B, the cloud displays bullish characteristics; when Span A < Span B, bearish characteristics emerge. The indicator tracks duration since the last cloud color change, providing momentum persistence insight.
Ichimoku Lagging Cloud (IchiLagCld) determines price position relative to the displaced cloud formation. This indicator identifies whether current price action occurs above, below, or within the cloud structure, revealing support/resistance dynamics and trend confirmation signals.
Conversion vs Base (IchiC>Base) monitors the relationship between short-term (Conversion Line) and medium-term (Base Line) momentum. Crossovers in this relationship often precede significant price movements and provide early trend change warnings.
Ichimoku Entry (IchiEnt) synthesizes all components into actionable signals by requiring alignment between cloud bias, price position, and conversion/base relationship. This multi-factor confirmation approach significantly reduces false signals while maintaining sensitivity to genuine momentum shifts.
The mathematical foundation ensures that each indicator contributes unique information while maintaining logical consistency. The system's strength lies in requiring multiple confirmations before generating entry signals, following Ichimoku's original philosophy of comprehensive market analysis.
Unique Aspects
This implementation distinguishes itself through several innovative features:
Advanced State Tracking : Unlike standard Ichimoku indicators that show current values, this screener tracks duration since state changes , providing crucial timing information for signal freshness and momentum strength assessment.
Multi-Asset Efficiency : The screener eliminates the need to manually check multiple charts by presenting comparative analysis across assets and timeframes in a single view, dramatically improving analytical efficiency.
Customizable Visual Feedback : The color-coding system adapts to different signal types and strengths, with recent signals receiving enhanced visual prominence to draw attention to fresh opportunities.
Professional Table Architecture : The organized display accommodates up to 40 symbol-timeframe combinations (10 symbols × 4 timeframes), with intelligent pagination for optimal screen utilization.
Signal Correlation Analysis : By displaying multiple timeframes for each symbol, traders can quickly identify timeframe confluence and divergence patterns that would otherwise require extensive manual analysis.
How to Use
Symbol Configuration : Enter up to 10 symbols in the Symbol input group. Use full exchange:ticker format for optimal compatibility (e.g., "BINANCE:BTCUSDT").
Timeframe Selection : Configure four timeframes in ascending order for logical analysis progression. Recommended combinations include 1m/5m/15m/1h for intraday analysis or 1h/4h/1D/1W for swing trading.
Ichimoku Parameters : Adjust the four core parameters based on your trading style:
Conversion Line Length (default: 9) - Controls short-term momentum sensitivity
Base Line Length (default: 26) - Determines medium-term trend identification
Leading Span B Length (default: 52) - Sets long-term trend calculation period
Displacement (default: 26) - Controls forward projection of cloud structure
Signal Interpretation :
Green backgrounds indicate bullish conditions
Red backgrounds indicate bearish conditions
Numerical values show bars since last state change
"L:" prefix indicates long entry signals
"S:" prefix indicates short entry signals
"N/A" indicates neutral/transitional states
Trading Workflow : Scan for symbols showing consistent signals across multiple timeframes, prioritize fresh signals (low bar counts), and use individual charts for precise entry timing and risk management.
Customization
The screener accommodates various trading approaches through parameter adjustment:
Scalping Configuration : Use shorter periods (Conversion: 5, Base: 13, Span B: 26) with 1m/3m/5m/15m timeframes for high-frequency opportunities.
Swing Trading Setup : Employ standard parameters with 4h/1D/3D/1W timeframes for position trading across days or weeks.
Cryptocurrency Optimization : Given crypto's 24/7 nature, consider using 4h/8h/1D/3D combinations for optimal signal timing.
Symbol selection can focus on correlated assets (e.g., major cryptocurrencies) for sector analysis or diverse assets for portfolio opportunity identification. The flexible timeframe configuration allows adaptation to any market's characteristic volatility and trading patterns.
Conclusion
This Advanced Multi-Timeframe Ichimoku Screener transforms traditional single-chart analysis into a comprehensive market monitoring system. By integrating multiple Ichimoku components across various timeframes and assets, it provides traders with unprecedented analytical efficiency and signal reliability.
The mathematical rigor of traditional Ichimoku analysis combines with modern Pine Script capabilities to deliver a professional-grade screening tool. Whether used for identifying trend continuation opportunities, spotting potential reversals, or conducting broad market analysis, this screener offers the analytical depth and practical functionality required for serious trading applications.
The system's emphasis on signal confluence across multiple timeframes and indicators significantly improves trade selection quality while reducing analysis time. For traders seeking to leverage Ichimoku's proven methodology across multiple markets simultaneously, this screener represents an essential analytical upgrade to traditional single-symbol approaches.

Tunç ŞatıroğluTunç Şatıroğlu's Technical Analysis Suite
Description:
This comprehensive Pine Script indicator, inspired by the technical analysis teachings of Tunç Şatıroğlu, integrates six powerful TradingView indicators into a single, user-friendly suite for robust trend, momentum, and divergence analysis. Each component has been carefully selected and enhanced by beytun to improve functionality, performance, and visual clarity, aligning with Şatıroğlu's approach to technical analysis. The default configuration is meticulously set to match the exact settings of the individual indicators as used by Tunç Şatıroğlu in his training, ensuring authenticity and ease of use for followers of his methodology. Whether you're a beginner or an experienced trader, this suite provides a versatile toolkit for analyzing markets across multiple timeframes.
Included Indicators:
1. WaveTrend with Crosses (by LazyBear, modified): A momentum oscillator that identifies overbought/oversold conditions and trend reversals with clear buy/sell signals via crosses and bar color highlights.
2. Kaufman Adaptive Moving Average (KAMA) (by HPotter, modified): A dynamic moving average that adapts to market volatility, offering a smoother trend-following signal.
3. SuperTrend (by Alex Orekhov, modified): A trend-following indicator that plots dynamic support/resistance levels with buy/sell signals and optional wicks for enhanced accuracy.
4. Nadaraya-Watson Envelope (by LuxAlgo, modified): A non-linear envelope that highlights potential reversals with customizable repainting options for smoother outputs.
5. Divergence for Many Indicators v4 (by LonesomeTheBlue, modified): Detects regular and hidden divergences across multiple indicators (MACD, RSI, Stochastic, CCI, Momentum, OBV, VWMA, CMF, MFI, and more) for early reversal signals.
6. Ichimoku Cloud (TradingView built-in, modified): A multi-faceted indicator for trend direction, support/resistance, and momentum, with enhanced visuals for the Kumo Cloud.
Key Features:
- Authentic Default Settings : Pre-configured to mirror the exact parameters used by Tunç Şatıroğlu for each indicator, ensuring alignment with his proven technical analysis approach.
- Customizable Settings : Enable/disable individual indicators and fine-tune parameters to suit your trading style while retaining the option to revert to Şatıroğlu’s defaults.
- Enhanced User Experience : Modifications improve visual clarity, performance, and usability, with options like repainting smoothing for Nadaraya-Watson and adjustable Ichimoku projection periods.
- Multi-Timeframe Analysis : Combines trend-following, momentum, and divergence tools for a holistic view of market dynamics.
- Alert Conditions : Built-in alerts for SuperTrend direction changes, buy/sell signals, and divergence detections to keep you informed.
- Visual Clarity : Overlays (KAMA, SuperTrend, Nadaraya-Watson, Ichimoku) and pane-based indicators (WaveTrend, Divergences) are clearly distinguished, with customizable colors and styles.
Notes:
- The Nadaraya-Watson Envelope and Ichimoku Cloud may repaint in their default modes. Use the "Repainting Smoothing" option for Nadaraya-Watson or adjust Ichimoku settings to mitigate repainting if preferred.
- Published under the MIT License, with components licensed under GPL-3.0 (SuperTrend), CC BY-NC-SA 4.0 (Nadaraya-Watson), MPL 2.0 (Divergence), and TradingView's terms (Ichimoku Cloud).
Usage:
Add this indicator to your TradingView chart to leverage Tunç Şatıroğlu’s exact indicator configurations out of the box. Customize settings as needed to align with your strategy, and use the combined signals to identify trends, reversals, and divergences. Ideal for traders following Şatıroğlu’s methodologies or anyone seeking a powerful, all-in-one technical analysis tool.
Credits:
Original authors: LazyBear, HPotter, Alex Orekhov, LuxAlgo, LonesomeTheBlue, and TradingView.
Modifications and integration by beytun .
License:
Published under the MIT License, incorporating code under GPL-3.0, CC BY-NC-SA 4.0, MPL 2.0, and TradingView’s terms where applicable.

RSI Cloud v1.0 [PriceBlance] RSI Cloud v1.0 — Ichimoku-style Cloud on RSI(14), not on price.
Recalibrated baselines: EMA9 (Tenkan) for speed, WMA45 (Kijun) for stability.
Plus ADX-on-RSI to grade strength so you know when momentum persists or fades.
1. Introduction
RSI Cloud v1.0 applies an Ichimoku Cloud directly on RSI(14) to reveal momentum regimes earlier and cleaner than price-based views. We replaced Tenkan with EMA9 (faster, more responsive) and Kijun with WMA45 (slower, more stable) to fit a bounded oscillator (0–100). Forward spans (+26) and a lagging line (−26) provide a clear framework for trend bias and transitions.
To qualify signals, the indicator adds ADX computed on RSI—highlighting whether strength is weak, strong, or very strong, so you can decide when to follow, fade, or stand aside.
2. Core Mapping (Hook + Bullets)
At a glance: Ichimoku on RSI(14) with recalibrated baselines for a bounded oscillator.
Source: RSI(14)
Tenkan → EMA9(RSI) (fast, responsive)
Kijun → WMA45(RSI) (slow, stable)
Span A: classic Ichimoku midline, displaced +26
Span B: classic Ichimoku baseline, displaced +26
Lagging line: RSI shifted −26
3. Key Benefits (Why traders care)
Momentum regimes on RSI: position vs. Cloud = bull / bear / transition at a glance.
Cleaner confirmations: EMA9/WMA45 pairing cuts noise vs. raw 30/70 flips.
Earlier warnings: Cloud breaks on RSI often lead price-based confirmations.
4. ADX on RSI (Enhanced Strength Normalization)
Grade strength inside the RSI domain using ADX from ΔRSI:
ADX ≤ 20 → Weak (transparency = 60)
ADX ≤ 40 → Strong (transparency = 15)
ADX > 40 → Very strong (transparency = 0)
Use these tiers to decide when to trust, fade, or ignore a signal.
5. How to Read (Quick rules)
Bias / Regime
Bullish: RSI above Cloud and RSI > WMA45
Bearish: RSI below Cloud and RSI < WMA45
Neutral / Transition: all other cases
6. Settings (Copy & use)
RSI Length: 14 (default)
Tenkan: EMA9 on RSI · Kijun: WMA45 on RSI
Displacement: +26 (Span A/B) · −26 (Lagging)
Theme: PriceBlance Dark/Light
Visibility toggles: Cloud, Baselines, Lagging, labels/panel, Overbought/Oversold, Divergence, ADX-on-RSI (via transparency coloring)
7. Credits & License
Author/Brand: PriceBlance
Version: v1.0 (Free)
Watermark: PriceBlance • RSI Cloud v1.0
Disclaimer: Educational content; not financial advice.
8. CTA
If this helps, please ⭐ Star and Follow for updates & new tools.
Feedback is welcome—comment what you’d like added next (alerts, presets, visuals).

Ichimoku Cloud Indicator [TradingFinder] Kinko Hyo Cross Alerts🔵 Introduction
The Ichimoku Cloud (Ichimoku Kinko Hyo) is one of the most powerful and complete trading indicators in technical analysis. Originally developed by Japanese journalist Goichi Hosoda, the Ichimoku system combines multiple tools in one indicator, providing traders with instant insights into trend direction, support and resistance levels, and momentum. Unlike simple moving averages (SMA – Simple Moving Average), the Ichimoku Cloud (Kumo – Cloud) integrates dynamic elements that help traders forecast potential price action with greater clarity.
The Ichimoku Indicator (Ichimoku Signal System) is widely used across global markets, from Forex trading (FX – Foreign Exchange) to stocks, indices, and even cryptocurrencies. Its popularity comes from its ability to generate clear buy signals and sell signals based on the interaction of its components: Tenkan Sen (Conversion Line), Kijun Sen (Base Line), Senkou Span A, Senkou Span B, and Chikou Span (Lagging Line). When combined, these lines create the Ichimoku Cloud, which visually represents the balance between price action and market structure.
Ichimoku Cloud Lines Formulas :
Conversion Line (Tenkan Sen / Conversion Line) : Average of the highest high and lowest low over the past 9 periods => (9-PH + 9-PL) ÷ 2
Base Line (Kijun Sen / Base Line) : Average of the highest high and lowest low over the past 26 periods => (26-PH + 26-PL) ÷ 2
Leading Span A (Senkou Span A / Leading Span A) : Average of the Conversion Line and Base Line, plotted 26 periods ahead => (Tenkan Sen + Kijun Sen) ÷ 2
Leading Span B (Senkou Span B / Leading Span B) : Average of the highest high and lowest low over the past 52 periods, plotted 26 periods ahead => (52-PH + 52-PL) ÷ 2
Lagging Span (Chikou Span / Lagging Span) : Current closing price, plotted 26 periods behind.
One of the biggest advantages of the Ichimoku Trading Strategy (Ichimoku Cloud Trading System) is that it allows traders to identify the market condition at a glance. When the price is above the Kumo (Cloud), it indicates a bullish trend (uptrend). When the price is below the Kumo, the market is in a bearish trend (downtrend). And when the price is inside the cloud, the market is ranging (sideways trend). This simplicity and visual clarity make Ichimoku an essential indicator for both beginner traders and professional analysts.
The Ichimoku Cloud Indicator (Ichimoku Technical Analysis Tool) continues to be one of the most reliable charting methods. Traders often consider it superior to basic moving averages (MA – Moving Average) or exponential moving averages (EMA – Exponential Moving Average), because it not only shows trend direction but also highlights potential future support and resistance levels. With its unique combination of trend analysis, price forecasting, and trading signals, Ichimoku remains a core strategy in modern trading systems.
🔵 How to Use
The Ichimoku Cloud is more than just a set of lines; it’s a complete trading system that helps traders identify trends, momentum, and key support and resistance levels. By combining its five lines Conversion Line, Base Line, Leading Span A, Leading Span B, and Lagging Span traders can develop clear buy and sell strategies.
🟣 Identifying Trend Direction
Bullish Trend (Uptrend) : Price is above the cloud (Kumo), and the cloud is green. Leading Span A is above Leading Span B, signaling strong upward momentum.
Bearish Trend (Downtrend) : Price is below the cloud, and the cloud is red. Leading Span A is below Leading Span B, confirming a downward momentum.
Ranging / Sideways Market : Price is inside the cloud, indicating indecision and consolidation. Traders often avoid opening strong positions during these periods.
🟣 Buy Strategies
Conversion/Base Line Crossover : A buy signal occurs when the Conversion Line (Tenkan Sen) crosses above the Base Line (Kijun Sen). The signal is strongest when this crossover happens above the cloud.
Price Above Base Line : If the price moves above the Base Line while in an uptrend, it confirms bullish momentum and provides a favorable entry point.
Cloud Support Pullback : During a pullback in an uptrend, the price may touch or slightly enter the cloud. Traders can use the cloud as a dynamic support zone for buying opportunities.
Lagging Span Confirmation : Ensure the Lagging Span (Chikou Span) is above the price of 26 periods ago to confirm the strength of the bullish trend.
🟣 Sell Strategies
Conversion/Base Line Crossover : A sell signal is generated when the Conversion Line (Tenkan Sen) crosses below the Base Line (Kijun Sen). This signal is strongest when it occurs below the cloud.
Price Below Base Line : If the price falls below the Base Line in a downtrend, it confirms bearish momentum and strengthens the sell setup.
Cloud Resistance Pullback : During a bounce in a downtrend, the cloud acts as a resistance zone. Traders can enter sell positions when price approaches or touches the cloud from below.
Lagging Span Confirmation : The Lagging Span should be below the price of 26 periods ago, confirming downward momentum.
🟣 Cloud Breakout Signals
A strong buy occurs when the price breaks above the cloud from below, signaling a potential trend reversal.
A strong sell occurs when the price breaks below the cloud from above, indicating a shift toward a bearish trend.
🟣 Combining Signals for Stronger Entries
For higher probability trades, combine multiple signals : trend direction (cloud color and position), crossovers (Tenkan/Kijun), and Lagging Span position.
Avoid trading against the overall trend. For example, avoid buying when price is below a red cloud or selling when price is above a green cloud.
🔵 Setting
Tenkan Sen Period : Lookback period for Conversion Line (default: 9).
Kijun Sen Period : Lookback period for Base Line (default: 26).
Span B Period : Lookback period for Leading Span B, forms one Cloud boundary (default: 52).
Shift Lines : Periods forward for Cloud / backward for Lagging Span (default: 26).
Cross Tenkan/Kijun Alert : Alert on Conversion/Base Line crossover.
Cross Price/Tenkan Alert : Alert when price crosses Tenkan Sen.
Cross Price/Kijun Alert : Alert when price crosses Kijun Sen
🔵 Conclusion
The Ichimoku Cloud (Ichimoku Kinko Hyo) is much more than a simple indicator it is a complete trading system that combines trend detection, momentum analysis, and support/resistance identification in one view. By interpreting the position of price relative to the cloud, the interaction between Tenkan Sen (Conversion Line) and Kijun Sen (Base Line), the leading spans (Senkou Span A and B), and the Chikou Span (Lagging Line), traders can identify potential buy and sell opportunities with higher confidence.
The main advantage of the Ichimoku Cloud is its ability to provide a “one-look equilibrium” snapshot of the market. It highlights bullish trends when the price is above the cloud, bearish conditions when the price is below it, and indecision or transition when the price is inside the cloud. Crossovers, cloud breakouts, and confirmations by the Chikou Span strengthen the trading signals.
However, traders should keep in mind the limitations of the Ichimoku system. It is based on historical data and should not be used in isolation. Combining it with other tools such as RSI, volume analysis, or candlestick patterns can significantly improve accuracy and reduce false signals.

OBV Cloud v1.0 [PriceBlance]🌐 English
OBV Cloud v1.0 – Free & Open-Source
OBV Cloud v1.0 integrates On-Balance Volume (OBV) with a Cloud model and enhanced trend filters.
It helps traders quickly identify:
Money Flow Trend: OBV Cloud acts as a dynamic support/resistance zone.
Trend Filters: EMA9 (short-term) and WMA45 (medium-term) directly applied on OBV.
OBV–Price Divergence: Detects both regular and hidden bullish/bearish divergences.
Trend Strength: Measured with ADX calculated on OBV.
OBV Cloud is suitable for both swing and day trading, allowing traders to spot breakouts, reversals, or sustained trends through volume-based analysis.

Dual Ichimoku CloudDual timeframe Ichimoku cloud (1x - Lower Timeframe & 5x - Higher timeframe). Higher timeframe trend can be identified in the same chart.

pyogi24 Intraday Ichimoku + RSIcustom script to get entry exit
its based on the ichimoku cloud indicator
and the cross over of the leading ang lagging spans to get the signals,
its under development.
i have also integrated the vwap so we know the bias of the trend.
this should work on a trending day.

[DEM] Ichimoku Bars Ichimoku Bars is designed to color price bars based on their relationship to the Ichimoku Cloud (Kumo) by comparing the current close price to both Leading Span A and Leading Span B from the traditional Ichimoku system, but with added smoothing modifications. The indicator calculates the standard Ichimoku components using Donchian midlines for the Conversion and Base lines, then creates smoothed versions of Leading Span A (20-period RMA of the average between Conversion and Base lines) and Leading Span B (20-period RMA of the 52-period Donchian midline), both displaced forward by the lagging span period. Bars are colored green when price is above both leading spans (indicating strong bullish conditions above the cloud), red when price is below both leading spans (indicating strong bearish conditions below the cloud), and magenta when price is within the cloud (indicating neutral or transitional conditions), providing traders with immediate visual feedback about price position relative to the Ichimoku equilibrium zone.
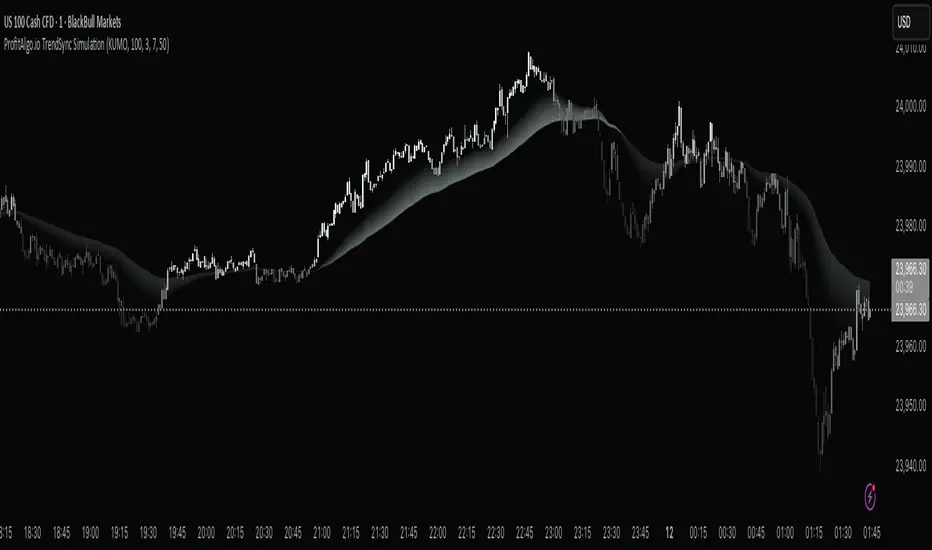
ProfitAlgo.io TrendSync SimulationThe TrendSync Simulation is a gradient-based trend-following framework that helps traders quickly identify bullish vs bearish market structure while filtering out short-term noise.
Instead of relying on a single moving average or indicator, TrendSync builds a layered “trend cloud” in 3 different MODES, KUMO, PFA, HMA anchored against a reference band. These layers create a visual gradient that shifts with market direction.
When combined with its color-adaptive candles, you can turn off your candle setting colors within the chart settings of TradingView for the TrendSync color mapping which transforms raw price action into an easy-to-read flow map of institutional momentum.
📊 How It Works
Each layer creates a smooth gradient that shifts with trend direction:
Bullish trends form a rising, green-shaded cloud.
Bearish trends form a descending, red-shaded cloud.
Transitions appear as fading or compressing gradients, signaling potential reversals or consolidations.
Candles are also dynamically colored based on normalized momentum, allowing traders to see directional strength at a glance.
🔑 Key Features
✅ Gradient Cloud – A layered trend structure that visually shifts from bearish → bullish.
✅ Multiple Modes – Choose between KUMO, PFA, or HMA logic for responsiveness vs. smoothness.
✅ Dynamic Trend Candles – Bars adapt color based on momentum strength.
✅ Customizable Visualization – Adjust transparency, colors, and gradient strength to fit your chart style.
✅ Clarity of Direction – Highlights dominant flow while reducing noise from minor fluctuations.
⚙️ Settings Explained
Trend Method (KUMO / PFA / HMA): Controls the type of moving average used for the cloud.
Gradient Colors: Define the shading of bullish vs. bearish zones.
Transparency Controls: Adjust how strong or subtle the gradient cloud appears.
Lookback Length : Longer = smoother trend; shorter = more reactive.
💡 Use Cases
Identify trend bias quickly without switching between multiple indicators.
Confirm entries with liquidity or breakout strategies by aligning with the cloud.
Detect weakening or strengthening momentum via gradient compression.
Avoid trading against dominant higher time-frame flow with trend-colored candles .
⚡ Why It Matters
Markets often look chaotic on raw candlestick charts. TrendSync cuts through that noise by layering moving averages into a visual gradient, revealing institutional momentum in real time. Whether scalping, day trading, or swing trading, TrendSync provides a synchronized view of trend direction that adapts to different trading styles.
⚡ Paired with the Back End Order Matrix, TrendSync provides the clarity of direction after liquidity zones are exposed, creating a complete institutional-style framework inside TradingView.
EXAMPLE 1A
EXAMPLE 1B
EXAMPLE 1C
EXAMPLE 2A
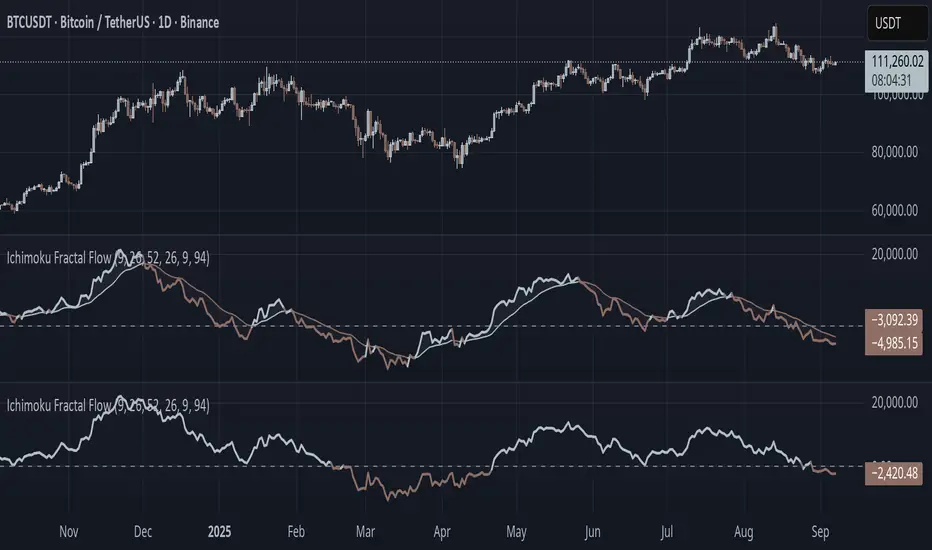
Ichimoku Fractal Flow### Ichimoku Fractal Flow (IFF)
By Gurjit Singh
Ichimoku Fractal Flow (IFF) distills the Ichimoku system into a single oscillator by merging fractal echoes of price and cloud dynamics into one flow signal. Instead of static Ichimoku lines, it measures the "flow" between Conversion/Base, Span A/B, price echoes, and cloud echoes. The result is a multidimensional oscillator that reveals hidden rhythm, momentum shifts, and trend bias.
#### 📌 Key Features
1. Fourfold Fusion – The oscillator blends:
* Phase: Tenkan vs. Kijun spread (short vs. medium trend).
* Kumo Phase: Span A vs. Span B spread (cloud thickness).
* Echo: Price vs lagged reflection.
* Cloud Echo: Price vs. projected cloud center.
2. Oscillator Output – A unified flow line oscillating around zero.
3. Dual Calculation Modes – Oscillator can be built using:
* High-Low Midpoint (classic Ichimoku-style averaging).
* Wilder’s RMA (smoother, less noisy averaging averaging).
4. Optional Smoothing – EMA or Wilder’s RMA creates a trend line, enabling MACD-style crossovers.
5. Dynamic Coloring – Bullish/Bearish color shifts for quick bias recognition.
6. Fill Styling – Highlighted regions between oscillator & smoothing line.
7. Zero Line Reference – Acts as a structural pivot (bull vs. bear).
#### 🔑 How to Use
1. Add to Chart: Works across all assets and timeframes.
2. Flow Bias (Zero Line):
* Above 0 → Bullish flow 🐂
* Below 0 → Bearish flow 🐻
3. With Signal Line:
* Oscillator above smoothing line → Possible upward trend shift.
* Oscillator below smoothing line → Possible downward trend shift.
4. Strength:
* Wide separation from smoothing = strong trend.
* Flat, tight clustering = indecision/range.
5. Contextual Edge: Combine signals with Ichimoku Cloud analysis for stronger confluence.
#### ⚙️ Inputs & Options
* Conversion Line (Tenkan, default 9)
* Base Line (Kijun, default 26)
* Leading Span B (default 52)
* Lag/Lead Shift (default 26)
* Oscillator Mode: High-Low Midpoint vs Wilder’s RMA
* Use Smoothing (toggle on/off)
* Signal Smoothing: Wilder/EMA option
* Smoothing Length (default 9)
* Bullish/Bearish Colors + Transparency
#### 💡 Tips
* Wilder’s RMA (both oscillator & smoothing) is gentler, reducing whipsaws in sideways markets.
* High-Low Mid captures pure Ichimoku-style ranges, good for structure-based traders.
* EMA reacts faster than RMA; use if you want early momentum signals.
* Zero-line flips act like momentum pivots—watch them near cloud boundaries.
* Signal line crossovers behave like MACD-style triggers.
* Strongest signals appear when oscillator, signal line, and Ichimoku Cloud all align.
👉 In short: Ichimoku Fractal Flow compresses multi-layered Ichimoku system into a single fractal oscillator that detects flow, pivotal shifts, and momentum with clarity—bridging price, cloud, and echoes into one signal. Where the cloud shows structure, IFF reveals the underlying flow. Together, they offer a fractal lens into market rhythm.
Alexmoku Genesis v0.2.6 — Runtime BulletproofAlexmoku Genesis v0.2.6 – Reinventing Ichimoku with Precision and Intelligence
Built by Alex • Engineered for traders who demand more than lagging clouds
🔬 Overview
Alexmoku Genesis is a ground-up reimagining of the traditional Ichimoku system — retaining its philosophical foundations of harmony, balance, and structure, while infusing it with modern logic, advanced volatility modeling, and AI-aligned signal classification.
This is not your grandfather’s Ichimoku. Genesis transforms it into a forward-sensing, volatility-aware system that adapts in real time and guides discretionary and algorithmic traders alike with smarter signals, predictive structure, and built-in trade intelligence.
⚙️ Core Enhancements
📐 Volatility-Responsive Smoothing
Tenkan-sen and Kijun-sen lengths are dynamically adjusted based on recent price volatility (ATR-based).
Prevents overreaction in choppy markets and improves responsiveness during strong trends.
🌀 Adaptive Cloud Projection
Span A and Span B are still projected 52 periods forward — but cloud width adapts to market rhythm, not just static values.
🕵️ Enhanced Chikou Span (CKS+)
Chikou logic is upgraded to emphasize structure interaction, not just simple price overlay.
Useful for identifying support/resistance echoes and divergence validation.
🌐 Multi-Timeframe Cloud Awareness (Genesis Core)
Internal alignment checks between higher and lower timeframe Kumo positioning.
Future module support for overlaying MTF clouds.
🔖 Signal Classifier Engine (Experimental)
Each major structure event is tagged with signal intent:
📦 prep
🚀 launch
🔁 reversion
🪤 trap
Enables faster discretionary reads or future automation.
🧠 Trust Score Logic (Coming soon)
Future versions will assign numerical trust scores (1–10) to trade setups based on confluence.
🧰 Settings
🔧 Volatility Scaling Factor – Adjusts how reactive the indicator is to volatility. Default: 300.
🌫 Displacement (Kumo) – Cloud projection forward. Default (and required): 52.
⛅ Cloud Display Toggle – Show/hide Kumo visuals without affecting logic.
⚡️ Future expansion modules already scaffolded (MTF overlays, color-coded signal classifiers, Trust Score engine, etc.)
🧘 Philosophy Behind the System
"This isn’t just about catching runners — it’s about becoming the kind of person who can trade with clarity, peace, and precision."
Alexmoku Genesis reflects the W.E.A.L.T.H. System's holistic philosophy:
Wealth
Engineered
Algorithmic
Leveraged
Trading
Holistically
Trading isn't just a strategy. It's a mirror. Genesis is designed to train both your execution and your awareness.
⚠️ Disclaimer
This tool is designed for experienced technical traders and is still in active development. Use judgment and proper risk management. This is not financial advice.

Ichimoku Sanmyo HelperHosoda’s Three Wisdoms — ATR & Sentiment
Purpose
This indicator combines the essence of **Hosoda’s Three Wisdoms** from Ichimoku Kinko Hyo:
1. Range (RTS) – measuring volatility compression (“market silence”).
2. Time (Cycle Sync) – tracking the rhythm of formation maturity.
3. Background (Sentiment Ratio S) – gauging demand/supply balance.
It provides a holistic way to see whether the market is maturing naturally and ready for a sustainable breakout.
How it works
RTS (Range-to-Short Ratio) = ATRshort / ATRbase
* ≤ 0.6 → strong compression, quiet market.
* 0.6–0.8 → moderate compression.
* > 0.8 → no compression, noisy market.
S (Sentiment Ratio) = ΣTR\_bull / ΣTR\_bear
* ≥ 0.6–0.7 → demand is nearly as strong as supply, bottoms are firm.
* ≪ 0.6 → supply dominates, fragile background.
Cycle Sync (Time) → candle count compared with Hosoda’s classic cycles: 9, 17, 26, 33, 42, 65, 76, 129.
Shows if structure is in rhythm or overstretched.
Visualization
* RTS and S lines plotted as oscillators.
* Background colors reflect compression and sentiment conditions.
* Cycle markers highlight alignment with Hosoda time rhythms.
How to use
1. Check RTS – quiet compression (≤ 0.6–0.7) is a good sign.
2. Look at S – if ≥ 0.6, demand is strong enough.
3. Evaluate Time – best setups align with Hosoda’s rhythms.
4. If all three wisdoms agree → market is mature, ready for breakout.
5. If one wisdom is off → wait, setup not fully ripe.
Summary
This is not a buy/sell system.
It is a market maturity filter, helping you distinguish between natural, healthy moves and noisy, fragile trends.

Ichimoku Cloud Signals [sgbpulse] Ichimoku Cloud Signals – Your Advanced Trading Tool
Meet Ichimoku Cloud Signals, the enhanced and interactive version of the classic Ichimoku Cloud indicator, designed specifically for TradingView traders seeking precision and flexibility in their trading decisions. This indicator allows you to maximize the Ichimoku's potential by customizing trend criteria, receiving clear visual signals for entering and exiting positions, and getting alerts to keep you informed.
Introduction to the Ichimoku Cloud
The Ichimoku Cloud, also known as Ichimoku Kinko Hyo, is a comprehensive technical analysis tool developed in Japan. It provides a broad view of the market: trend direction, momentum, and support and resistance levels. "Ichimoku Cloud Signals" takes this power and amplifies it with advanced features.
Key Components of the Ichimoku Cloud
The indicator displays all five familiar Ichimoku lines, along with the "Cloud" (Kumo):
Tenkan-sen (Conversion Line): Calculated as the average of the highest high and lowest low over the past 9 periods. A fast, short-term indicator used as a measure of immediate momentum.
Kijun-sen (Base Line): Calculated as the average of the highest high and lowest low over the past 26 periods. A medium-term reference line serving as a significant support/resistance level.
Senkou Span A (Leading Span A): The average of the Tenkan-sen and Kijun-sen, shifted 26 periods forward into the future.
Senkou Span B (Leading Span B): The average of the highest high and lowest low over the past 52 periods, also shifted 26 periods forward into the future.
Kumo (Cloud): The area between Senkou Span A and Senkou Span B. Its color changes: green for an uptrend (when Senkou Span A is above Senkou Span B) and red for a downtrend (when Senkou Span B is above Senkou Span A). The Cloud serves as a dynamic area of support/resistance and a tool for forecasting future trends.
Chikou Span (Lagging Span): The current closing price, shifted 26 periods backward into the past. It serves as a powerful trend confirmation tool.
How the Ichimoku Cloud Works and How to Interpret It
Trend Identification :
- Uptrend (Bullish): The price is above the Cloud. The higher the price is above the Cloud, the stronger the trend.
- Downtrend (Bearish): The price is below the Cloud. The lower the price is below the Cloud, the stronger the trend.
- Range/Consolidation: The price is within the Cloud. This indicates a market without a clear direction or one that is consolidating.
Support and Resistance:
- The Cloud itself acts as a dynamic area of support and resistance. In an uptrend, the Cloud serves as support. In a downtrend, it serves as resistance.
- A thick Cloud indicates stronger support/resistance levels, while a thin Cloud indicates weaker levels.
The Cloud as a Predictive Indicator:
The uniqueness of the Kumo (Cloud) lies in its ability to be shifted 26 periods forward. This part of the Cloud provides forecasts for future support and resistance levels and even suggests expected trend changes (like a "Kumo Twist" – a change in Cloud color), giving you a planning advantage.
Unique Advantages of Ichimoku Cloud Signals:
Ichimoku Cloud Signals takes the classic Ichimoku principles and gives you unprecedented control:
Focused Trend Selection:
Choose whether you want to analyze a bullish (uptrend) or bearish (downtrend) trend. The indicator will focus on the relevant criteria for your selection.
Customizable Trend Confirmation Criteria (8 Criteria):
The indicator relies on 8 key criteria for clear trend confirmation. You can enable or disable each criterion individually based on your trading strategy and desired risk level. Each criterion plays a vital role in confirming the strength of the trend:
- Price position relative to the Cloud (Kumo) (Default: true): Determines the main trend direction and whether it's bullish or bearish.
- Price position relative to Kijun-sen (Base Line) (Default: true): Indicates the medium-term trend and acts as a critical equilibrium level.
- Price position relative to Tenkan-sen (Conversion Line) (Default: false): Provides quick confirmation of current momentum and short-term market changes.
- Tenkan-sen (Conversion Line) / Kijun-sen (Base Line) Crossover (Default: true): A classic signal for momentum change, crucial for identifying entry points.
- Current Cloud trend (Kumo) (Default: false): Cloud color confirms the main trend direction in real-time.
- Projected Future Cloud trend (Kumo) (Default: true): Indicates an expected future change in the Cloud's trend, providing strong visual insight.
- Chikou Span (Lagging Span) position relative to the Cloud (Kumo) (Default: true): Confirms the current trend strength by comparing the price to the Ichimoku 26 periods ago.
- Chikou Span (Lagging Span) position relative to the Price (Default: false): Additional confirmation of trend strength, indicating buyer/seller dominance.
Full Customization of Ichimoku Parameters:
You can change the period lengths for each Ichimoku component, depending on your strategy:
- Conversion Line Length (Default: 9)
- Base Line Length (Default: 26)
- Leading Span Length (Default: 52)
- Cloud Lagging Length (Default: 26)
- Lagging Span Length (Default: 26)
Visual Criteria Table on the Chart:
Get immediate and clear feedback! A visual table is placed on the chart, showing in real-time which of the 8 criteria you have defined are met for your chosen trend. Criteria you have enabled will be highlighted with a blue color and a "➤" symbol, while disabled criteria will appear in a subtle gray shade. For each criterion, the table shows its real-time status with a "✔" symbol if the condition is met and an "✘" symbol if it is not met. This powerful visual tool provides a quick assessment, helps with learning, and allows for strategy optimization at the click of a button.
Precise Criteria Details in the Data Window:
Beyond the visual table, the indicator provides an additional critical layer of detail: for any point on the chart, you can hover over a candle and see in TradingView's Data Window the precise status and values of all eight criteria. For each criterion, you'll see a clear numerical value (1 or 0) indicating whether it's fully met (1) or not met (0). Additionally, you can inspect the exact numerical values of the Ichimoku lines (Tenkan-sen, Kijun-sen, etc.) at that specific moment. This comprehensive data supports in-depth analysis, strategy debugging, and long-term optimization, providing complete transparency regarding every component of the signal.
Smart and Customizable Alerts:
Ichimoku Cloud Signals provides a powerful alert system to keep you informed of key market movements, so you never miss an opportunity. There are eight unique alerts you can enable in TradingView's alert panel:
Uptrend Entry Alert: Triggers when all of your selected criteria for an uptrend are met on a new candle.
Uptrend Exit Alert: Triggers when one of your selected uptrend criteria is no longer met, signaling a potential exit point.
Downtrend Entry Alert: Triggers when all of your selected criteria for a downtrend are met on a new candle.
Downtrend Exit Alert: Triggers when one of your selected downtrend criteria is no longer met, signaling a potential exit point.
Bullish Crossover Alert: Triggers when the Conversion Line (Tenkan-sen) crosses above the Base Line (Kijun-sen), a classic signal for an upward momentum shift.
Bearish Crossover Alert: Triggers when the Conversion Line (Tenkan-sen) crosses below the Base Line (Kijun-sen), signaling a potential shift to downward momentum.
Bullish Cloud Breakout Alert: Triggers when the price closes above the Ichimoku Cloud (Kumo), indicating a strong bullish trend.
Bearish Cloud Breakout Alert: Triggers when the price closes below the Ichimoku Cloud (Kumo), indicating a strong bearish trend.
Each alert can be independently configured in TradingView's alert panel, allowing you to tailor your notifications to fit your exact trading strategy and risk management preferences.
Summary:
Ichimoku Cloud Signals is an essential tool for TradingView traders seeking control, clarity, and precision. It combines the power of the classic Ichimoku Cloud indicator with advanced customization capabilities, a convenient visual table, and clear signals, empowering you to make informed trading decisions and stay focused on managing your positions.
Important Note: Trading Risk
This indicator is intended for educational and informational purposes only and does not constitute investment advice or a recommendation for trading in any form whatsoever.
Trading in financial markets involves significant risk of capital loss. It is important to remember that past performance is not indicative of future results. All trading decisions are your sole responsibility. Never trade with money you cannot afford to lose.

Custom Ichimoku Cloud with Signals📊 OVERVIEW
This indicator generates trading signals based on Ichimoku Cloud breakouts and breakdowns. It identifies when price decisively moves through the cloud boundaries, filtering out false signals from consolidation periods.
📈 KEY FEATURES
- Transition-based signals only when price breaks through cloud
- Candle body must completely clear cloud (no touching)
- Alternating signal system prevents consecutive duplicate signals
- Built-in alerts for automated notifications
- Standard Ichimoku components included
⚙️ HOW IT WORKS
BUY SIGNAL: Triggered when candle body moves completely above cloud after being inside/below
SELL SIGNAL: Triggered when candle body moves completely below cloud after being inside/above
🎯 USE CASES
- Trend continuation trading
- Breakout trading strategies
- Cloud support/resistance analysis
- Multi-timeframe analysis
📝 PARAMETERS
- Adjustable Ichimoku periods (Conversion, Base, Lagging Span B)
- Customizable lookback period for transition detection
- Visual signal markers with alerts
⚠️ DISCLAIMER
This indicator is for educational purposes. Past performance doesn't guarantee future results. Always use proper risk management and combine with other analysis methods.
⚠️ DISCLAIMER & RISK WARNING
This indicator is provided for informational and educational purposes only and should not be considered as financial advice.
TRADING RISKS:
- Trading involves substantial risk of loss and is not suitable for all investors
- Past performance is not indicative of future results
- You can lose more than your initial investment
- Never trade with money you cannot afford to lose
NO GUARANTEES:
- This indicator does not guarantee profits or predict market movements with certainty
- Signals are based on mathematical calculations and may produce false signals
- Market conditions can change, making any strategy ineffective
- Success depends on multiple factors beyond this indicator
USER RESPONSIBILITY:
- You are solely responsible for your trading decisions
- Always conduct your own research and analysis
- Consider consulting with a qualified financial advisor
- Use proper risk management and position sizing
- Test thoroughly on demo accounts before live trading
TECHNICAL LIMITATIONS:
- Indicator may be subject to repainting in real-time conditions
- Historical results do not represent actual trading
- Signals are for analysis only, not automatic trade execution
- Performance varies across different timeframes and instruments
By using this indicator, you acknowledge that you understand these risks and accept full responsibility for your trading outcomes. The author assumes no liability for any losses incurred.
NOT FINANCIAL ADVICE - FOR EDUCATIONAL PURPOSES ONLY

kiwi 지표 통합 v6 MAX많이 사용하는 지표들을 하나의 지표로 만들었습니다.
주로 이동평균선을 기준으로 매매에 유용한 지표를 모았고
볼랜저밴드, 일목군형표를 하나의 지표로 만들었습니다.
특히, 캔들색이 한국 스타일을 원하는 사람에게 적합니다.
(빨간색 = 상승, 파란색 = 하락)
We made the most used indicators one indicator.
We collected indicators that are useful for trading mainly based on the moving average
The bolanger band and the Ilmok group table were made one indicator.
In particular, the candle color is written for those who want the Korean style.
(Red = Up, Blue = Down)

kiwi 지표 통합 v6 MAX많이 사용하는 지료들을 하나의 지표로 만들었습니다.
주로 이동평균선을 기준으로 매매에 유용한 지표를 모았고
볼랜저밴드, 일목군형표를 하나의 지표로 만들었습니다.
특히, 캔들색이 한국 스타일을 원하는 사람에게 적합니다.
(빨간색 = 상승, 파란색 = 하락)
I made a lot of used materials as an indicator.
We collected indicators that are useful for trading mainly based on the moving average
The bolanger band and the Ilmok group table were made one indicator.
In particular, the candle color is written for those who want the Korean style.
(Red = Up, Blue = Down)

RSI Ichimoku-like (Subchart) tohungmcThe RSI Ichimoku-like (Subchart) indicator offers a novel approach to technical analysis by uniquely combining the Relative Strength Index (RSI) with the principles of the Ichimoku Kinko Hyo system. Unlike traditional Ichimoku, which is applied to price data, this indicator innovatively uses RSI values to construct Ichimoku components (Conversion Line, Base Line, Leading Span 1, Leading Span 2, and Cloud). Displayed on a separate subchart, it provides traders with a powerful tool to analyze momentum and trend dynamics in a single, intuitive view.
Unique Features
Innovative RSI-based Ichimoku System: By applying Ichimoku calculations to RSI instead of price, this indicator creates a momentum-driven trend analysis framework, offering a fresh perspective on market dynamics.
Cloud Visualization: The cloud (formed between Leading Span 1 and 2) highlights bullish (green) or bearish (red) momentum zones, helping traders identify trend strength and potential reversals.
Customizable Parameters: Adjust RSI and Ichimoku periods to suit various trading styles and timeframes.
Subchart Design: Keeps your price chart clean while providing a dedicated space for momentum and trend analysis.
Components
RSI Line: A 14-period RSI (customizable) plotted in blue, with overbought (70) and oversold (30) levels marked for quick reference.
Conversion Line: Average of the highest and lowest RSI over 9 periods, acting as a short-term momentum indicator.
Base Line: Average of the highest and lowest RSI over 26 periods, serving as a medium-term trend guide.
Leading Span 1: Average of Conversion and Base Lines, shifted forward 26 periods.
Leading Span 2: Average of the highest and lowest RSI over 52 periods, shifted forward 26 periods.
Cloud: The area between Leading Span 1 and 2, colored green (bullish) when Span 1 is above Span 2, and red (bearish) when Span 2 is above Span 1.
How to Use
Momentum Analysis:
Monitor the RSI line for overbought (>70) or oversold (<30) conditions to spot potential reversals.
A RSI crossing above 30 or below 70 can indicate shifts in momentum.
Trend Identification:
When the RSI is above the cloud and the cloud is green, it suggests bullish momentum.
When the RSI is below the cloud and the cloud is red, it indicates bearish momentum.
Crossovers:
RSI crossing above the Conversion or Base Line may signal bullish opportunities, especially if aligned with a green cloud.
RSI crossing below these lines may suggest bearish opportunities, particularly with a red cloud.
Cloud Breakouts:
A RSI breaking through the cloud can signal a potential trend change, with the cloud’s color indicating the direction.
Customization:
Adjust the RSI Period (default: 14), Conversion Line Period (default: 9), Base Line Period (default: 26), and Leading Span 2 Period (default: 52) to match your trading timeframe or strategy.
Settings
RSI Period: Default 14. Increase for smoother signals or decrease for higher sensitivity.
Conversion Line Period: Default 9. Adjust for short-term momentum sensitivity.
Base Line Period: Default 26. Modify for medium-term trend analysis.
Leading Span 2 Period: Default 52. Tune for long-term trend context.
Why Closed Source?
The unique methodology of applying Ichimoku calculations to RSI, combined with optimized subchart visualization, represents a proprietary approach to momentum and trend analysis. Protecting the source code ensures the integrity of this innovative concept while allowing traders worldwide to benefit from its functionality.
Notes
This indicator does not generate explicit Buy/Sell signals, giving traders flexibility to interpret signals based on their strategies.
Best used in conjunction with other technical tools (e.g., support/resistance, candlestick patterns) for confirmation.
Suitable for all timeframes, from intraday to long-term trading.

SKT's Volume Weighted Ichimoku Conviction Candle ColoringOverview
This indicator is a customized, volume-weighted variation of the classic Ichimoku Kinko Hyo system, designed to provide traders with an "at-a-glance" visualization of trend conviction and exhaustion. It overlays dynamic candle coloring on your chart, using a smooth gradient from deep green (strong bullish conviction) to gray (neutral or exhausted) to deep red (strong bearish conviction). The colors are driven by a composite score (-10 to +10, displayed as -100% to +100% strength), which quantifies probabilistic bias based on historical Ichimoku patterns, normalized for volatility and enhanced with volume dynamics.
Unlike standard Ichimoku, this version emphasizes "conviction strength" through gradients, helping identify not just trends but their reliability—e.g., fading colors signal potential reversals or pullbacks. It's particularly suited for trending assets like BTC/USD on daily or higher timeframes, where volume-weighted adjustments make lines hug price action during high-participation moves.
Key Benefits
Visual Heat Map: Candles shift colors based on score intensity, making it easy to spot weakening trends (pale shades) or strong continuations (deep shades).
Exhaustion Detection: Incorporates slope flattening, volume divergences, and cloud thinning to proactively desaturate colors near potential turns.
Strength Box: A persistent top-right label shows current % strength (e.g., "+75% Bull"), synced to the candle gradient for quick reference.
Adaptability: Works on any timeframe/asset; inputs allow tuning (e.g., for crypto's 24/7 volatility).
How It Works
The indicator computes a conviction score per bar, ranging from -10 (max bearish) to +10 (max bullish), then maps it to candle colors and a % strength display. The score is a weighted sum of five factors (total 100%), each normalized by ATR for scale-invariance:
Base: Normalized Price-Cloud Distance (40% Weight): Measures how far price is above (bullish) or below (bearish) the cloud. Calculation: Distance / ATR, clamped via tanh sigmoid for smoothness. Penalty: Fades score if distance <0.5 ATR (approaching cloud edge). Rationale: Large separations historically predict ~60-70% continuation; proximity hints at reversals.
Cloud Thickness & Color Alignment (15% Weight): Thickness = |Senkou A - B| / ATR; compared to SMA average. Boost if thick (>average: up to +3); penalty if thin (<0.5 average: up to -3). +1 bonus if cloud color aligns (green bull, red bear). Rationale: Thicker clouds act as stronger support/resistance; thinning signals exhaustion.
Other Lines: Chikou & Tenkan/Kijun Positions (15% Weight): Chikou distance from price/cloud ( / ATR): +4 if aligned far; -0.5 penalty if misaligned. Tenkan-Kijun separation ( / ATR): +3 if diverging (>0.5 ATR). Averaged for contribution. Rationale: Chikou confirms momentum from history; diverging lines indicate strength.
Exhaustion: Slope Calculation (Tenkan/Kijun) (15% Weight): Avg slope = (Tenkan linreg * 0.7 + Kijun linreg * 0.3) / ATR. Boost if steep (>0.2 abs: +3); penalty if flat (<0.1 abs: -3) or declining in trend (-4). Doubled if lines converging (<0.5 ATR sep). Rationale: Flattening/declining slopes detect fading momentum early.
Exhaustion: Volume Boost/Penalty (15% Weight): Dynamic thresholds: High = SMA(vol) + STD; Low = max(SMA - STD, 0). Boost if vol > high & slope aligns (up to +3). Penalty if vol < low or slope diverges (up to -3); skipped on new-bar first tick (barstate.isnew). Symmetric clamp: volContrib bounded ±3 to avoid spikes. Rationale: High aligning volume confirms conviction; low/diverging signals traps/exhaustion.
Score clamped ±10 overall. Gradients use RGB mixing: Deep colors for high abs(score), desaturated near 0 for smooth fades. Neutral bars vary gray shades by cloud thickness.
Inputs and Customization
All parameters are adjustable via TradingView's indicator settings:
Tenkan/Kijun/Senkou B Periods (9/26/52): Standard Ichimoku lengths; increase for smoother lines on volatile assets.
Displacement (26): Cloud shift; tweak for forward projection.
ATR Length (14): Volatility normalizer; longer for less sensitivity.
Slope/Volume/Thickness Lookbacks (5/20/20): Periods for slopes, vol SMA/STD, cloud avg—balance responsiveness vs. noise.
Scale Factor (2.0): Controls sigmoid clamping sharpness; lower for more gradual scores.
For BTC/USD: Try 20/60/120 periods on 1H/4H for crypto's non-stop trading.
Usage Instructions
Add to your chart via TradingView's Indicators menu.
Interpret Gradients: Deep Green: Strong bull (>+70% strength)—ride trends. Pale Green: Weakening bull (~+20-50%)—watch for exhaustion. Gray: Neutral (inside cloud)—avoid directionals. Symmetric for reds (bearish).
Strength Box: Top-right label shows live % (updates per tick).
Combine with: RSI/MACD for reversals (e.g., RSI divergence + pale gradient = potential turn).
Timeframes: Works on all; daily+ for best results. Test settings per asset/TF.
Notes and Disclaimer
- Performance: Backtest on your assets—score aligns with ~60% historical continuation in strong trends, but markets are unpredictable.
- Limitations: Volume-sensitive on low-TF or illiquid assets (fixed with clamps/barstate.isnew); no built-in alerts (add via TradingView).
- Disclaimer: For educational purposes only—not financial advice. Past performance ≠ future results; use with risk management.

TableRSI and Ichimoku Strength Table
This indicator displays whole-number RSI values (1h, 4h, 1d, 3d, 1w) and Ichimoku strengths (Conversion Line, Base Line, Cloud, Lagging Span) in a customizable table. Toggle between horizontal (9x2) or vertical (2x10) layouts, with adjustable position (e.g., Top Right), text size (Tiny to Large), and colors (border, header, text, RSI: >70 red, <30 green, 30-70 yellow; Ichimoku: >50 green, <50 red). Ichimoku components are plotted on the chart. It offers a clear view of momentum and trend strength for traders.
Ichimoku Multi-Timeframe Status[nakano]### Ichimoku Multi-Timeframe Status
---
#### Overview
This indicator is a sophisticated multi-timeframe analysis tool specializing in the "Sanyaku Kouten" (Three Bullish Signals) and "Sanyaku Gyakuten" (Three Bearish Signals) of the Ichimoku Kinko Hyo.
The status panel, displayed in the bottom-right corner of the screen, allows you to simultaneously monitor the Ichimoku conditions across up to eight different timeframes. This enables you to grasp the trend direction from short-term to long-term at a glance and helps you not to miss entry opportunities.
Through extensive trial, error, and debugging, the signal determination logic has been crafted to achieve a high degree of precision.
---
#### Key Features
1. **Multi-Timeframe Status Panel**
* **Monitor Multiple Timeframes at Once**: Displays the status of up to seven different timeframes (defaulting to 1m, 5m, 15m, 1h, 4h, 1D, and 1W) in a single list, in addition to the current chart's timeframe.
* **Detailed Status Display**: For each timeframe, it clearly displays whether the "Tenkan-sen," "Kumo (Cloud)," and "Chikou Span" components are in a "Bullish," "Bearish," or "— (Neutral)" state, color-coded for intuitive understanding.
* **Overall Judgment**: It comprehensively evaluates the state of each component to display a final signal of "Sanyaku Kouten" or "Sanyaku Gyakuten" in the panel.
2. **High-Precision Signal Logic**
* **Cloud Breakout**: Adopts a stricter logic, judging "Bullish" or "Bearish" breakouts only when the **real body** of the candlestick has completely broken out of the Kumo, not just the wicks.
* **Lagging Span (Chikou Span)**: Determines if the Chikou Span has clearly broken above/below the **real body** of the past candlestick. By consistently comparing it to the top/bottom of the real body, regardless of whether the candle is bullish or bearish, it captures more accurate signals.
* **Display Accuracy**: The common one-period display lag seen in many Ichimoku indicators for the Chikou Span and Kumo has been precisely corrected in both calculation and plotting.
3. **Alert Functionality**
* You can create TradingView alerts that trigger the moment a "Sanyaku Kouten" or "Sanyaku Gyakuten" is confirmed on the current timeframe. This allows you to receive notifications of opportunities without being tied to your chart.
4. **High Customizability**
* **Toggle Displays**: The status panel and the "Bullish"/"Bearish" labels on the chart can be easily toggled on or off from the settings menu. (Signal labels are off by default).
* **Complete Color Settings**: You can freely set the colors for all plotted elements, including the Tenkan-sen, Kijun-sen, Chikou Span, Kumo border lines, and Kumo background (for up and down clouds), allowing you to match your personal chart theme.
---
#### How to Use
1. **Add the indicator to your chart.**
2. **Open the settings menu.**
* **Display Settings**: Toggle the visibility of the on-chart signal labels and the status panel.
* **Timeframe Settings**: Freely configure up to seven timeframes you wish to monitor in the status panel.
* **Ichimoku Parameters**: Adjust the periods for the Tenkan-sen, Kijun-sen, etc., to fit your analysis.
* **Line Color Settings**: Customize the colors of the Ichimoku lines and the Kumo to your preference.
3. **Setting Up Alerts**
* Open the TradingView alert creation dialog.
* For "Condition," select this indicator (`Ichimoku Multi-Timeframe Status `).
* Choose either the "Sanyaku Kouten" or "Sanyaku Gyakuten" alert condition and configure your notification settings.
I hope this tool serves as a valuable aid in your market analysis and trading.
---
---
---
### Ichimoku Multi-Timeframe Status
---
#### 概要
このインジケーターは、一目均衡表の「三役好転・三役逆転」に特化した高機能なマルチタイムフレーム分析ツールです。
画面の右下に表示されるステータスパネルにより、最大8つの異なる時間足における一目均衡表の状況を同時に監視できます。これにより、短期から長期までのトレンドの方向性を一目で把握し、エントリーチャンスを逃しません。
多くの試行錯誤とデバッグを経て、シグナル判定のロジックは高い精度を持つように作り込まれています。
---
#### 主な機能
1. **マルチタイムフレーム・ステータスパネル**
* **複数時間足の一括監視**: 現在のチャートの足に加えて、最大7つの異なる時間足(デフォルトでは1分、5分、15分、1時間、4時間、日足、週足)の状況を一覧表示します。
* **詳細な状態表示**: 各時間足について、「転換線」「雲」「遅行スパン」の各要素が「好転」「逆転」「−(どちらでもない)」のいずれの状態にあるかを色付きで分かりやすく表示します。
* **総合判断**: 各要素の状態を総合的に判断し、最終的なシグナルとして「三役好転」または「三役逆転」をパネルに表示します。
2. **精度の高いシグナル判定ロジック**
* **雲抜け**: ローソク足のヒゲではなく、**実体が完全に雲を抜けた**場合のみ「好転」「逆転」と判定する、より厳密なロジックを採用しています。
* **遅行スパン**: 遅行スパンが、過去のローソク足の**実体**を明確に上抜け/下抜けしたかを判定します。陰線・陽線に関わらず、常に実体の上限/下限と比較するため、より正確なシグナルを捉えます。
* **表示の正確性**: 多くのインジケーターで見られる遅行スパンや雲の1期間の表示ズレを、計算と描画の両面で正確に補正しています。
3. **アラート機能**
* 現在のチャートの時間足で「三役好転」または「三役逆転」が成立した瞬間に、TradingViewのアラートを発生させることができます。これにより、チャンスを逃さず通知を受け取ることが可能です。
4. **高いカスタマイズ性**
* **表示の切り替え**: ステータスパネルや、チャート上に表示される「好転」「逆転」のラベルは、設定画面から表示/非表示を簡単に切り替えられます。(シグナルラベルはデフォルトで非表示)
* **完全なカラー設定**: 転換線、基準線、遅行スパン、雲の縁取り線、雲の背景色(上昇/下降)など、描画されるすべての要素の色を自由に設定でき、ご自身のチャートテーマに合わせることが可能です。
---
#### 使い方
1. **インジケーターをチャートに追加します。**
2. **設定画面を開きます。**
* **表示設定**: チャート上のシグナルラベルや、ステータスパネルの表示/非表示を切り替えます。
* **時間足設定**: ステータスパネルで監視したい時間足を最大7つまで自由に設定します。
* **一目均衡表パラメータ**: ご自身の分析に合わせて、転換線や基準線などの期間設定を変更できます。
* **ラインカラー設定**: チャートに表示される一目均衡表の各ラインや雲の色を、お好みの色にカスタマイズします。
3. **アラートの設定**
* TradingViewのアラート作成画面を開きます。
* 「条件」でこのインジケーター(`Ichimoku Multi-Timeframe Status `)を選択します。
* 「三役好転」または「三役逆転」のいずれかのアラート条件を選択し、通知設定を行ってください。
環境認識の補助ツールとして、皆様のトレードの一助となれば幸いです。