AssetCorrelationLibraryLibrary "AssetCorrelationLibrary™"
detectIndicesFutures(ticker)
Detects Index Futures (NQ/ES/YM/RTY + micro variants)
Parameters:
ticker (string) : The ticker string to check (typically syminfo.ticker)
Returns: AssetPairing with secondary and tertiary assets configured
detectMetalsFutures(ticker)
Detects Metal Futures (GC/SI/HG + micro variants)
Parameters:
ticker (string) : The ticker string to check
Returns: AssetPairing with secondary and tertiary assets configured
detectForexFutures(ticker)
Detects Forex Futures (6E/6B + micro variants)
Parameters:
ticker (string) : The ticker string to check
Returns: AssetPairing with secondary and tertiary assets configured
detectEnergyFutures(ticker)
Detects Energy Futures (CL/RB/HO + micro variants)
Parameters:
ticker (string) : The ticker string to check
Returns: AssetPairing with secondary and tertiary assets configured
detectTreasuryFutures(ticker)
Detects Treasury Futures (ZB/ZF/ZN)
Parameters:
ticker (string) : The ticker string to check
Returns: AssetPairing with secondary and tertiary assets configured
detectForexCFD(ticker, tickerId)
Detects Forex CFD pairs (EUR/GBP/DXY, USD/JPY/CHF triads)
Parameters:
ticker (string) : The ticker string to check
tickerId (string) : The full ticker ID (syminfo.tickerid) for primary asset
Returns: AssetPairing with secondary and tertiary assets configured
detectCrypto(ticker, tickerId)
Detects major Crypto assets (BTC, ETH, SOL, XRP, alts)
Parameters:
ticker (string) : The ticker string to check
tickerId (string) : The full ticker ID for primary asset
Returns: AssetPairing with secondary and tertiary assets configured
detectMetalsCFD(ticker, tickerId)
Detects Metals CFD (XAU/XAG/Copper)
Parameters:
ticker (string) : The ticker string to check
tickerId (string) : The full ticker ID for primary asset
Returns: AssetPairing with secondary and tertiary assets configured
detectIndicesCFD(ticker, tickerId)
Detects Indices CFD (NAS100/SP500/DJ30)
Parameters:
ticker (string) : The ticker string to check
tickerId (string) : The full ticker ID for primary asset
Returns: AssetPairing with secondary and tertiary assets configured
detectEUStocks(ticker, tickerId)
Detects EU Stock Indices (GER40/EU50) - Dyad only
Parameters:
ticker (string) : The ticker string to check
tickerId (string) : The full ticker ID for primary asset
Returns: AssetPairing with secondary asset configured (tertiary empty for dyad)
getDefaultFallback(tickerId)
Returns default fallback assets (chart ticker only, no correlation)
Parameters:
tickerId (string) : The full ticker ID for primary asset
Returns: AssetPairing with chart ticker as primary, empty secondary/tertiary (no correlation)
applySessionModifierWithBackadjust(tickerStr, sessionType)
Applies futures session modifier to ticker WITH back adjustment
Parameters:
tickerStr (string) : The ticker to modify
sessionType (string) : The session type (syminfo.session)
Returns: Modified ticker string with session and backadjustment.on applied
applySessionModifierNoBackadjust(tickerStr, sessionType)
Applies futures session modifier to ticker WITHOUT back adjustment
Parameters:
tickerStr (string) : The ticker to modify
sessionType (string) : The session type (syminfo.session)
Returns: Modified ticker string with session and backadjustment.off applied
isTriadMode(pairing)
Checks if a pairing represents a valid triad (3 assets)
Parameters:
pairing (AssetPairing) : The AssetPairing to check
Returns: True if tertiary is non-empty (triad mode), false for dyad
getAssetTicker(tickerId)
Extracts clean ticker string from full ticker ID
Parameters:
tickerId (string) : The full ticker ID (e.g., "BITGET:BTCUSDT.P")
Returns: Clean ticker string (e.g., "BTCUSDT.P")
resolveTriad(chartTickerId, pairing)
Resolves triad asset assignments with proper inversion flags
Parameters:
chartTickerId (string) : The current chart's ticker ID (syminfo.tickerid)
pairing (AssetPairing) : The detected AssetPairing
Returns: Tuple
resolveDyad(chartTickerId, pairing)
Resolves dyad asset assignment with proper inversion flag
Parameters:
chartTickerId (string) : The current chart's ticker ID
pairing (AssetPairing) : The detected AssetPairing (dyad: tertiary is empty)
Returns: Tuple
resolveAssets(ticker, tickerId, assetType, sessionType, useBackadjust)
Main auto-detection entry point. Detects asset category and returns fully resolved config.
Parameters:
ticker (string) : The ticker string to check (typically syminfo.ticker)
tickerId (string) : The full ticker ID (typically syminfo.tickerid)
assetType (string) : The asset type (typically syminfo.type)
sessionType (string) : The session type for futures (typically syminfo.session)
useBackadjust (bool) : Whether to apply back adjustment for futures session alignment
Returns: AssetConfig with fully resolved assets, inversion flags, and detection status
resolveCurrentChart()
Simplified auto-detection using current chart's syminfo values
Returns: AssetConfig with fully resolved assets, inversion flags, and detection status
AssetPairing
Core asset pairing structure for triad/dyad configurations
Fields:
primary (series string) : The primary (chart) asset ticker ID
secondary (series string) : The secondary correlated asset ticker ID
tertiary (series string) : The tertiary correlated asset ticker ID (empty for dyad)
invertSecondary (series bool) : Whether secondary asset should be inverted for divergence calc
invertTertiary (series bool) : Whether tertiary asset should be inverted for divergence calc
AssetConfig
Full asset resolution result with mode detection and computed values
Fields:
detected (series bool) : Whether auto-detection succeeded
isTriadMode (series bool) : True if triad (3 assets), false if dyad (2 assets)
primary (series string) : The resolved primary asset ticker ID
secondary (series string) : The resolved secondary asset ticker ID
tertiary (series string) : The resolved tertiary asset ticker ID (empty for dyad)
invertSecondary (series bool) : Computed inversion flag for secondary asset
invertTertiary (series bool) : Computed inversion flag for tertiary asset
assetCategory (series string) : String describing the detected asset category
Note to potential users.
I did not really intend to make this public but i have to in order to avoid any potential compliance issues with the TradingView Moderation Team and the House Rules.
However if you are to use this library, you cannot make your code closed source / invite only as it is intellectual property. The only exception to this is if I am credited in the header of your code and i explicitly give permission to do so.
As per the TradingView house rules, you are completely FREE to do with this as you like, provided the script stays private.
Use the @fstarcapital tag to give credits
❤️ from cephxs
Ict

Market Structure Report Library [TradingFinder]🔵 Introduction
Market Structure is one of the most fundamental concepts in Price Action and Smart Money theory. In simple terms, it represents how price moves between highs and lows and reveals which phase of the market cycle we are currently in uptrend, downtrend, or transition.
Each structure in the market is formed by a combination of Breaks of Structure (BoS) and Changes of Character (CHoCH) :
BoS occurs when the market breaks a previous high or low, confirming the continuation of the current trend.
CHoCH occurs when price breaks in the opposite direction for the first time, signaling a potential trend reversal.
Since price movement is inherently fractal, market structure can be analyzed on two distinct levels :
Major / External Structure: represents the dominant macro trend.
Minor / Internal Structure: represents corrective or smaller-scale movements within the larger trend.
🔵 Library Purpose
The “Market Structure Report Library” is designed to automatically detect the current market structure type in real time.
Without drawing or displaying any visuals, it analyzes raw price data and returns a series of logical and textual outputs (Return Values) that describe the current structural state of the market.
It provides the following information :
Trend Type :
External Trend (Major): Up Trend, Down Trend, No Trend
Internal Trend (Minor): Up Trend, Down Trend, No Trend
Structure Type :
BoS : Confirms trend continuation
CHoCH : Indicates a potential trend reversal
Consecutive BoS Counter : Measures trend strength on both Major and Minor levels.
Candle Type : Returns the current candle’s condition(Bullish, Bearish, Doji)
This library is specifically designed for use in Smart Money–based screeners, indicators, and algorithmic strategies.
It can analyze multiple symbols and timeframes simultaneously and return the exact structure type (BoS or CHoCH) and trend direction for each.
🔵 Function Outputs
The function MS() processes the price data and returns seven key outputs,
each representing a distinct structural state of the market. These values can be used in indicators, strategies, or multi-symbol screeners.
🟣 ExternalTrend
Type : string
Description : Represents the direction of the Major (External) market structure.
Possible values :
Up Trend
Down Trend
No Trend
This is determined based on the behavior of Major Pivots (swing highs/lows).
🟣 InternalTrend
Type : string
Description : Represents the direction of the Minor (Internal) market structure.
Possible values :
Up Trend
Down Trend
No Trend
🟣 M_State
Type : string
Description : Specifies the type of the latest Major Structure event.
Possible values :
BoS
CHoCH
🟣 m_State
Type : string
Description : Specifies the type of the latest Minor Structure event.
Possible values :
BoS
CHoCH
🟣 MBoS_Counter
Type : integer
Description : Counts the number of consecutive structural breaks (BoS) in the Major structure.
Useful for evaluating trend strength :
Increasing count: indicates trend continuation.
Reset to zero: typically occurs after a CHoCH.
🟣 mBoS_Counter
Type : integer
Description : Counts the number of consecutive structural breaks in the Minor structure.
Helps analyze the micro structure of the market on lower timeframes.
Higher value : strong internal trend.
Reset : indicates a minor pullback or reversal.
🟣 Candle_Type
Type : string
Description : Represents the type of the current candle.
Possible values :
Bullish
Bearish
Doji
import TFlab/Market_Structure_Report_Library_TradingFinder/1 as MSS
PP = input.int (5 , 'Market Structure Pivot Period' , group = 'Symbol 1' )
= MSS.MS(PP)

Killzones And Macros LibraryKillzones & Macros Library for Trading Sessions
This Pine Script library is designed to help traders identify and act during high-volatility trading windows, commonly referred to as "Killzones." These are specific times during the day when institutional traders are most active, resulting in increased liquidity and price movement. The library provides boolean fields that return true when the current time falls within one of the killzones or macroeconomic event windows, allowing for enhanced trade timing and precision.
Killzones Include:
London Open, New York Open, Midnight Open, London Lunch, New York PM, and more.
Capture high-volume periods like Power Hour, Equities Open, and Asian Range.
Macros:
Identify key moments like London 02:33, New York 08:50, and other significant times aligned with market movements or events.
This library is perfect for integrating into your custom strategies, backtesting, or setting alerts for optimal trade execution during major trading sessions and events.

Order Block Drawing [TradingFinder]🔵 Introduction
Perhaps one of the most challenging tasks for Pine script developers (especially beginners) is properly drawing order blocks. While utilizing the latest technical analysis methods for "Price Action," beginners heavily rely on accurately plotting "Supply" and "Demand" zones, following concepts like "Smart Money Concept" and "ICT".
However, drawing "Order Blocks" may pose a challenge for developers. Therefore, to minimize bugs, increase accuracy, and speed up the process of coding order blocks, we have released the "Order Block Drawing" library.
Below, you can read more details about how to use this library.
Important :
This library has direct and indirect outputs. The indirect output includes the ranges of order blocks plotted on the chart. However, the direct output is a "Boolean" value that becomes "true" only when the price touches an order block, colloquially termed as "Mitigate." You can use this output for setting up alerts.
🔵 How to Use
First, you can add the library to your code as shown in the example below.
import TFlab/OrderBlockDrawing_TradingFinder/1
🟣Parameters
OBDrawing(OBType, TriggerCondition, DistalPrice, ProximalPrice, Index, OBValidDis, Show, ColorZone) =>
Parameters:
• OBType (string)
• TriggerCondition (bool)
• DistalPrice (float)
• ProximalPrice (float)
• Index (int)
• OBValidDis (int)
• Show (bool)
• ColorZone (color)
OBType : All order blocks are summarized into two types: "Supply" and "Demand." You should input your order block type in this parameter. Enter "Demand" for drawing demand zones and "Supply" for drawing supply zones.
TriggerCondition : Input the condition under which you want the order block to be drawn in this parameter.
DistalPrice : Generally, if each zone is formed by two lines, the farthest line from the price is termed "Distal." This input receives the price of the "Distal" line.
ProximalPrice : Generally, if each zone is formed by two lines, the nearest line to the price is termed "Proximal" line.
Index : This input receives the value of the "bar_index" at the beginning of the order block. You should store the "bar_index" value at the occurrence of the condition for the order block to be drawn and input it here.
OBValidDis : Order blocks continue to be drawn until a new order block is drawn or the order block is "Mitigate." You can specify how many candles after their initiation order blocks should continue. If you want no limitation, enter the number 4998.
Show : You may need to manage whether to display or hide order blocks. When this input is "On", order blocks are displayed, and when it's "Off", order blocks are not displayed.
ColorZone : You can input your preferred color for drawing order blocks.
🔵 Function Outputs
This function has only one output. This output is of type "Boolean" and becomes "true" only when the price touches an order block. Each order block can be touched only once and then loses its validity. You can use this output for alerts.
= Drawing.OBDrawing('Demand', Condition, Distal, Proximal, Index, 4998, true, Color)

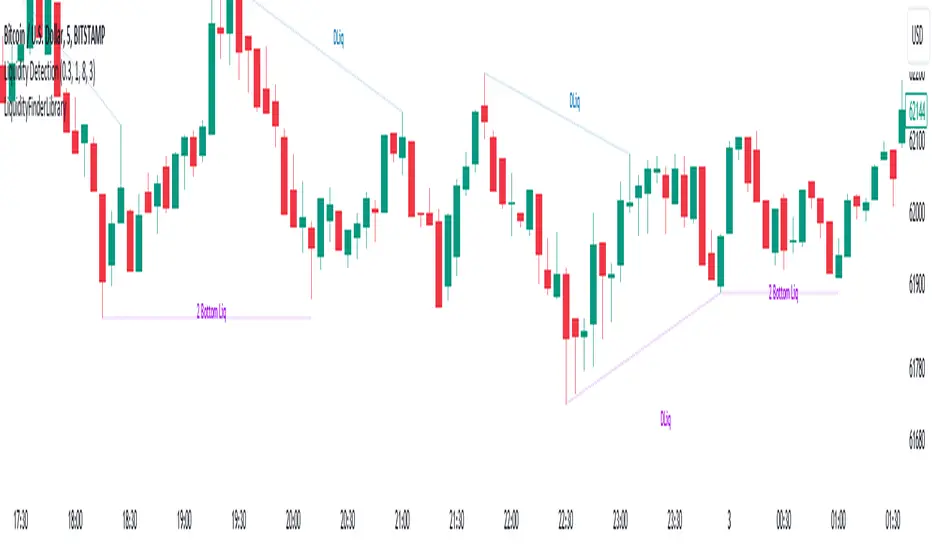
Liquidity Finder Library🔵 Introduction
You may intend to utilize the "Liquidity" detection capability in your indicators. Instead of writing it, you can import the "Liquidity Finder" library into your code. One of the advantages of this approach is time-saving and reduction in scripting errors.
🔵 Key Features
Identification of "Statics Liquidity"
Identification of "Dynamics Liquidity"
🔵 How to Use
Firstly, you can add the library to your code as shown in the example below :
import TFlab/LiquidityFinderLibrary/1 as Liq
The parameters of the "LLF" function are as follows :
sPP : A float variable ranging from 0 to 0.4. Increasing this number decreases the sensitivity of the "Statics Liquidity Line Detection" function and increases the number of detected lines. The default value is 0.3.
dPP : A float variable ranging from 0.4 to 1.95. Increasing this number increases the sensitivity of the "Dynamics Liquidity Line Detection" function and decreases the number of detected lines. The default value is 1.
SRs : An int variable. By default, it's set to 8. You can change this number to specify the periodicity of static liquidity pivot lines.
SRd : An int variable. By default, it's set to 3. You can change this number to specify the periodicity of dynamic liquidity pivot lines.
ShowHLLs : A bool variable. You can enable or disable the display of "High Statics Liquidity Line".
ShowLLLs : A bool variable. You can enable or disable the display of "Low Statics Liquidity Line".
ShowHLLd : A bool variable. You can enable or disable the display of "High Dynamics Liquidity Line".
ShowLLd : A bool variable. You can enable or disable the display of "High Dynamics Liquidity Line".
🟣Recommendation
You can use the following code snippet to import Liquidity Finder into your code for time-saving.
//import Library
import TFlab/LiquidityFinderLibrary/1 as Liq
//input
SLLS = input.float(0.30 , 'Statics Liquidity Line Sensitivity', maxval = 0.4 ,minval = 0.0, step = 0.01) // Statics Liquidity Line Sensitivity
DLLS = input.float(1.00 , 'Dynamics Liquidity Line Sensitivity', maxval = 1.95 ,minval = 0.4, step = 0.01) // Dynamics Liquidity Line Sensitivity
SPP = input.int(8 , 'Statics Period Pivot') // Statics Period Pivot
DPP = input.int(3 , 'Dynamics Period Pivot') // Dynamics Period Pivot
ShowSHLL = input.bool(true , 'Show Statics High Liquidity Line')
ShowSLLL = input.bool(true , 'Show Statics Low Liquidity Line')
ShowDHLL = input.bool(true , 'Show Dynamics High Liquidity Line')
ShowDLLL = input.bool(true , 'Show Dynamics Low Liquidity Line')
//call function
Liq.LLF(SPP,DPP,SLLS,DLLS,ShowSHLL,ShowSLLL,ShowDHLL,ShowDLLL)
FVG Detector LibraryLibrary "FVG Detector Library"
🔵 Introduction
To save time and improve accuracy in your scripts for identifying Fair Value Gaps (FVGs), you can utilize this library. Apart from detecting and plotting FVGs, one of the most significant advantages of this script is the ability to filter FVGs, which you'll learn more about below. Additionally, the plotting of each FVG continues until either a new FVG occurs or the current FVG is mitigated.
🔵 Definition
Fair Value Gap (FVG) refers to a situation where three consecutive candlesticks do not overlap. Based on this definition, the minimum conditions for detecting a fair gap in the ascending scenario are that the minimum price of the last candlestick should be greater than the maximum price of the third candlestick, and in the descending scenario, the maximum price of the last candlestick should be smaller than the minimum price of the third candlestick.
If the filter is turned off, all FVGs that meet at least the minimum conditions are identified. This mode is simplistic and results in a high number of identified FVGs.
If the filter is turned on, you have four options to filter FVGs :
1. Very Aggressive : In addition to the initial condition, another condition is added. For ascending FVGs, the maximum price of the last candlestick should be greater than the maximum price of the middle candlestick. Similarly, for descending FVGs, the minimum price of the last candlestick should be smaller than the minimum price of the middle candlestick. In this mode, a very small number of FVGs are eliminated.
2. Aggressive : In addition to the conditions of the Very Aggressive mode, in this mode, the size of the middle candlestick should not be small. This mode eliminates more FVGs compared to the Very Aggressive mode.
3. Defensive : In addition to the conditions of the Very Aggressive mode, in this mode, the size of the middle candlestick should be relatively large, and most of it should consist of the body. Also, for identifying ascending FVGs, the second and third candlesticks must be positive, and for identifying descending FVGs, the second and third candlesticks must be negative. In this mode, a significant number of FVGs are eliminated, and the remaining FVGs have a decent quality.
4. Very Defensive : In addition to the conditions of the Defensive mode, the first and third candlesticks should not resemble very small-bodied doji candlesticks. In this mode, the majority of FVGs are filtered out, and the remaining ones are of higher quality.
By default, we recommend using the Defensive mode.
🔵 How to Use
🟣 Parameters
To utilize this library, you need to provide four input parameters to the function.
"FVGFilter" determines whether you wish to apply a filter on FVGs or not. The possible inputs for this parameter are "On" and "Off", provided as strings.
"FVGFilterType" determines the type of filter to be applied to the found FVGs. These filters include four modes: "Very Defensive", "Defensive", "Aggressive", and "Very Aggressive", respectively exhibiting decreasing sensitivity and indicating a higher number of Fair Value Gaps (FVG).
The parameter "ShowDeFVG" is a Boolean value defined as either "true" or "false". If this value is "true", FVGs are shown during the Bullish Trend; however, if it is "false", they are not displayed.
The parameter "ShowSuFVG" is a Boolean value defined as either "true" or "false". If this value is "true", FVGs are displayed during the Bearish Trend; however, if it is "false", they are not displayed.
FVGDetector(FVGFilter, FVGFilterType, ShowDeFVG, ShowSuFVG)
Parameters:
FVGFilter (string)
FVGFilterType (string)
ShowDeFVG (bool)
ShowSuFVG (bool)
🟣 Import Library
You can use the "FVG Detector" library in your script using the following expression:
import TFlab/FVGDetectorLibrary/1 as FVG
🟣 Input Parameters
The descriptions related to the input parameters were provided in the "Parameter" section. In this section, for your convenience, the code related to the inputs is also included, and you can copy and paste it into your script.
PFVGFilter = input.string('On', 'FVG Filter', )
PFVGFilterType = input.string('Defensive', 'FVG Filter Type', )
PShowDeFVG = input.bool(true, ' Show Demand FVG')
PShowSuFVG = input.bool(true, ' Show Supply FVG')
🟣 Call Function
You can copy the following code into your script to call the FVG function. This code is based on the naming conventions provided in the "Input Parameter" section, so if you want to use exactly this code, you should have similar parameter names or have copied the "Input Parameter" values.
FVG.FVGDetector(PFVGFilter, PFVGFilterType, PShowDeFVG, PShowSuFVG)
