Liquidity Sweep Scanner [TradingFinder]🔵 Introduction
Recognizing how liquidity develops and how price reacts at key structural levels is critical for spotting precise, low-risk trade entries. The Liquidity Sweep Scanner is an advanced tool built to track market activity in real time, pinpoint liquidity sweeps, define reaction zones, and identify confirmation candles across multiple instruments and timeframes.
Key Advantages :
Detects high-probability reversal points with precision.
Combines liquidity analysis, market structure, and candle confirmation.
Works seamlessly across multiple symbols and timeframes.
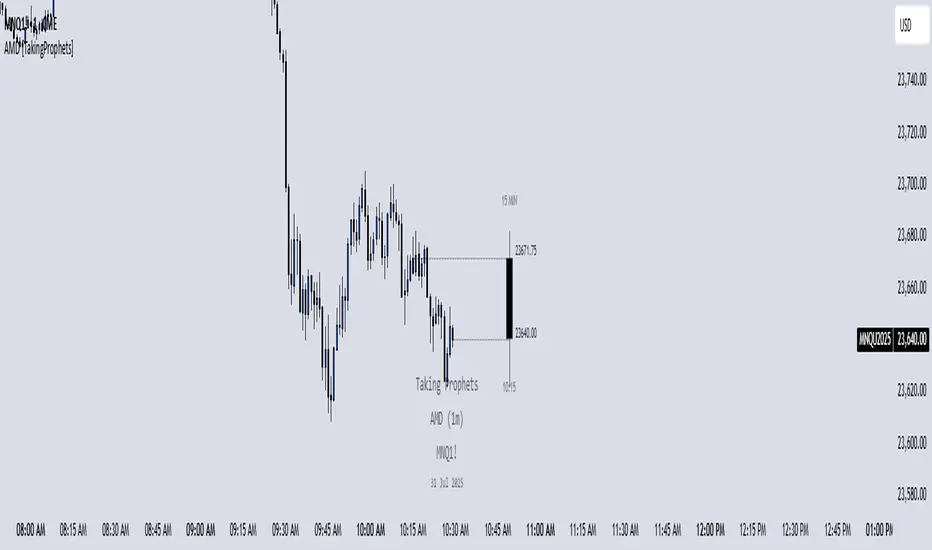
This screener can scan a broad watchlist or analyze every timeframe of a single asset to find optimal reversal zones. It starts by identifying a clear swing point either a swing high or swing low and marking a reaction zone between that point and the candle’s highest or lowest open/close value.
If price revisits the zone, performs a liquidity grab, and forms an indecision candle such as a doji or narrow-bodied bar that closes inside the zone, this may indicate rejection of the level and a failed breakout attempt. Based on the surrounding market context, the screener then flags a potential bullish or bearish reversal and generates the appropriate Long or Short signal.
By focusing on precise entry timing, institutional order flow alignment, and filtering out false breakouts, the Liquidity Sweep Scanner zeroes in on the market areas where liquidity engineering, reversal potential, and inefficiency overlap. This makes it an indispensable tool for price action traders who rely on clear, high-quality setups without the distraction of market noise.
🔵 How to Use
The Liquidity Sweep Scanner continuously evaluates market structure, issuing alerts when a potential reversal setup emerges. It merges liquidity behavior, swing point analysis, and candle confirmation within predefined reaction zones.
To illustrate, imagine price forms a swing high or low, then later returns to that level. If it sweeps the prior extreme and produces a qualifying candle inside the reaction zone, the tool signals a possible reversal.
🟣 Long Setup
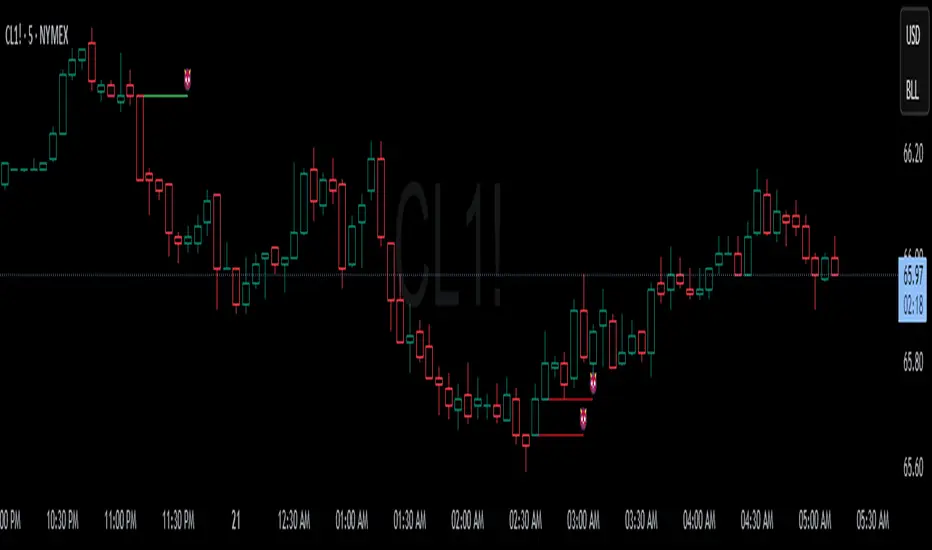
For a bullish scenario, the screener first spots a valid swing low a level often packed with sell-side liquidity. From there, it defines a reaction zone stretching from the swing low to the candle’s lowest open/close point.
If price retests this area with a wick dipping below the swing low but then closes back inside the zone, it signals absorption of selling pressure and rejection of further downside. The screener then awaits a confirmation candle commonly a doji or small-bodied bar closing inside the zone. Once these conditions align, a Long signal is logged and, if alerts are active, the trader receives a notification.
🟣 Short Setup
For bearish opportunities, the process begins by locating a valid swing high typically an area dense with buy-side liquidity. The reaction zone is drawn from the swing high to the candle’s highest open/close value.
When price retests this zone, sweeps above the swing high, and fails to close higher, it suggests a bull trap and waning upward momentum. The screener then requires a confirmation candle often a doji or rejection bar that closes back within the zone before confirming a Short signal.
These bearish setups help traders pinpoint likely institutional sell zones, offering a clear view of where price may reverse following a liquidity event.
🔵 Settings
🟣 Logical settings
Liquidity Swing period : You can set the swing detection period.
Market Structure Period :You can set the Pivot Period to determine the detection direction.
Max Swing Back Method : It is in two modes "All" and "Custom". If it is in "All" mode, it will check all swings, and if it is in "Custom" mode, it will check the swings to the extent you determine.
Max Swing Back : You can set the number of swings that will go back for checking.
Maximum Distance Between Swing and Signal : The maximum number of candles allowed between the swing point and the potential signal. The default value is 50, ensuring that only recent and relevant price reactions are considered valid.
🟣 Display Settings
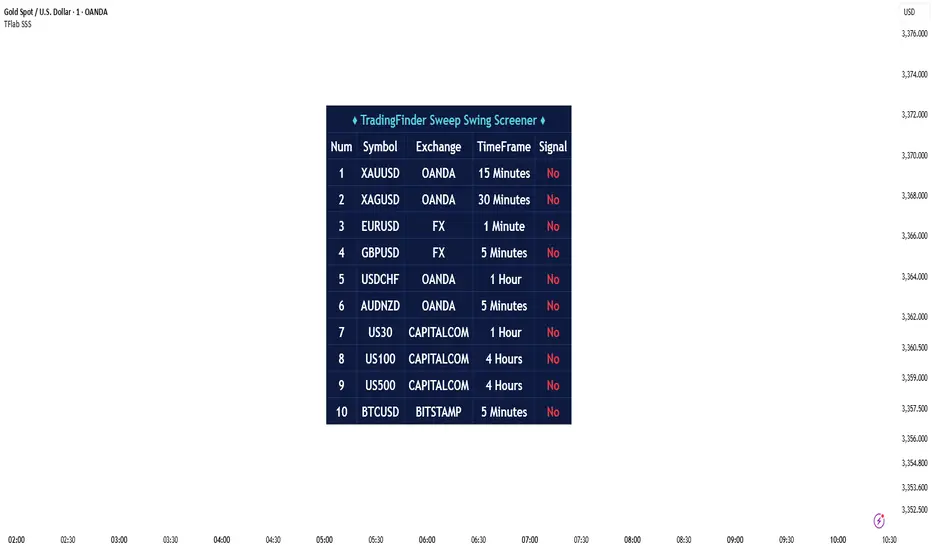
Table on Chart : Allows users to choose the position of the signal dashboard either directly on the chart or below it, depending on their layout preference.
Number of Symbols : Enables users to control how many symbols are displayed in the screener table, from 10 to 20, adjustable in increments of 2 symbols for flexible screening depth.
Table Mode : This setting offers two layout styles for the signal table :
Basic : Mode displays symbols in a single column, using more vertical space.
Extended : Mode arranges symbols in pairs side-by-side, optimizing screen space with a more compact view.
Table Size : Lets you adjust the table’s visual size with options such as: auto, tiny, small, normal, large, huge.
Table Position : Sets the screen location of the table. Choose from 9 possible positions, combining vertical (top, middle, bottom) and horizontal (left, center, right) alignments.
🟣 Symbol Settings
Each of the 10 symbol slots comes with a full set of customizable parameters :
Symbol : Define or select the asset (e.g., XAUUSD, BTCUSD, EURUSD, etc.).
Timeframe : Set your desired timeframe for each symbol (e.g., 15, 60, 240, 1D).
🟣 Alert Settings
Alert : Enables alerts for LSS.
Message Frequency : Determines the frequency of alerts. Options include 'All' (every function call), 'Once Per Bar' (first call within the bar), and 'Once Per Bar Close' (final script execution of the real-time bar). Default is 'Once per Bar'.
Show Alert Time by Time Zone : Configures the time zone for alert messages. Default is 'UTC'.
🔵 Conclusion
The Liquidity Sweep Scanner equips traders with a precise, structured method for spotting high-probability reversals by merging liquidity sweeps, reaction zone mapping, and candle confirmation.
It not only filters out market noise but also highlights price areas where inefficiency and reversal potential align. Beyond identifying clean entry points, the tool includes a market direction detection feature allowing traders to quickly determine the prevailing trend and align their trades accordingly.
With adjustable settings such as the Pivot Period for fine-tuning detection direction, it adapts to various trading styles and timeframes, making it a powerful and versatile addition to any trader’s strategy.
סקריפט בתשלום