Turn around Tuesday on Steroids Strategy█ STRATEGY DESCRIPTION
The "Turn around Tuesday on Steroids Strategy" is a mean-reversion strategy designed to identify potential price reversals at the start of the trading week. It enters a long position when specific conditions are met and exits when the price shows strength by exceeding the previous bar's high. This strategy is optimized for ETFs, stocks, and other instruments on the daily timeframe.
█ WHAT IS THE STARTING DAY?
The Starting Day determines the first day of the trading week for the strategy. It can be set to either Sunday or Monday, depending on the instrument being traded. For ETFs and stocks, Monday is recommended. For other instruments, Sunday is recommended.
█ SIGNAL GENERATION
1. LONG ENTRY
A Buy Signal is triggered when:
The current day is the first day of the trading week (either Sunday or Monday, depending on the Starting Day setting).
The close price is lower than the previous day's close (`close < close `).
The previous day's close is also lower than the close two days ago (`close < close `).
The signal occurs within the specified time window (between `Start Time` and `End Time`).
If the MA Filter is enabled, the close price must also be above the 200-period Simple Moving Average (SMA).
2. EXIT CONDITION
A Sell Signal is generated when the current closing price exceeds the high of the previous bar (`close > high `). This indicates that the price has shown strength, potentially confirming the reversal and prompting the strategy to exit the position.
█ ADDITIONAL SETTINGS
Starting Day: Determines the first day of the trading week. Options are Sunday or Monday. Default is Sunday.
Use MA Filter: Enables or disables the 200-period SMA filter for long entries. Default is disabled.
Start Time and End Time: The time window during which the strategy is allowed to execute trades.
█ PERFORMANCE OVERVIEW
This strategy is designed for markets with frequent weekly reversals.
It performs best in volatile conditions where price movements are significant at the start of the trading week.
Backtesting results should be analysed to optimize the Starting Day and MA Filter settings for specific instruments.
מדדים

Consecutive Bearish Candle Strategy█ STRATEGY DESCRIPTION
The "Consecutive Bearish Candle Strategy" is a momentum-based strategy designed to identify potential reversals after a sustained bearish move. It enters a long position when a specific number of consecutive bearish candles occur and exits when the price shows strength by exceeding the previous bar's high. This strategy is optimized for use on various timeframes and instruments.
█ SIGNAL GENERATION
1. LONG ENTRY
A Buy Signal is triggered when:
The close price has been lower than the previous close for at least `Lookback` consecutive bars. This indicates a sustained bearish move, suggesting a potential reversal.
The signal occurs within the specified time window (between `Start Time` and `End Time`).
2. EXIT CONDITION
A Sell Signal is generated when the current closing price exceeds the high of the previous bar (`close > high `). This indicates that the price has shown strength, potentially confirming the reversal and prompting the strategy to exit the position.
█ ADDITIONAL SETTINGS
Lookback: The number of consecutive bearish bars required to trigger a Buy Signal. Default is 3.
Start Time and End Time: The time window during which the strategy is allowed to execute trades.
█ PERFORMANCE OVERVIEW
This strategy is designed for markets with frequent momentum shifts.
It performs best in volatile conditions where price movements are significant.
Backtesting results should be analysed to optimize the `Lookback` parameter for specific instruments.

4 Bar Momentum Reversal strategy█ STRATEGY DESCRIPTION
The "4 Bar Momentum Reversal Strategy" is a mean-reversion strategy designed to identify price reversals following a sustained downward move. It enters a long position when a reversal condition is met and exits when the price shows strength by exceeding the previous bar's high. This strategy is optimized for indices and stocks on the daily timeframe.
█ WHAT IS THE REFERENCE CLOSE?
The Reference Close is the closing price from X bars ago, where X is determined by the Lookback period. Think of it as a moving benchmark that helps the strategy assess whether prices are trending upwards or downwards relative to past performance. For example, if the Lookback is set to 4, the Reference Close is the closing price 4 bars ago (`close `).
█ SIGNAL GENERATION
1. LONG ENTRY
A Buy Signal is triggered when:
The close price has been lower than the Reference Close for at least `Buy Threshold` consecutive bars. This indicates a sustained downward move, suggesting a potential reversal.
The signal occurs within the specified time window (between `Start Time` and `End Time`).
2. EXIT CONDITION
A Sell Signal is generated when the current closing price exceeds the high of the previous bar (`close > high `). This indicates that the price has shown strength, potentially confirming the reversal and prompting the strategy to exit the position.
█ ADDITIONAL SETTINGS
Buy Threshold: The number of consecutive bearish bars needed to trigger a Buy Signal. Default is 4.
Lookback: The number of bars ago used to calculate the Reference Close. Default is 4.
Start Time and End Time: The time window during which the strategy is allowed to execute trades.
█ PERFORMANCE OVERVIEW
This strategy is designed for trending markets with frequent reversals.
It performs best in volatile conditions where price movements are significant.
Backtesting results should be analysed to optimize the Buy Threshold and Lookback parameters for specific instruments.

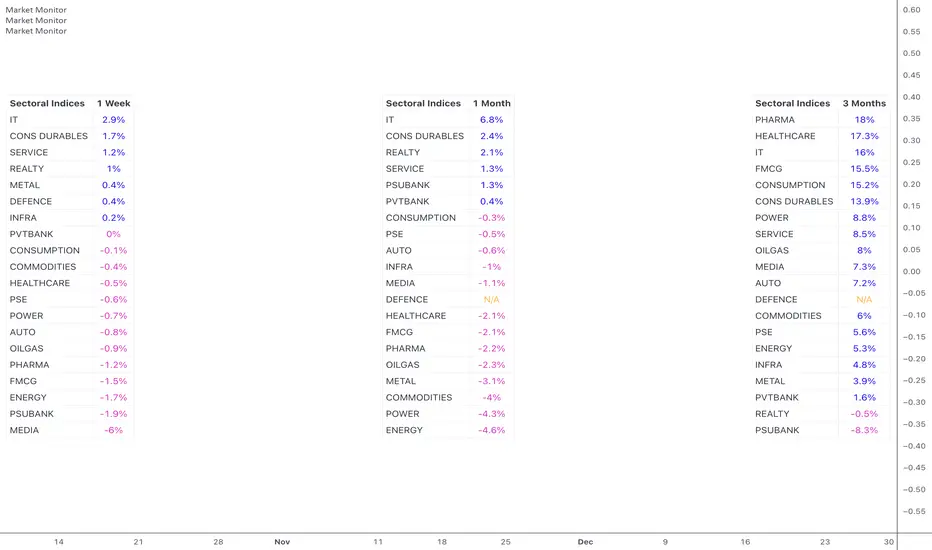
Market MonitorOverview
The Market Monitor Indicator provides a customisable view of dynamic percentage changes across selected indices or sectors, calculated by comparing current and previous closing prices over the chosen timeframe.
Key Features
Choose up to 20 predefined indices or your own selected indices/stocks.
Use checkboxes to show or hide individual entries.
Monitor returns over daily, weekly, monthly, quarterly, half-yearly, or yearly timeframes
Sort by returns (descending) to quickly identify top-performing indices or alphabetically for an organised and systematic review.
Customisation
Switch between Light Mode (Blue or Green themes) and Dark Mode for visual clarity.
Adjust the table’s size, position, and location.
Customise the table title to your own choice e.g. Sectoral, Broad, Portfolio etc.
Use Cases
Use multiple instances of the script with varying timeframes to study sectoral rotation and trends.
Customise the stocks to see your portfolio returns for the day or over the past week, or longer.
Market Anomaly Detector (MAD)Market Anomaly Detector (MAD) Indicator - Detailed Description:
The Market Anomaly Detector (MAD) Indicator is a unique tool designed to identify potential market anomalies by combining several price action-based and momentum indicators. This indicator is especially useful for traders who seek to identify significant market shifts and anomalies before they become visible in conventional technical indicators.
Key Features of the MAD Indicator:
1. Z-Score Threshold for Anomaly Detection:
• The Z-Score measures how far a current price is from its average over a defined period, normalized by standard deviation. This allows the MAD indicator to detect outliers or anomalies in price movements.
• By adjusting the Z-Score Threshold, traders can tune the sensitivity of the indicator to capture only the most significant price deviations, filtering out noise and reducing false signals.
2. Volume and Liquidity Filter:
• Volume is a key indicator of market participation and sentiment. The MAD Indicator uses a volume multiplier to assess when price movements are supported by sufficient trading volume.
• A volume spike is identified when the current volume exceeds the average volume by a certain multiplier. This ensures that only high-confidence signals are generated, particularly useful for spotting trend reversals and breakout opportunities.
3. Signal Cooldown Period:
• To prevent overfitting and reduce false signals, a signal cooldown period is implemented. Once a buy or sell signal is triggered, the indicator waits for a specified number of bars (e.g., 5) before triggering another signal, even if the price action meets the criteria for a new signal. This helps maintain a cleaner trading environment and avoids confusion when the market is volatile.
4. Upper and Lower Bands for Trend Confirmation:
• The MAD Indicator uses bands based on the mean price and standard deviation, similar to Bollinger Bands. These upper and lower bands help to define the expected price range for a given period, indicating overbought or oversold conditions.
• The combination of Z-Score, volume, and band analysis helps pinpoint when the price breaks out of expected ranges, providing early warning signs for potential market shifts.
5. Trend Confirmation from Higher Timeframes:
• The MAD Indicator includes a multi-timeframe approach to trend confirmation, using the 50-period EMA on a higher timeframe (e.g., 1-hour chart). This ensures that signals are aligned with the overall market trend, enhancing the reliability of buy and sell signals.
How It Works:
• The MAD Indicator continuously monitors price action, volume, and statistical anomalies, using the Z-Score to determine when the price is significantly deviating from its historical average.
• When the price breaks above the upper band and a bullish anomaly is detected, a buy signal is generated. (Green Background)
• Similarly, when the price breaks below the lower band and a bearish anomaly is detected, a sell signal is triggered. (Red Background
• By filtering signals based on volume and using the cooldown period, the MAD Indicator ensures that only high-quality trades are signaled.
How to Use the MAD Indicator:
• Buy Signal: Occurs when the price breaks above the upper band and there is a significant deviation from the mean (bullish anomaly).
• Sell Signal: Occurs when the price breaks below the lower band and there is a significant deviation from the mean (bearish anomaly).
• Volume Confirmation: Ensure that the buy/sell signals are supported by a volume spike, indicating strong market participation.
• Signal Cooldown Period: After a signal is triggered, the indicator waits for the cooldown period to avoid triggering multiple signals in quick succession.
Why It’s Worth Paying For:
The MAD Indicator combines advanced statistical analysis (Z-Score), price action, and volume analysis to identify market anomalies and breakouts before they are visible on standard indicators. By leveraging the power of mean reversion and statistical anomalies, this tool provides traders with high-confidence signals that can lead to profitable trades, especially in volatile markets. The integration of a multi-timeframe trend filter ensures that signals are aligned with the overall market trend, reducing the likelihood of false breakouts.
This indicator is ideal for trend-following traders looking for high-probability entries and mean-reversion traders aiming to capture price deviations. The signal cooldown period and volume filter provide an additional layer of precision, ensuring that you only act on the strongest market signals.

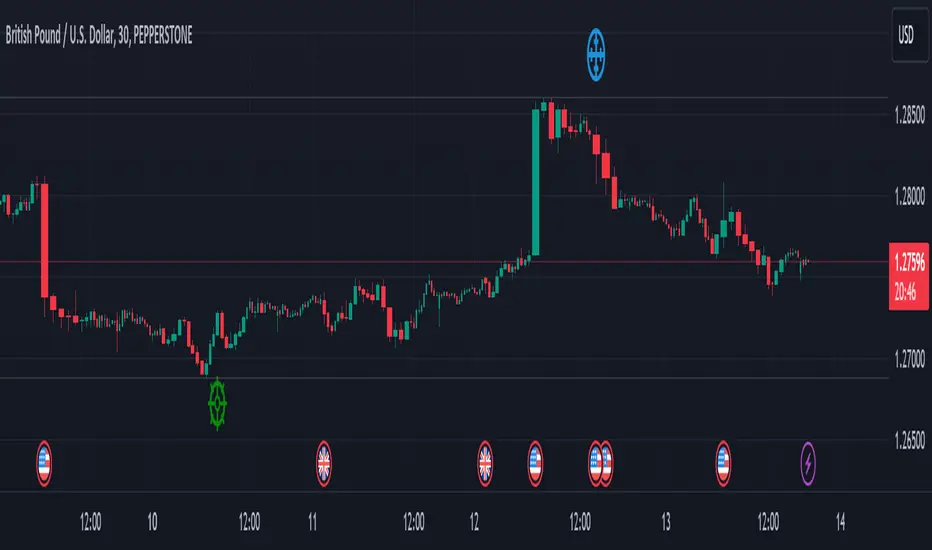
Swing Sniper by Republic of TradersSwing Sniper: A Comprehensive Market Reversal Indicator
Description:
Swing Sniper, developed by Republic of Traders, is a sophisticated trading indicator designed for traders who require precise market reversal signals. It performs optimally across all trading instruments and timeframes, offering both reliability and precision.
How It Works:
Swing Sniper employs a complex signal generation mechanism that activates only when six distinct conditions align within a specific timeframe. This includes:
A modified Commodity Channel Index (CCI) that helps identify short-term price fluctuations.
A Relative Momentum Index (RMI) utilized for recognizing long-term market trends.
A Supertrend indicator serves as a dynamic trend filter.
Several custom parameters that enhance signal reliability.
These components work synergistically to ensure that each trading signal is robust and well-founded. The indicator specializes in capturing significant market reversals by requiring a confirmation of trend reversal through a break and close above or below a previous supply/demand zone.
Usage Instructions:
Upon a valid signal, Swing Sniper advises traders that a potential market reversal has occurred and an entry may be considered in the direction of the new trend. Traders are recommended to set alerts for "once per candle close," allowing them to monitor multiple charts and timeframes simultaneously. Proper risk management is encouraged by placing stop losses just below or above the previous swing low or high and the signal candle's low or high. Take profits should similarly be set to capitalize on potential swings.
Why Choose Swing Sniper:
Swing Sniper is designed not only as a tool for generating entries but as a strategic component of your trading methodology. It brings a clear, analytical approach to navigating the markets, supported by detailed and logical indicator collaboration. This ensures users understand the underlying mechanics and can apply the tool effectively within their trading strategy.
Commitment to Originality and Utility:
Swing Sniper is a unique creation, adhering to TradingView’s standards by offering actionable insights that are distinct from other indicators available on the platform. It is meticulously crafted, featuring an original combination of technical analysis tools tailored to enhance market reversal detection.
Disclaimer:
Past performance is not indicative of future results. Always exercise due diligence and consider market conditions when trading.
Visualization Aid:
The accompanying chart visualization helps users identify signal examples, marked with a red triangle for market reversals short and a green triangle for market reversals long.
Embrace the strategic depth and precision of Swing Sniper and enhance your trading confidence and accuracy in financial markets.
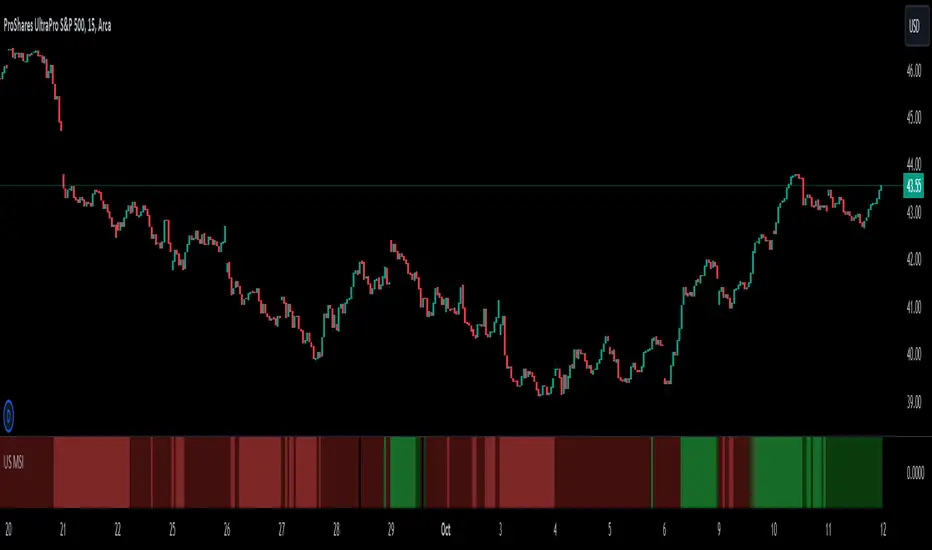
US Market Strength IndexIntro:
It is quite a task to track multiple Indices and market internals to decide which way markets are going, especially when you are in a Trade. You may also get conflicting signals making it harder to confidently decide on your trade bias.
US Market Strength Index a.k.a. US MSI indicator aims to simplify decision-making by coloring the lower panel Green when a majority of market participants are bullish and Red when they are bearish. The code analyses the direction and strength of various US indices & market internal futures contracts to decide the color. The shade of color also changes from Dark to Bright when the momentum is relatively strong. A weighted score is assigned to individual contracts and the color (& shade) are selected based on average score in real-time, for changes in direction and momentum.
A Futures contract provides a proxy and generates price & volume data to analyze the direction and strength. Also, they are traded by sophisticated market participants for about 23 hours a day!
Trading with the general market sentiment in your favor can potentially improve a trade's edge. For example, if various market indices (DOW JONES, S&P 500, NASDAQ, etc.) are positive; bullish, or LONG trades might work out in individual stocks. This may occur due to the following reasons:
Seeing prices rise, Sellers may choose to Sell at Higher prices
Buyers might be attracted to buy into stocks, as the prices are trending higher
SHORT sellers might get cautious of rising prices and may not Open SHORT positions until the current bullish sentiment dies off
Existing SHORT sellers may close their positions due to margin squeeze, possibily fueling more buying
The same logic applies when the market indices are in the negative territory, SHORT trades may have a higher probability of working out.
Features:
The bright Green color in the lower panel indicates a strong bullish market strength
The dark Green color in the lower panel indicates bullish market strength, but a relatively weaker
The bright Red color in the lower panel indicates a strong bearish market strength
The dark Red color in the lower panel indicates bearish market strength, but a relatively weaker
Basic Set-Up:
Add the Indicator to the chart
You can change the default colors for Market Bearish, Market Bullish, Market Bearish weak, and Market Bullish weak
Important Notes:
You should analyze the stock’s technical data and use prudent risk management for every trade. Trade entries and exits should always be based on the symbol you are trading.
Use the US Market Strength Index as one of the factors to decide your trade bias and filter symbols that support your analysis.
Just because Indices and Market Internals point in a certain direction, it does not guaranteed that a stock could behave the same way.
Also, since this script uses futures contracts, you would need real-time futures data subscription for real-time analysis. At the minimum, you need CME/ CBOE exchange data.
This tool is suited for US Regular Trading Session, but since the US MSI is using futures contracts, the tool tracks pre- and post-market sentiment as well.
Sessioned EMA - Frozen EMA in post market hoursWhy I develop this indicator?
In future indices, post market data with little volume distort the moving average seriously. This indicator is to eliminate the distortion of data during low volume post market hours.
How to use?
There is a time session setting in the indicator, you can set the cash hour time, moving average outside the session will be frozen.
What this indicator gives you
This indicator give you a more make sense ema pattern, the ema lines are more respected by the prices when you set the session properly.
Setup
1. Session setting
In US indices, such as NQ, ES etc, when there was data release at 0830 hr, huge volume transaction order appears, that makes the 0830 price data important that should be included in your ema trend line calculating. If that is the case, I will set the session begin from 0830, otherwise, I start the session at 0930. Golden rule : Price with huge volume counts.
2. Time zone
The coding is decided for GMT+8 time zone, you may amend the code to fit your timezone.

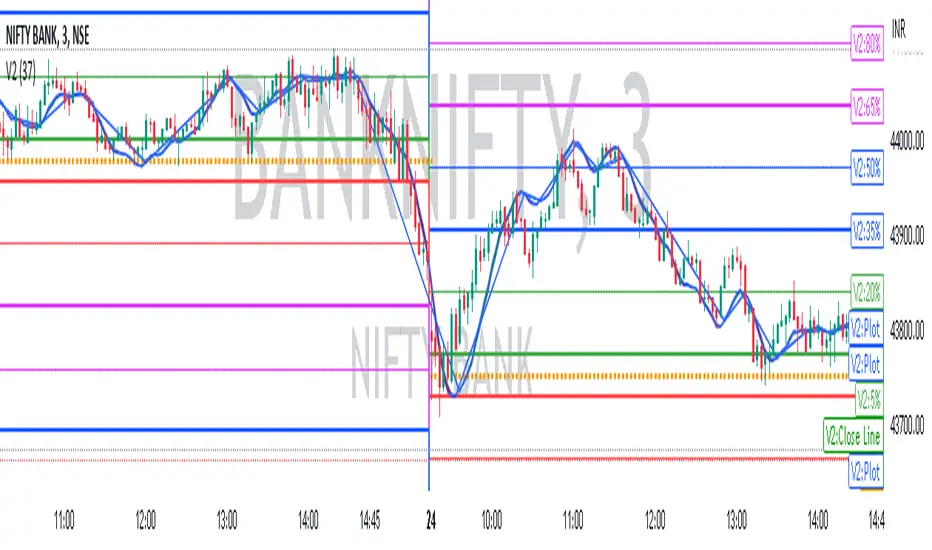
V2 Indicator: A Unique IndicatorV2 Indicator: A Unique Indicator Combining Percentage Level and 5MWAP
V2 Indicator is an innovative trading tool developed by Najoomi Ji. It incorporates a combination of percentage levels and the 5MWAP (5 Moving Weighted Average Price) to provide valuable insights into market trends. The concept of percentage chart trading was inspired by the late Gurbachan Singh, the father of Najoomi Ji.
The primary rule of the V2 Indicator involves plotting lines on the chart based on the daily market open level and the percentage levels. At the start, a line is drawn 5% above and below the market open level on both sides. The indicator identifies the direction in which the market breaks out and prompts traders to enter the market accordingly.
To manage risk effectively, trailing stop-loss levels are employed in the V2 Indicator. These levels are set at significant percentage levels, such as 5%, 35%, 65%, and 95%. The market tends to respect these levels, making them crucial points for adjusting stop-loss orders.
Traders utilizing the V2 Indicator gain an advantage by closely monitoring the interplay between percentage levels and the 5MWAP. This indicator allows them to make informed decisions about market entry points, as well as effectively manage their trades by utilizing trailing stop-loss orders.
By combining the expertise of Najoomi Ji and the inspiration from Gurbachan Singh, the V2 Indicator offers a unique approach to trading, providing traders with a comprehensive tool for identifying market trends and managing risk effectively.
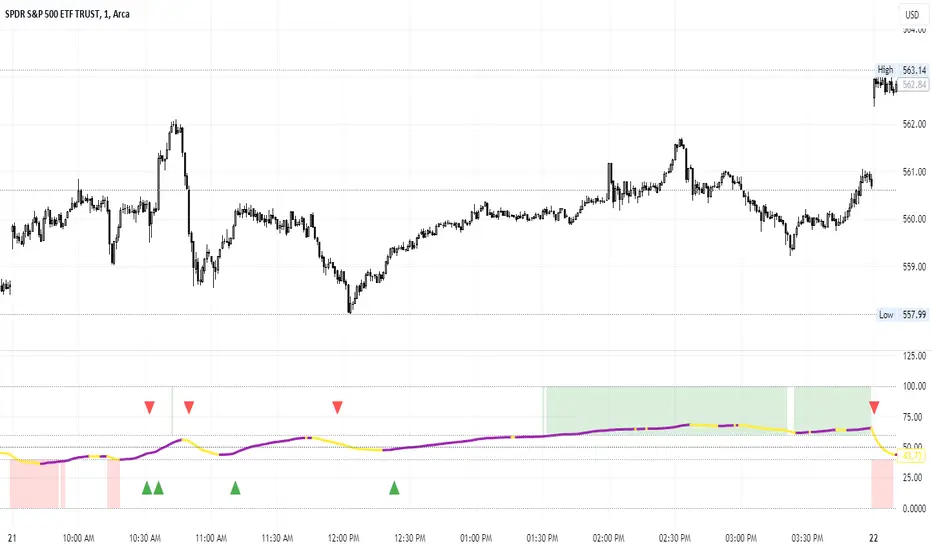
Percent of U.S. Stocks Above VWAPThis indicator plots a line reflecting the percentage of all U.S. stocks above or below their VWAP for the given candle. Horizontal lines have been placed at 40% (oversold), 50% (mid-line), and 60% (overbought). I recommend using this indicator as a market breadth indicator when trading individual stocks. In my experience, this indicator is best utilized while trading the major indices (SPX, SPY, QQQ, IWM) or their futures (ES, NQ, RTY) in the following manner:
- When the line crosses 50%, a green or red triangle is plotted indicating the majority of market momentum has turned bullish or bearish based on price positioning vs. VWAP. Look for longs when the line is rising (green) or above 50%, or shorts when the line is falling (red) or below 50%.
- When the line is below 40%, indicator shows red shading; I would not be long anything during this period. When the line exits this level, I begin looking for long entries. This line is adjustable in the indicator settings if you prefer to use a tighter or looser oversold level.
- When the line is above 60%, indicator shows green shading; I would not be short anything during this period. When the line exits this level, I begin looking for short entries. This line is adjustable in the indicator settings if you prefer to use a tighter or looser overbought level.
This indicator uses the TradingView ticker “PCTABOVEVWAP.US”, thus it only updates during NY market hours. If trading futures, I recommend applying VWAP to your chart and using that as the level to trade against in a similar manner, along with your personal price action analysis and other indicators you find useful.
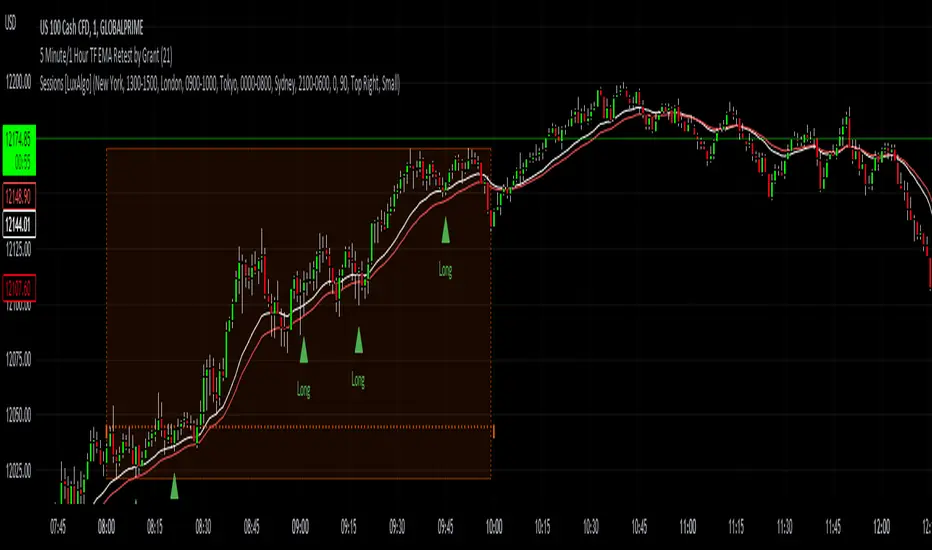
5 Minute TF 200 EMA Retest by Grantwww.tradingview.com
This indicator is a simple script meant to find retests on the 200 period moving average. It's current state is optimized for the 5 minute timeframe.
This works in all markets and all timeframes as long as you adjust certain rules for higher timeframes.
It's strengths and weaknesses
- Good at trend continuation in strong markets
- Bad in ranging markets (not surprising)
How does it work?
- It first identifies an overall trend by using the 200 ema.
- For long positions, it waits for price to close below the 200 ema, and then shortly closing back above the ema. For short positions its the opposite.
- For lower timeframes there are some other factors that help filter out bad signals that include:
- Makes sure that volume is increasing.
- Makes sure that volume is higher than average volume.
- For higher timeframes, the more specific factors aren't required.
How to use this indicator:
- Green triangles mean long positions
- Red triangles mean short positions
- Always trade with stoplosses and never risk too much of your account, please practice proper risk managment.
DISCLAIMER: Trading is inherently dangerous and carries lot's of risk. What you decide to do with my script has nothing to do with me. I am not responsible for any financial gains or losses made using this script. It is important to recognize other factors in the market to make better decisions.
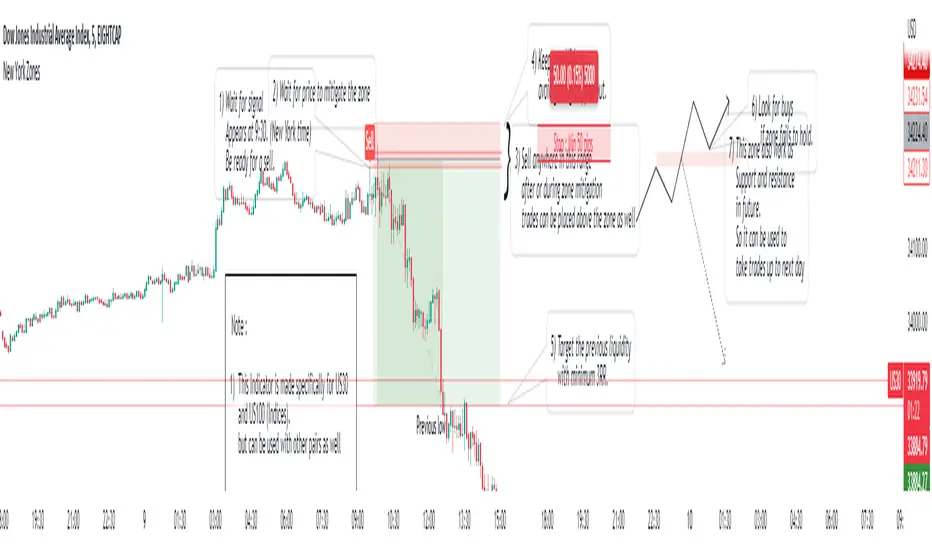
New York ZonesHello traders, here is a indicator which is based on a strategy I found on a forum. I hope you will find it useful.
Rules to Follow:
1) Wait for signal . Signal appears at 9:30. (New York time)
2) Wait for price to mitigate the zone
3) Sell anywhere in this range after or during zone mitigation.
4) Keep stop Wide to avoid getting stopped out.
5) Target the previous liquidity with minimum 3RR.
6) Look for opposite trade if zone fails to hold , with proper analysis
Note :
1) This Indicator is made specifically for US30 and US100 (Indices) but can be used with other pairs as well (need back testing)
2) I would not recommend to place the trade right away as soon as signal appears , wait for liquidity to be taken out and place a trade after confirmation.
3) Trades can be placed below the zone as well but the probability of entry may decrease ,while increasing the accuracy.
4) Use timeframe <= 5 min to take entries.
Trade scenarios
Perfect trade :
Price failed to hold, you got stopped out and market changes direction :
Price respect zone in future:
Encounters Pro - Free versionThe Encounters Pro indicator is a general-purpose tool to improve the capacity of forecasting future market price moves.
This free version has one engine active and a second engine partially active between 15h and 17h UTC.
This indicator does not provide buy, sell or hold signals ; instead, it helps to determine the future direction of prices .
How to read it:
The engines must be tracked from bottom to the top. Red color is bearish or descending and green color is bullish or ascending. The upper engine (line) is the one that represents the immediate price direction, take it into consideration.
When two or more consecutive engines change, sequentially, from bottom to top, and they have, after this process, the same color, it may indicate that price is about to move in that direction. However, that is not enough, the trend must be already present or you must have a sound technical reason to validate the idea provided by the Encounters Pro indicator.
There are four examples on the image above.
Case 1 is a valid signal because the three upper engines changed from red to green, from bottom to top: firstly the third one, then the second one and, finally, the first one on top.
Case 2 would not be a valid singnal considering that the third engine was red before the first one turned green. However, it was a valid bullish signal because the fourth level was green before the second and the first.
Case 3 is not a valid signal because the first engine is green and the rest are red.
Case 4 is not a valid signal because the sequence goes from top to bottom and it is mandatory that the sequence goes from the bottom or lower engines to the ones on top.
Two engines switching color at the same time are valid. This is the only exception to the bottom to top rule.
The engines
The first one (the top one) leads the rest from the temporal perspective, but it is the weaker one. The sencond and rest of lines, to the bottom, reflect an increasing directional strength, and may represent deeper effects on market prices. You will have to carefully examine the chart, with historical data, and observe how price reacts as you spot different patterns among the engines of the Encounter Pro indicator.
On the main image above, the green arrows show a clear bullish tendency upon London Markets open time, for instance.
The slope and the engine position
The lines should be considered in terms of their slope and position. An ascending line is a bullish strength signal, even if a red color temporarily appears, specially if above the middle level of the engine. When the lines are on top, it means the engine is gauging the maximum possible bullish pressure, but if the line were falling at the same time, above the middle level, the bullish implication of that engine would be significantly lower.
Conversely, when lines are either stalling or close to the bottom, it is a signal of bearish increasing power.

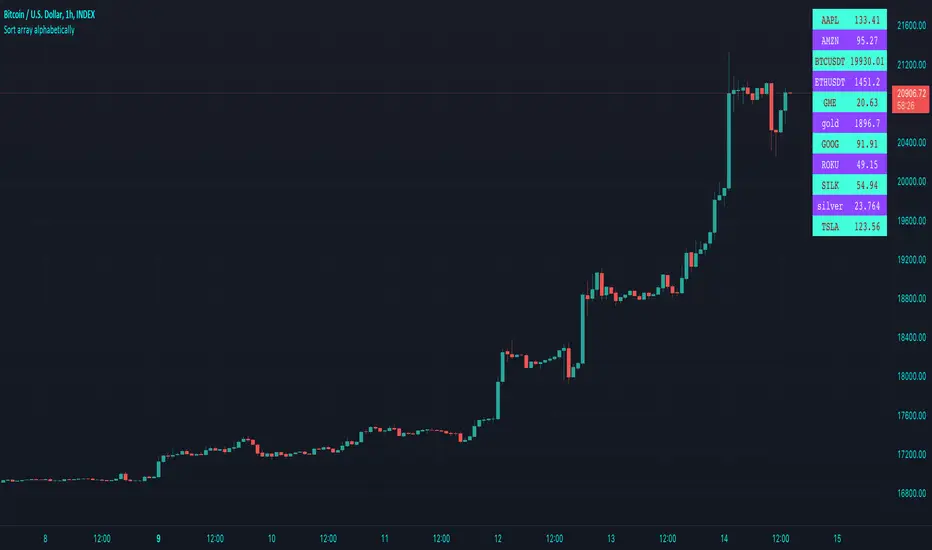
Sort array alphabetically - educational🔶 OVERVIEW
• This educational script will sort an array of tickers alphabetically and place these values in an table , together with the according current price value next to each ticker .
🔶 SORT ALPHABETICALLY
🔹 I. We make a User Defined Type (UDT) obj , with:
· ticker - the string name of the ticker
· price - the current price (close)
• From this UDT we make an object obj.new() for each ticker
🔹 II. 2 array's are made:
• array of objects aObj , containing obj type obj.new() for every ticker
• array of strings sort , the ticker part of each object obj.new()
🔹 III. Now we make an object of each ticker with the createObject(sym ) function
object_1 = createObject("TICKER")
• the object object_1 consists off:
· ticker -> "TICKER"
· price -> current Daily close through request.security("TICKER") (non-repainting)
• object_1 will be added to the aObj array
• "TICKER" ( string ticker part of object ) will be added to the sort array
🔹 IV. The latter array is sorted alphabetically by using array.sort_indices()
EXAMPLE
originalArray = array.from("B", "A", "C")
indicesArray = // sorted indices
array.get(originalArray, 1) -> "A"
array.get(originalArray, 0) -> "B"
array.get(originalArray, 2) -> "C"
IMPORTANT
Alphabetically sorting is case sensitive , just like Java compareTo(String anotherString) !
• The comparison is based on the Unicode value of each character in the string, the lowest "Dec" values are sorted first in line.
• Comparing the "Dec" values at unicodelookup explains why default CAPITAL lettres will be sorted first,
• Default you would get this (A= 65, B= 66, a= 97, b= 98)
Aa
Ba
ab
bb
• Adding str.lower(string) in the toLowerCase() function will result to the following:
Aa
ab
Ba
bb
• (A= 65 is transformed to a= 97, ...)
• As a side note, should you write "AMZN" as "ÀMZN" this would be placed at the end, even after transforming to lower case the "Dec" values are higher (À= 192, à= 224).
• You can toggle "To Lower Case" to verify.
🔹 V. Values are placed in a table , using these sorted indices.
• With the usage of UDTs and objects , the current price has the same index in the aObj as their ticker ,
giving the advantage it is fairly easy to place every value correctly next to each other.
• The same can be done by make 2 separate arrays , 1 for the current price , the other for "TICKER" .
🔶 OTHER TECHNIQUES USED
• Alternative technique for adding comment
Instead of
// this is a comment
You can also do this:
_=" this is a comment "
• Alternate colour
· During a loop , alternate colour when i is even or odd , using the modulo operation (%) .
· This is the remainder when dividing.
EXAMPLE
· 3 % 2 = 1 -> 3 / 2 -> 1 * 2, 1 left (remainder)
· 4 % 2 = 0 -> 4 / 2 -> 2 * 2, 0 left (remainder)
· 5 % 2 = 1 -> 5 / 2 -> 2 * 2, 1 left (remainder)
for i = 0 to 10
even = i % 2 == 0
col = even ? thisColor : otherColor
• Adjust colour in script by using colour picker
Cheers!
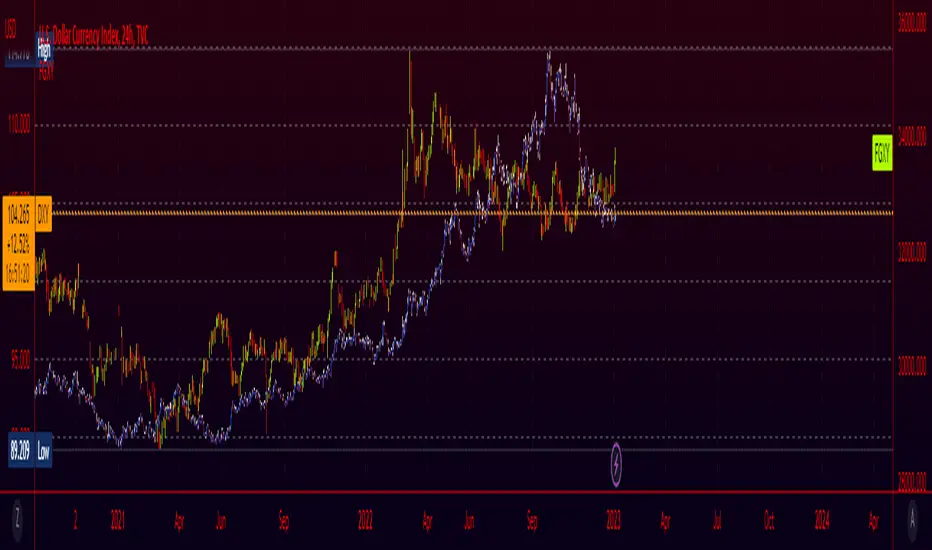
Fiat Currency and Gold Indices (FGXY) CandlesA modification of my previous indicator "Crypto Index (DXY) Candles". The idea was to create a similar currency basket to the standard DXY, but from the perspective of other currencies. Still using the standard DXY weights, this indicator allows you to create a tailored index for other currencies, provided that a currency pair exists for each of the 6 components. This means that even currencies that aren't included should work in theory; just find the 3 character currency prefix used by tradingview and give it a shot! This indicator is useful for gauging how well countries/currencies are holding up and when paired with the standard DXY may help see potential inflection points. For use on longer time frames (~1h-~3d) as some of the data being pulled seems to have issues on lower timeframes.
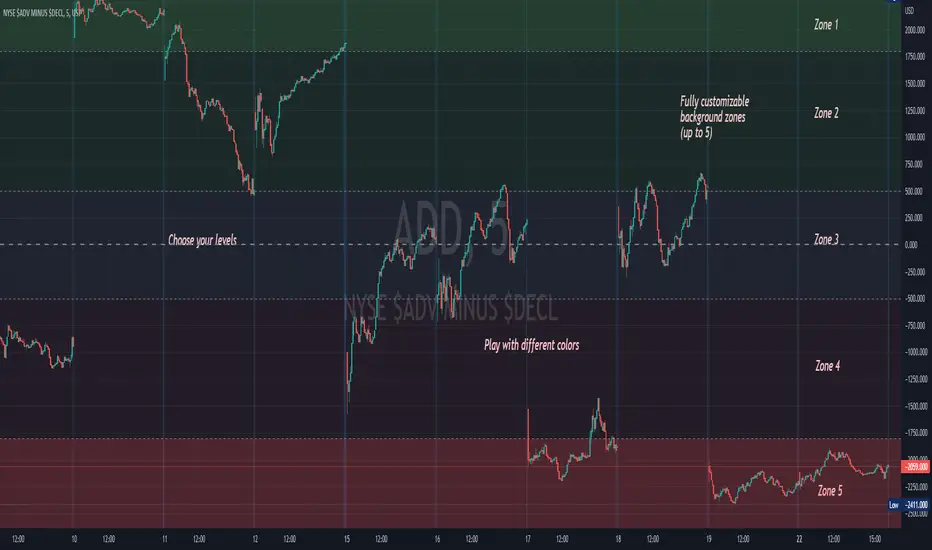
Background ZonesThis script provides up to 5 zones to apply background colors. This is especially useful for applying to indices such as USI:TICK , USI:ADD , and USI:VOLD , where certain levels provides significant meaning to market sentiment and directions. This script will give you the visual cue to help with your trading.
All levels and colors are fully customizable.
Enjoy~!!
Example:
Deluxo Dow Kill ZonesCAPITALCOM:US30
Edit* under settings remove the plot line its not needed.
Deluxo Capital
Dow Kill Zone Indicator
PLEASE READ ALL
About: This will help you find large moves that happen often on US30. This will work for gj and probably other indices but I've designed this to work for US30 day trades.
If I see a trade I will scalp within the blue zone, besides that the best trades are anywhere outside the colored zones and you will generally find good entry's/exits just as those zones end.
So you're just scalping between these zones. Stay with me tho.
How to use: You can trade the blue session or wait it out because that's a high risk area but with time you will enjoy trading it as you get to know how price reacts or how the order blocks/order flow looks.
This works for: Day trades mainly but can be for swing trades.
Time fame USE: 1-15min I like 5-15m
Red Zone = This zone I like to enter shorts or longs all the way to the blue zone depending how price action reacted to the Asian high or low. Was the Asian high taken out?/was the Asian low taken out? Trades are taken around when this zone ends down to the blue zone.
Blue Zone = Modified New York Session hours High vol window good scalps or enter trades after the blue zone to the next zone the
Gray zone = 30 min Pre-Spread Warning. This zone is always the best time to exit your trades its just grays out 30 min before spreads open up. Some of the best trades are after the blue zone to this gray zone.
EXTRA* I also use this indicator and I recommend you to use this aswell these two together work great I use them daily.
AsiaSessionHighLowMidLines by marekmajer
This is my personal system for scalping dow. I hope this helps you as much as it helps me and I'm sure as you see how price reacts you too can see the value in this. Please enjoy!
You can adjust the colors and remove the plot line over the candles I don't code well this is my first time I just tossed this together and I can't remove the plot line so just uncheck it.
Thank you
Deluxo Capital

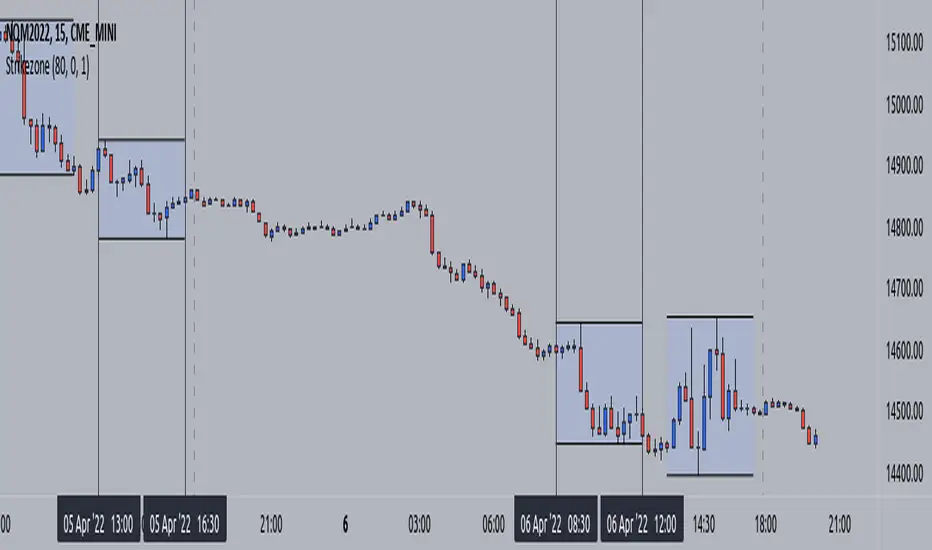
ICT KillZone [Index futures edition] Guided by new ICT Mentorship I create this versatile timezone or strikezone indicator to identify this without changing timezone (is based on America/New_York timezone, not your current timezone or GMT)
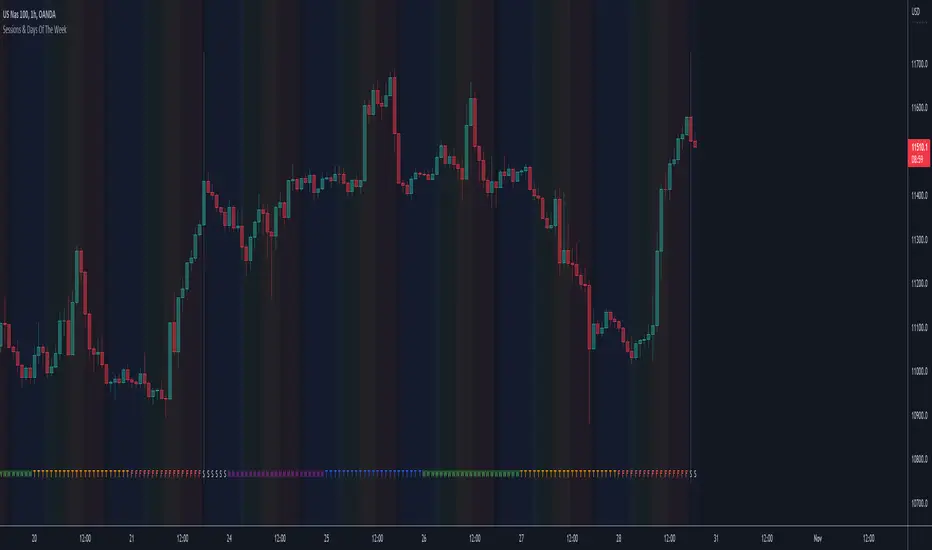
Sessions & Days Of The WeekTraders tend to focus their energy on specific sessions or time periods. This indicator will plot the days of the week, and also highlight the following sessions: Frankfurt (2:00am - 11:00am EST), London (3:00am - 12:00pm EST), New York (8:00am - 5:00pm EST), Sydney (5:00pm - 2:00am EST), Tokyo (7:00pm - 4:00am EST).
It’s important to be aware that Session Open and Close times will vary based on the time of year, as countries shift over to daylight savings time.
BANK NIFTY Constituents Technical Rating [tanayroy]Banknifty comprises 12 companies listed on the National Stock Exchange of India (NSE). Movement of Banknifty depends on these stocks. The script depicts Technical rating and price change stats of Banknifty constituents.
I have calculated the weight factor using annual floating stock stats available in Tradingview. So, it may differ considerably from the actual weight. It is just for reference.
I have found this useful in my trading.
Please like, share, and comment.

Correlation IndexShows how often and how much the underlying security deviates from the base stock.
Indices that help in the selection of securities:
Lst10 - last 10(long factor parameter) periods average
Aver - fulltime averaged
pwr - total deviation area from base
ust - unstability (drawdown index)
cor - percent of positive bars
cross - fulltime averaged deviation

Alert(), alertcondition() or strategy alerts?Variety of possibilities offered by PineScript, especially thanks to recent additions, created some confusion. Especially one question repeats quite often - which method to use to trigger alerts?
I'm posting this to clarify and give some syntax examples. I'll discuss these 3 methods in chronological order, meaning - in the order they were introduced to PineScript.
ALERTCONDITION() - it is a function call, which can be used only in study-type script. Since years ago, you could create 2 types of a script: strategy and study. First one enables creating a backtest of a strategy. Second was to develop scripts which didn't require backtesting and could trigger alerts. alertcondition() calls in strategy-type scripts were rejected by Pine compiler. On the other hand compiling study-type scripts rejected all strategy...() calls. That created difficulties, because once you had a nice and backtested strategy, you had to rip it off from all strategy...() function calls to convert your script to study-type so you could produce alerts. Maintenance of two versions of each script was necessary and it was painful.
"STRATEGY ALERTS" were introduced because of alertcondition() pains. To create strategy alert, you need to click "Add alert" button inside Strategy Tester (backtester) and only there. Alerts set-up this way are bound with the backtester - whenever backtester triggers an order, which is visible on the chart, alert is also fired. And you can customize alert message using some placeholders like {{strategy.order.contracts}} or {{ticker}}.
ALERT() was added last. This is an alerts-triggering function call, which can be run from strategy-type script. Finally it is doable! You can connect it to any event coded in PineScript and generate any alert message you want, thanks to concatenation of strings and wrapping variables into tostring() function.
Out of these three alertcondition() is obviously archaic and probably will be discontinued. There is a chance this makes strategy/study distinction not making sense anymore, so I wouldn't be surprised if "studies" are deprecated at some point.
But what are the differences between "Strategy alerts" and alert()? "Strategy alerts" seem easier to set-up with just a few clicks and probably easier to understand and verify, because they go in sync with the backtester and on-chart trade markers. It is especially important to understand how they work if you're building strategy based on pending orders (stop and limit) - events in your code might trigger placing pending order, but alert will be triggered only (and when) such order is executed.
But "Strategy Alerts" have some limitations - not every variable you'd like to include in alert message is available from PineScript. And maybe you don't need the alert fired when the trade hit a stop-loss or take-profit, because you have already forwarded info about closing conditions in entry alert to your broker/exchange.
Alert() was added to PineScript to fill all these gaps. Is allows concatenating any alert message you want, with any variable you want inside it and you can attach alert() function at any event in your PineScript code. For example - when placing orders, crossing variables, exiting trades, but not explicitly at pending orders execution.
The Verdict
"Strategy Alerts" might seem a better fit - easier to set-up and verify, flexible and they fire only when a trade really happens, not producing unnecessary mess when each pending order is placed. But these advantages are illusionary, because they don't give you the full-control which is needed when trading with real money. Especially when using pending orders. If an alert is fired when price actually hit a stop-order or limit-order level, and even if you are executing such alert within 1 second thanks to a tool like TradingConnector, you might already be late and you are making entry at a market price. Slippage will play a great role here. You need to send ordering alert when logical conditions are met - then it will be executed at the price you want. Even if you need to cancel all the pending orders which were not executed. Because of that I strongly recommend sticking to ALERT() when building your alerts system.
Below is an example strategy, showing syntax to manage placing the orders and cancelling them. Yes, this is another spin-off from my TradingView Alerts to MT4 MT5 . As usual, please don't pay attention to backtest results, as this is educational script only.
P.S. For the last time - farewell alertcondition(). You served us well.

test Xbr Super Volume 3.0A new update that can be used in liquid markets using graphical analysis.
The logic of this indicator is to automatically carry out the analysis of points where there is volume absorption, indicating on the graph through an arrow and lines from which defenses and fights can be generated.
Using this methodology we can find good moments to negotiate.
