AI Academy: Volume k-NN [PhenLabs]📊 AI Academy: Volume k-NN
Version: PineScript™ v6
━━━━━━━━━━━━━━━━━━━━━━━━━━━━━━━━━━
━━━━━━━━━━━━━━━━━━━━━━━━━━━━━━━━━━
📌 Description
AI Academy: Volume k-NN (Theory Edition) is an educational indicator designed to demystify how artificial intelligence pattern recognition works directly on your TradingView charts. Rather than being a black-box signal generator, this tool visualizes the entire k-Nearest Neighbors algorithm process in real-time, showing you exactly how AI identifies similar historical patterns and generates predictions.
The indicator scans up to 2,000 historical bars to find patterns that match your current price action, then uses an ensemble of the closest matches to project potential future movement. What sets this apart is the integrated “AI Grimoire”—an interactive educational book overlay that teaches core machine learning concepts through four illuminating chapters.
Whether you’re a trader curious about AI methodology or a developer learning algorithmic concepts, this indicator transforms abstract machine learning theory into tangible, visual understanding.
━━━━━━━━━━━━━━━━━━━━━━━━━━━━━━━━━━
━━━━━━━━━━━━━━━━━━━━━━━━━━━━━━━━━━
🚀 Points of Innovation
• First TradingView indicator to visualize k-NN algorithm execution in real-time with full transparency
• Interactive “AI Grimoire” educational overlay teaches machine learning concepts while you trade
• Dual-mode pattern matching combines price action with optional volume confirmation
• Confidence-based opacity system visually communicates prediction reliability
• Historical match visualization shows exactly which past patterns informed the prediction
• Ghost bar projections display averaged ensemble predictions with adjustable forecast horizons
━━━━━━━━━━━━━━━━━━━━━━━━━━━━━━━━━━
🔧 Core Components
• Pattern Capture Engine: Converts recent price action into logarithmic returns for normalized comparison across different price levels
• k-NN Search Algorithm: Calculates Euclidean distance between current pattern and historical patterns to find closest matches
• Volume Weighting System: Optional feature that incorporates volume patterns into distance calculations with adjustable influence
• Ensemble Predictor: Averages future returns from k-nearest historical matches to generate consensus forecast
• Confidence Calculator: Measures average distance of top matches to determine prediction reliability on 0-100% scale
• AI Grimoire Display: Table-based educational overlay rendering book-style content with chapter navigation
━━━━━━━━━━━━━━━━━━━━━━━━━━━━━━━━━━
🔥 Key Features
• Adjustable Pattern Length: Define how many bars constitute the current pattern for matching (5-100 bars)
• Configurable Search Depth: Control how far back the algorithm searches for historical matches (500-4,900 bars)
• Flexible k-Neighbors: Select how many closest matches inform the prediction (1-20 neighbors)
• Volume Toggle: Enable or disable volume pattern matching for different market conditions
• Volume Influence Slider: Fine-tune the weight given to volume vs. price patterns (0-100%)
• Ghost Bar Count: Adjust how many future bars the indicator projects (3-15 bars)
• Minimum Confidence Filter: Set threshold to hide low-confidence predictions
• Historical Match Display: Toggle visibility of colored boxes marking source patterns
━━━━━━━━━━━━━━━━━━━━━━━━━━━━━━━━━━
🎨 Visualization
• Blue Scanner Box: Highlights current pattern being analyzed labeled “AI INPUT (The Prompt)”
• Green Historical Boxes: Mark past patterns where price subsequently moved bullish
• Red Historical Boxes: Mark past patterns where price subsequently moved bearish
• Ghost Bars: Semi-transparent candles projecting into the future showing predicted price path
• Confidence Label: Displays prediction confidence percentage and number of matches used
• AI Grimoire Book: Leather-bound book overlay in top-right corner with navigable chapters
━━━━━━━━━━━━━━━━━━━━━━━━━━━━━━━━━━
📖 Usage Guidelines
Algorithm Settings
• Pattern Length — Default: 20 | Range: 5-100 | Controls how many recent bars define the pattern. Shorter values find more matches but less specific. Longer values find fewer but more precise matches.
• Search Depth — Default: 2000 | Range: 500-4900 | Determines how many historical bars to scan. Higher values find more potential matches but increase computation time.
• k-Neighbors — Default: 5 | Range: 1-20 | Number of closest matches to use for prediction. Higher values smooth predictions but may dilute strong signals.
• Ghost Bar Count — Default: 5 | Range: 3-15 | How many future bars to project. Shorter horizons are typically more reliable.
• Use Volume Matching — Default: Off | When enabled, patterns must match on both price AND volume characteristics.
• Volume Influence — Default: 30% | Range: 0-100% | Weight given to volume pattern when volume matching is enabled.
Visualization Settings
• Bullish/Bearish Match Colors — Customize colors for historical match boxes based on outcome direction.
• Min Confidence % — Default: 60 | Predictions below this threshold will not display.
• Show Historical Matches — Default: On | Toggle visibility of source pattern boxes on chart.
Education Settings
• Select Chapter — Navigate through AI Grimoire chapters or keep book closed for clean chart view.
━━━━━━━━━━━━━━━━━━━━━━━━━━━━━━━━━━
✅ Best Use Cases
• Learning how k-Nearest Neighbors algorithm functions in a trading context
• Understanding the relationship between historical patterns and forward predictions
• Identifying when current market conditions resemble past scenarios
• Supplementing discretionary analysis with pattern-based confluence
• Teaching others machine learning concepts through visual demonstration
• Validating whether volume confirms price pattern formations
• Building intuition for what AI “sees” when analyzing charts
━━━━━━━━━━━━━━━━━━━━━━━━━━━━━━━━━━
⚠️ Limitations
• Past pattern similarity does not guarantee future outcome similarity
• Requires sufficient historical data (minimum 500+ bars) to function properly
• Computation-intensive on lower timeframes with maximum search depth
• Cannot predict truly novel “black swan” events not represented in historical data
• Volume matching less effective on assets with inconsistent volume reporting
• Predictions become less reliable as forecast horizon extends further out
• Educational overlay may obstruct chart view on smaller screens
━━━━━━━━━━━━━━━━━━━━━━━━━━━━━━━━━━
💡 What Makes This Unique
• Full Transparency: Unlike black-box AI tools, every step of the algorithm is visualized on your chart
• Integrated Education: The AI Grimoire teaches machine learning concepts without leaving TradingView
• Theory Meets Practice: See exactly which historical patterns inform each prediction
• Honest Uncertainty: Confidence scoring and opacity fading acknowledge when the AI “doesn’t know”
• Dual-Mode Analysis: Optional volume weighting adds institutional-quality analysis dimension
━━━━━━━━━━━━━━━━━━━━━━━━━━━━━━━━━━
🔬 How It Works
1. Pattern Capture: On each bar, the indicator captures the most recent price changes as logarithmic returns, creating a normalized “fingerprint” of current market behavior. If volume matching is enabled, volume changes are captured similarly.
2. Historical Search: The algorithm iterates through up to 2,000 historical bars, calculating the Euclidean distance between the current pattern fingerprint and each historical pattern. Distance combines price similarity and optional volume similarity based on weight settings.
3. Neighbor Selection: All historical patterns are ranked by similarity (lowest distance = most similar). The k-closest matches are selected as the “ensemble council” that will inform the prediction.
4. Confidence Calculation: Average distance of top-k matches determines confidence. Tighter clustering of similar patterns yields higher confidence scores, while scattered or distant matches produce lower confidence.
5. Prediction Generation: Future returns from each historical match (what happened AFTER those patterns) are averaged together. This ensemble average is applied to current price to generate ghost bar projections.
6. Visualization: Historical match locations are marked with colored boxes (green for bullish outcomes, red for bearish). Ghost bars render with opacity tied to confidence level—higher confidence means more solid bars.
━━━━━━━━━━━━━━━━━━━━━━━━━━━━━━━━━━
💡 Note:
This indicator is designed primarily for educational purposes —to help traders understand how AI pattern recognition algorithms function. While the predictions can supplement your analysis, they should never be used as the sole basis for trading decisions. The AI Grimoire chapters explain key concepts including why AI “hallucinates” during unprecedented market events. Always combine with proper risk management and additional confirmation.
━━━━━━━━━━━━━━━━━━━━━━━━━━━━━━━━━━
Intelligence

Smart Adaptive Signal SystemSmart Adaptive Signal System
Description: The Smart Adaptive Signal System is a sophisticated indicator that generates intelligent buy/sell signals by dynamically adapting to market conditions. It predicts target prices based on momentum and volatility, providing more accurate and reliable trading opportunities.
How It Works:
Dynamic Signal Generation: The system predicts target prices by considering factors such as volatility and momentum. This allows it to react instantly to trend changes and market fluctuations.
Adaptive Thresholds: Buy and sell signals are triggered with adaptive thresholds, adjusting according to market volatility. This ensures flexibility in the face of sudden market changes.
Trend-Based Reset: Users can choose to reset threshold values based on a time interval or trend change. This feature helps the system re-adapt to current market conditions for greater accuracy.
Target Price Prediction: Target prices are calculated using momentum and volatility, helping the system predict future price movements.
How to Use:
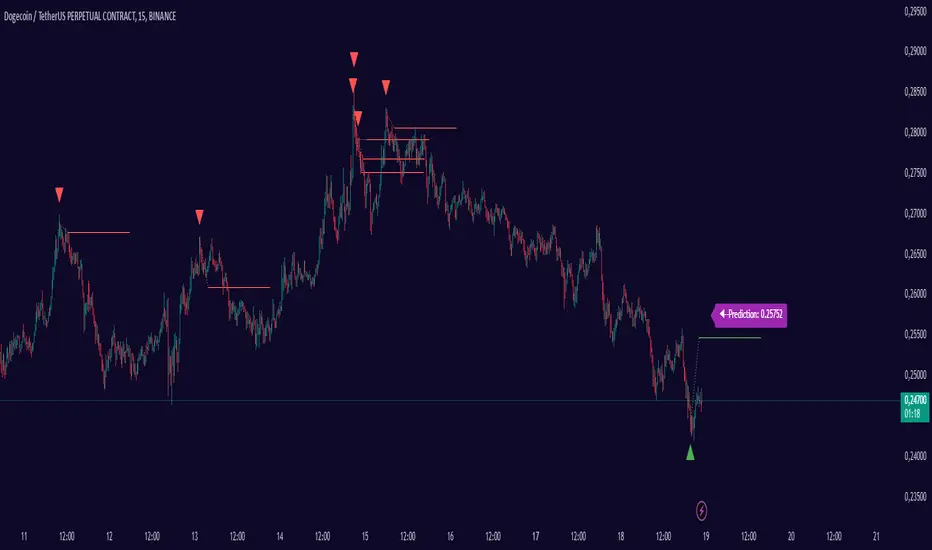
Buy/Sell Signals: The indicator generates buy and sell signals based on market conditions. Look for a "down arrow" for a buy signal and an "up arrow" for a sell signal on the chart.
Target Price Lines: Along with buy and sell signals, the system draws target price lines. This helps you visualize potential future price levels.
Flexible Settings: Users can customize analysis periods, minimum change percentages, and other parameters to fit their needs.
Features:
Dynamic buy and sell signals
Target price predictions
Volatility and momentum-based analysis
User-friendly and flexible settings
Trend-based adaptive resetting
Alerts: The Smart Adaptive Signal System responds quickly to sudden market changes, but always use it in conjunction with other indicators like support and resistance levels. Signal accuracy may vary depending on market conditions.
Intelligent Moving AverageFor 4 simple moving averages, the script tests every single combination for maximum profitability and finds the best pair.
Combinations:
sma1 and sma2,
sma1 and sma3,
sma1 and sma4,
sma2 and sma3,
sma2 and sma4,
sma3 and sma4
And then paint the pair which get best performance. sma lengths are optional, so you can change lengths as you wish.
You will see in some charts that for example sma1 and sma2 pair was best perfrmance and colored on the chart but then sma2 and sma3 pair got better performance, so script starts to paint sma2 and sma3. so it's dynamic based on best performance.
keep in mind => length1 < length2 < length3 < length4 will be better
I didn't have enough time to test the script, so please comment when you test it.
by LonesomeTheBlue
